
Dividend growth stocks (2026)
The 50 stocks below have a combined market cap of $11.2T; the best performer of 2026 is LRCX (+98.7% YTD). Large caps that have raised the dividend every year for 10 or more years, ranked by how fast the payment has grown over five years. Not investment advice.
End of day 2026-10-01 · 50 entries · digits update live during market hours
Top 50 by five-year dividend growth, among 10+ year raisers
Save as watchlist
Technical analysis0
Addendum charts0
Overlay lines0
Columns (15 shown)
| # Company | CategoryCategory | 1Y1Y chart | |||||||||||||
|---|---|---|---|---|---|---|---|---|---|---|---|---|---|---|---|
| FIXComfort Systems USA | Industrials | $1,686.54 | +1.96% | +8.4% | -9.6% | +80.6% | +102.0% | +2175.6% | +40.4% | 13 | +0.21% | $3.60 | 6% | $59B | |
| DKSDick's Sporting Goods | Consumer Discretionary | $132.91 | -1.03% | -0.1% | -42.2% | -32.9% | -42.9% | +9.1% | +31.2% | 11 | +3.76% | $5.00 | 53% | $12B | |
| PAGPenske Automotive Group | Consumer Discretionary | $202.90 | +1.28% | -6.5% | +14.5% | +28.1% | +14.8% | +98.7% | +26.9% | 14 | +2.84% | $5.76 | 40% | $13B | |
| TSCOTractor Supply | Consumer Discretionary | $31.73 | +1.41% | -8.6% | -1.6% | -36.6% | -43.3% | -21.2% | +23.5% | 12+ | +3.03% | $0.96 | 49% | $17B | |
| ZTSZoetis | Healthcare | $69.09 | -1.06% | -10.6% | -4.6% | -45.1% | -53.0% | -64.8% | +20.1% | 12+ | +3.07% | $2.12 | 34% | $29B | |
| MSCIMSCI | Financials | $545.72 | +1.31% | -3.1% | -6.3% | -4.9% | -1.3% | -10.7% | +18.2% | 11+ | +1.50% | $8.20 | 42% | $40B | |
| DHID.R. Horton | Consumer Discretionary | $137.07 | +0.31% | -3.0% | -12.7% | -4.8% | -20.5% | +63.7% | +17.6% | 12 | +1.31% | $1.80 | 17% | $38B | |
| MASMasco | Industrials | $68.30 | +1.33% | -2.8% | -16.4% | +7.6% | -2.8% | +22.2% | +17.2% | 12 | +1.87% | $1.28 | 29% | $13B | |
| KLACKLA | Technology | $200.28 | +2.74% | +17.2% | -24.7% | +64.9% | +77.5% | +498.0% | +16.1% | 12+ | +0.46% | $0.92 | 22% | $262B | |
| NDSNNordson | Industrials | $329.02 | +0.36% | +4.7% | +11.3% | +36.8% | +44.0% | +37.4% | +16.0% | 12 | +1.14% | $3.76 | 33% | $18B | |
| CSLCarlisle Companies | Industrials | $325.28 | +0.96% | -2.9% | -9.9% | +1.7% | -1.9% | +61.3% | +15.9% | 30+ | +1.54% | $5.00 | 25% | $13B | |
| VVisa | Financials | $359.97 | +0.18% | -3.4% | +2.5% | +2.6% | +3.5% | +56.1% | +15.9% | 17 | +0.74% | $2.68 | 22% | $672B | |
| AFLAFLAC | Financials | $111.16 | -0.55% | -4.2% | -6.2% | +0.8% | +0.4% | +110.0% | +15.7% | 14 | +2.20% | $2.44 | 25% | $56B | |
| INTUIntuit | Technology | $282.66 | +2.52% | -18.0% | +5.9% | -57.3% | -58.4% | -48.0% | +15.3% | 12+ | +1.70% | $4.80 | 30% | $76B | |
| LLYEli Lilly | Healthcare | $1,150.05 | -0.61% | -0.9% | -3.5% | +7.0% | +39.3% | +400.8% | +15.2% | 11 | +0.60% | $6.92 | 22% | $1.03T | |
| DHRDanaher | Healthcare | $211.74 | -4.43% | +2.3% | +9.3% | -7.5% | -0.5% | -21.0% | +14.9% | 12 | +0.76% | $1.60 | 24% | $149B | |
| LOWLowe's Companies | Consumer Discretionary | $182.37 | -1.04% | -8.8% | -17.8% | -24.4% | -26.5% | -10.5% | +14.9% | 23 | +2.74% | $5.00 | 41% | $102B | |
| STLDSteel Dynamics | Materials | $226.20 | +2.07% | -3.4% | +2.0% | +33.5% | +60.4% | +288.0% | +14.9% | 13+ | +0.94% | $2.12 | 18% | $32B | |
| LRCXLam Research | Technology | $339.80 | +3.44% | +17.2% | -13.1% | +98.7% | +138.2% | +496.9% | +14.9% | 11+ | +0.39% | $1.32 | 17% | $425B | |
| SNASnap-On | Industrials | $367.77 | +1.22% | -3.5% | -8.8% | +6.7% | +6.5% | +75.6% | +14.7% | 16 | +2.65% | $9.76 | 48% | $19B | |
| EGPEastGroup Properties | Real Estate | $194.83 | -1.33% | -2.6% | -5.2% | +9.4% | +13.2% | +15.3% | +14.4% | 14 | +3.18% | $6.20 | 106% | $10B | |
| KRKroger | Consumer Staples | $59.49 | +1.48% | +2.7% | +5.8% | -4.8% | -10.6% | +52.0% | +14.2% | 19 | +2.62% | $1.56 | 82% | $35B | |
| MRSHMarsh | Financials | $171.85 | +0.66% | -8.4% | -0.2% | -7.4% | -14.6% | +11.5% | +14.1% | 16 | +2.30% | $3.96 | 44% | $82B | |
| RSReliance | Industrials | $392.96 | +2.13% | +0.8% | +5.5% | +36.1% | +38.8% | +174.4% | +13.9% | 15 | +1.27% | $5.00 | — | $20B | |
| MAMastercard | Financials | $550.50 | -0.18% | -5.4% | +5.3% | -3.7% | -4.1% | +52.7% | +13.7% | 14 | +0.63% | $3.48 | 18% | $482B | |
| TXRHTexas Roadhouse | Consumer Discretionary | $156.72 | +0.24% | -18.2% | -18.2% | -5.6% | -3.8% | +64.6% | +13.6% | 12+ | +1.91% | $3.00 | 46% | $10B | |
| COSTCostco Wholesale | Consumer Staples | $914.99 | +0.51% | -2.7% | -1.1% | +6.1% | -0.3% | +104.1% | +13.2% | 12+ | +0.64% | $5.88 | 25% | $406B | |
| ALLAllstate | Financials | $224.47 | +1.18% | -13.0% | -7.7% | +7.8% | +6.5% | +75.7% | +13.1% | 15 | +1.92% | $4.32 | 8% | $57B | |
| ADPAutomatic Data Processing | Industrials | $263.94 | +2.28% | -6.9% | +12.0% | +2.6% | -9.5% | +30.7% | +12.8% | 11 | +2.58% | $6.80 | 60% | $105B | |
| LOGILogitech International | Technology | $103.29 | +2.28% | +5.3% | +9.2% | +3.1% | -5.9% | +16.7% | +12.8% | 12+ | +1.63% | $1.68 | 29% | $15B | |
| AVGOBroadcom | Technology | $343.80 | -2.10% | -7.0% | -7.0% | -0.7% | +3.1% | +605.1% | +12.5% | 12+ | +0.76% | $2.60 | 32% | $1.64T | |
| ELVElevance Health | Healthcare | $381.79 | -1.81% | -5.3% | -8.3% | +8.9% | +14.7% | +1.5% | +12.5% | 14+ | +1.80% | $6.88 | 30% | $83B | |
| BROBrown & Brown | Financials | $61.79 | +1.46% | -14.3% | -8.3% | -22.5% | -33.4% | +7.2% | +12.3% | 30+ | +1.07% | $0.66 | 18% | $21B | |
| SHWSherwin-Williams | Materials | $320.89 | -0.74% | -2.8% | -7.3% | -1.0% | -6.0% | +12.5% | +12.1% | 30+ | +1.00% | $3.20 | 29% | $78B | |
| UNHUnitedHealth Group | Healthcare | $365.13 | -0.53% | -7.8% | -14.4% | +10.6% | +4.9% | -6.9% | +12.1% | 16 | +2.54% | $9.28 | 57% | $328B | |
| PLDPrologis | Real Estate | $128.21 | -1.26% | -8.2% | -6.3% | +0.4% | +10.0% | +1.4% | +11.7% | 12 | +3.34% | $4.28 | 103% | $120B | |
| BBYBest Buy | Consumer Discretionary | $87.72 | -0.59% | +6.1% | +13.6% | +31.0% | +13.4% | -16.7% | +11.6% | 12 | +4.38% | $3.84 | 63% | $18B | |
| MSIMotorola Solutions | Technology | $448.19 | +0.50% | -8.8% | +6.9% | +16.9% | -1.9% | +91.2% | +11.3% | 14 | +1.08% | $4.84 | 36% | $74B | |
| BRBroadridge Financial Solutions | Industrials | $161.17 | +0.04% | -10.7% | +14.3% | -27.8% | -31.3% | -2.9% | +11.1% | 18 | +2.71% | $4.36 | 39% | $18B | |
| WSOWatsco | Consumer Discretionary | $301.19 | -0.50% | -4.4% | -26.1% | -10.6% | -25.5% | +12.6% | +11.1% | 12 | +4.38% | $13.20 | 105% | $12B | |
| MCOMoody's | Financials | $447.45 | -1.47% | -9.6% | -4.5% | -12.4% | -6.8% | +24.5% | +10.9% | 16 | +0.92% | $4.12 | 25% | $77B | |
| TGTTarget | Consumer Staples | $156.63 | -0.04% | -4.3% | +20.3% | +60.3% | +75.8% | -31.4% | +10.9% | 24 | +2.96% | $4.64 | 47% | $71B | |
| NDAQNasdaq | Financials | $91.67 | -0.37% | -6.0% | +10.8% | -5.6% | +5.5% | +42.0% | +10.6% | 12+ | +1.35% | $1.24 | 32% | $51B | |
| ABTAbbott Laboratories | Healthcare | $96.70 | -2.16% | -11.2% | +4.9% | -22.8% | -27.6% | -17.5% | +10.4% | 30+ | +2.61% | $2.52 | 79% | $167B | |
| JBHTJ.B. Hunt Transport Services | Industrials | $227.28 | +1.44% | -11.4% | -21.7% | +16.9% | +71.2% | +36.2% | +10.3% | 12 | +0.79% | $1.80 | 25% | $21B | |
| MSFTMicrosoft | Technology | $513.11 | +0.04% | +2.4% | +33.4% | +6.0% | -1.3% | +77.4% | +10.2% | 12 | +0.71% | $3.64 | 20% | $3.81T | |
| UPSUnited Parcel Service | Industrials | $93.91 | +0.50% | -8.5% | -14.3% | -5.3% | +11.3% | -48.3% | +10.2% | 16 | +6.99% | $6.56 | 118% | $80B | |
| NEENextEra Energy | Utilities | $76.35 | +0.81% | -7.9% | -11.6% | -4.9% | -2.9% | -3.6% | +10.1% | 30+ | +3.26% | $2.49 | 53% | $159B | |
| AONAon | Financials | $276.01 | -0.27% | -15.4% | -19.7% | -21.8% | -23.4% | -5.2% | +10.1% | 14 | — | $3.28 | 17% | $59B | |
| SCIService Corporation International | Consumer Discretionary | $76.52 | +0.49% | -6.1% | -0.3% | -1.9% | -7.6% | +25.9% | +10.1% | 15 | +1.88% | $1.44 | 35% | $10B |
Methodology
Large caps that have raised their regular dividend in every complete calendar year for at least the last ten, ranked by the five-year compound annual growth rate (CAGR) of the per-share payment. The streak counts complete years in our own dividend record — a year counts as a raise when its last regular payment exceeds the prior year's — and a plus sign means it reaches the start of the record, which begins in 1995 for the oldest payers, so the true streak may be longer. Special dividends and spin-off distributions are excluded from the streak, the growth rate and the annual dividend. A high growth rate from a low base is not the same thing as a high yield: the yield and payout ratio columns are there to keep the two apart.
Performance columns are price returns: the change in the split-adjusted share price, the way quote screens report it, through the latest print during the session. Dividends are not reinvested. Fundamentals come from company filings via our EDGAR pipeline. Past performance does not predict future returns; this is not investment advice.
FAQ#
- Which dividend growth stock has grown its dividend the fastest?
- Among large caps with at least ten consecutive years of raises, Comfort Systems USA Inc. (FIX) has grown its regular dividend the fastest over the last five years, at +40.4% a year compounded (CAGR), from a current yield of 0.21%.
- What are the top 10 dividend growth stocks?
- The 10 fastest five-year dividend growth rates (CAGR) among large caps with 10+ years of consecutive raises: 1. FIX +40.4%/yr, 2. DKS +31.2%/yr, 3. PAG +26.9%/yr, 4. TSCO +23.5%/yr, 5. ZTS +20.1%/yr, 6. MSCI +18.2%/yr, 7. DHI +17.6%/yr, 8. MAS +17.2%/yr, 9. KLAC +16.1%/yr, 10. NDSN +16.0%/yr.
- Which of these stocks has the longest streak of dividend increases?
- The longest streaks on the list are CSL (30+ years), BRO (30+ years), SHW (30+ years), ABT (30+ years), NEE (30+ years), TGT (24 years), LOW (23 years), KR (19 years). A plus sign means the streak reaches the start of our record, which begins in 1995 for most long-lived payers, so it may be longer.
- What is a dividend growth stock?
- A company that raises its dividend year after year, usually because earnings and cash flow are growing and management treats the payment as a commitment. This list requires at least ten consecutive complete calendar years of increases and ranks by how fast the payment grew over the last five, so a stock near the top has a growing income stream rather than the highest yield today; the highest yields are on the high-dividend list.
More lists
Highest realized shareholder yield
50 stocksShares actually retired plus dividends — the cash-over-market-cap version flatters fallen stocks.
Highest fundamental return
50 stocksEarnings growth plus cash returned — the annual return the business made, before any re-rating.
Highest realized buyback yield
50 stocksShares actually retired over the past year — the buyback measure a collapsed stock price can't flatter.
Highest dividend stocks
50 stocksThe 50 highest dividend yields among US-listed large caps, each one checked against dividends actually paid in the past year.
25+ years of dividend increases
Every US-listed large cap that has raised its dividend for 25 or more consecutive years in our record, longest streak first.
Monthly dividend stocks & ETFs
Every stock and fund in the universe that pays twelve times a year, ranked by yield — covered-call income funds, bond funds and the monthly-paying REITs.
Explore visualizations
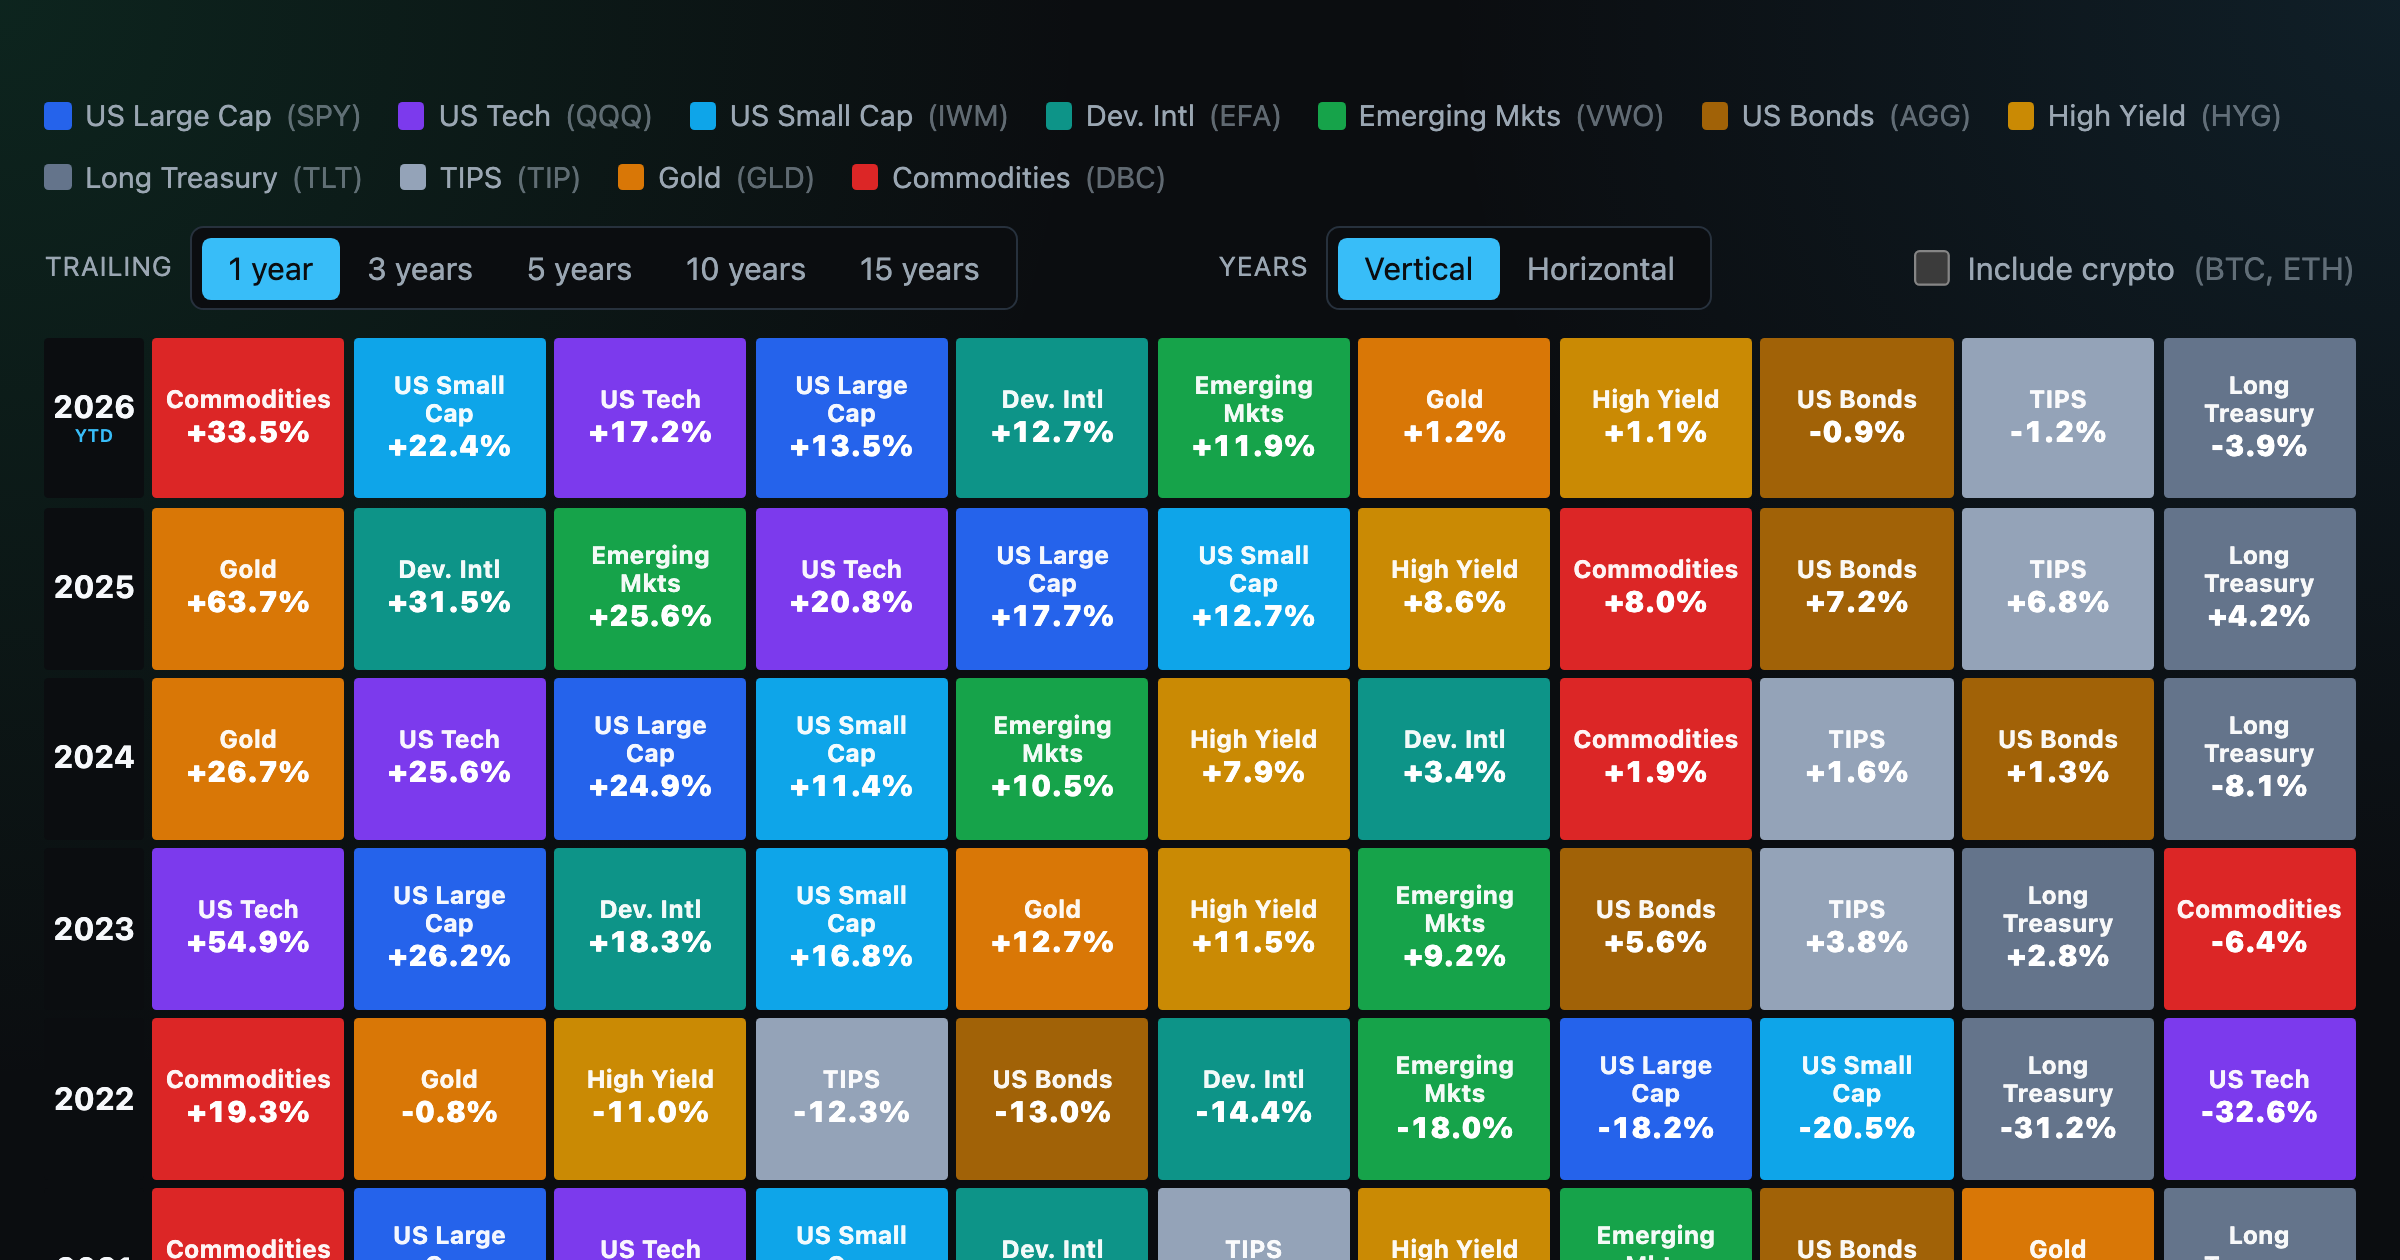
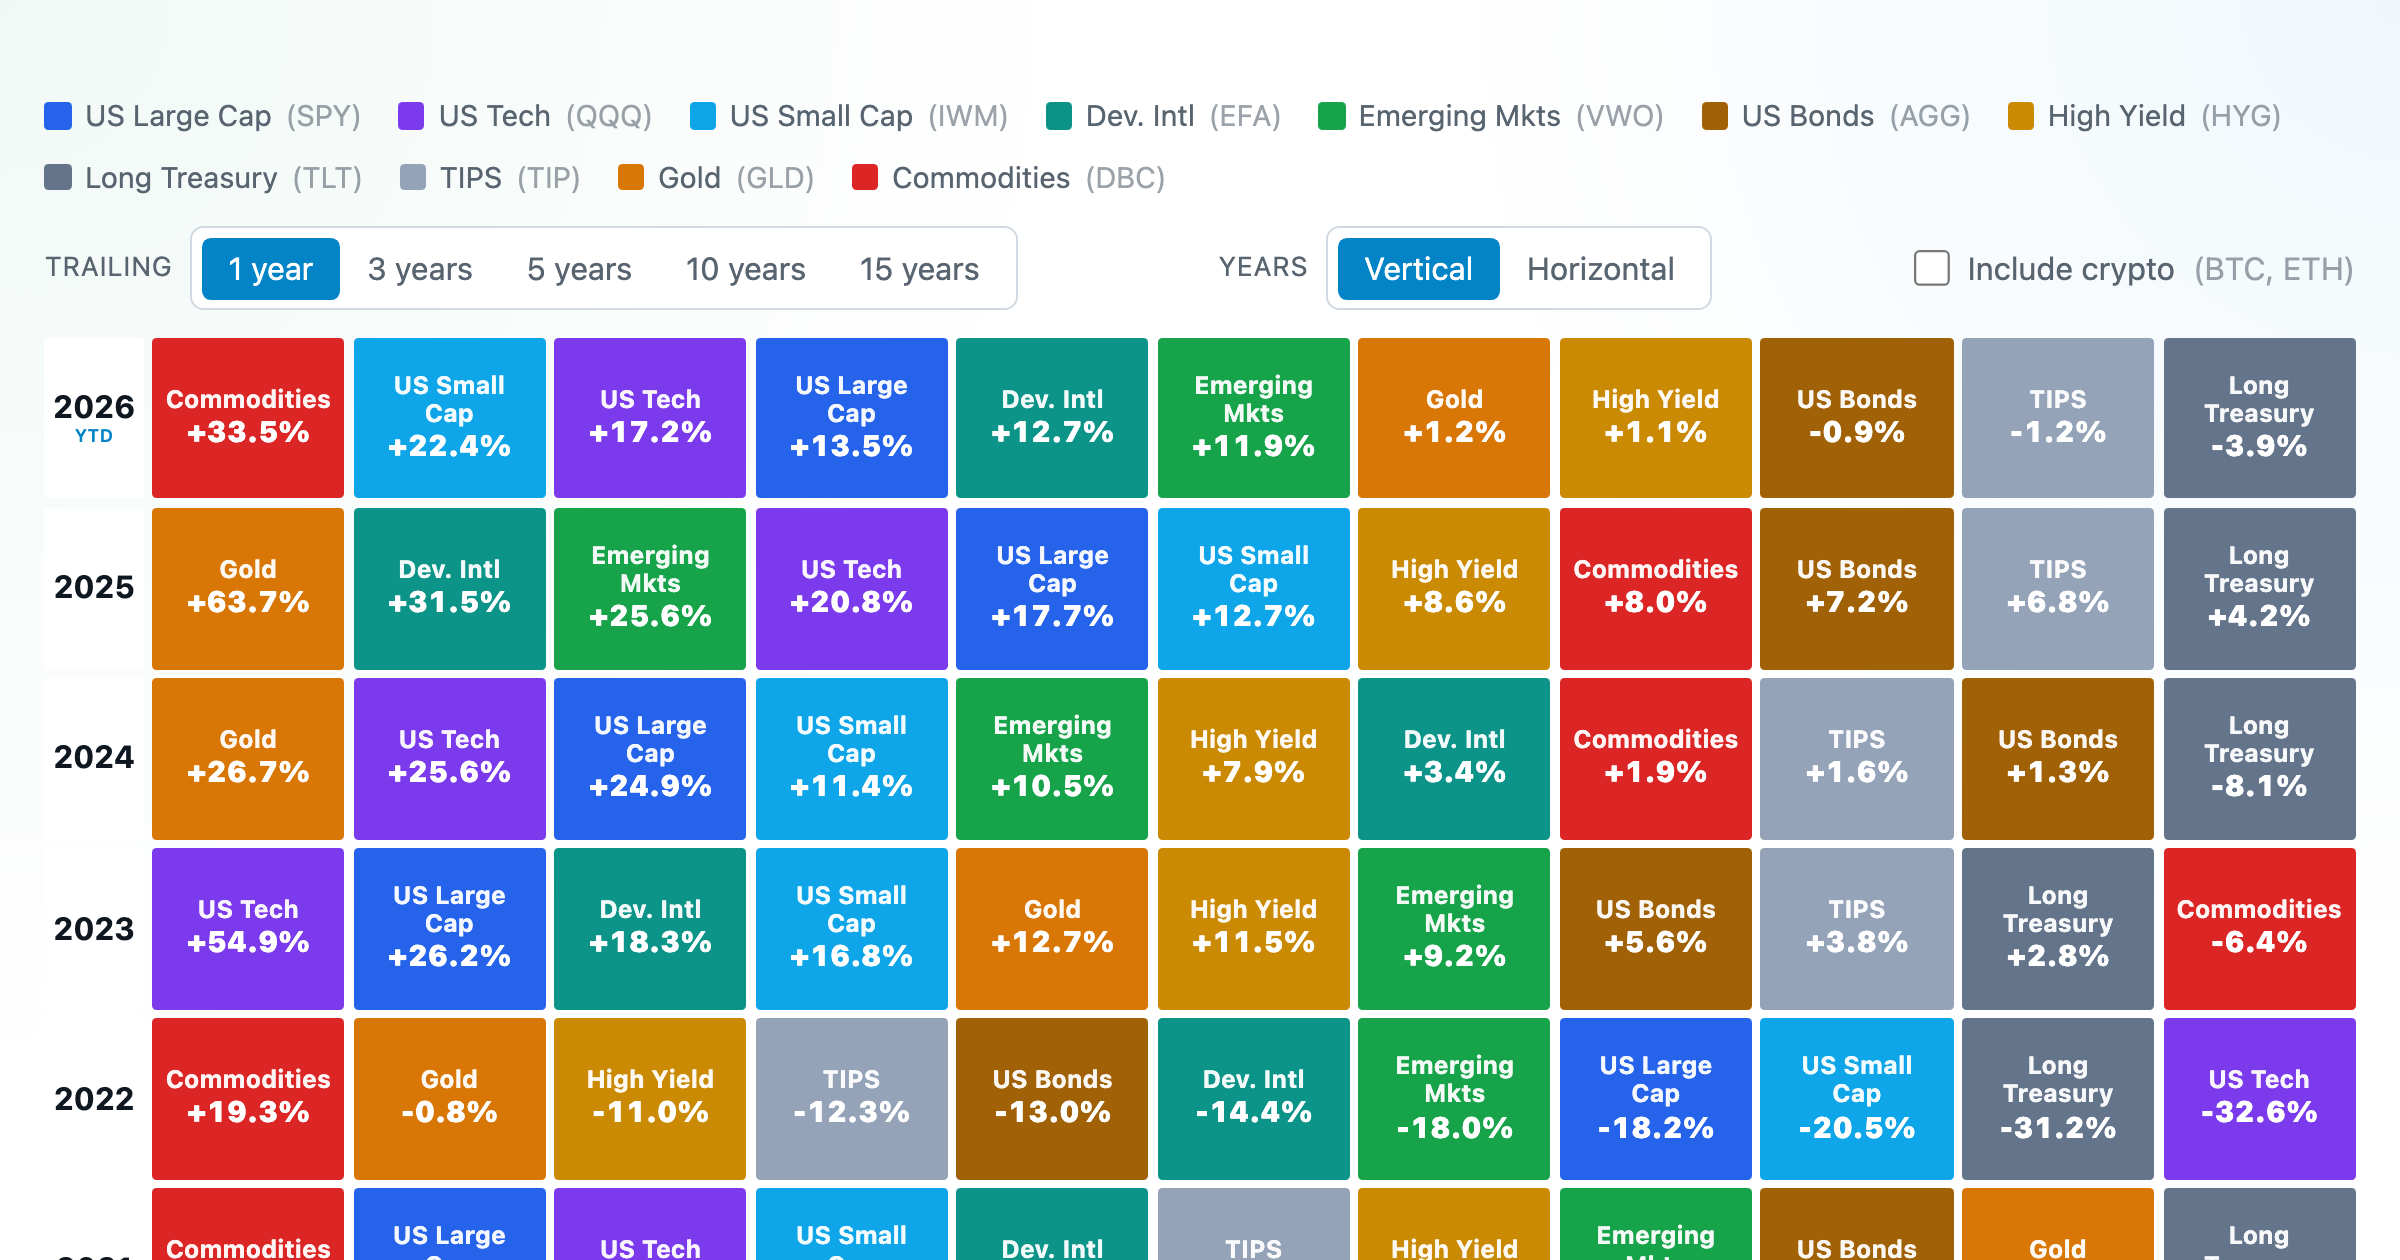
Asset-class returns ranked year by year — the Callan chart / asset allocation quilt.
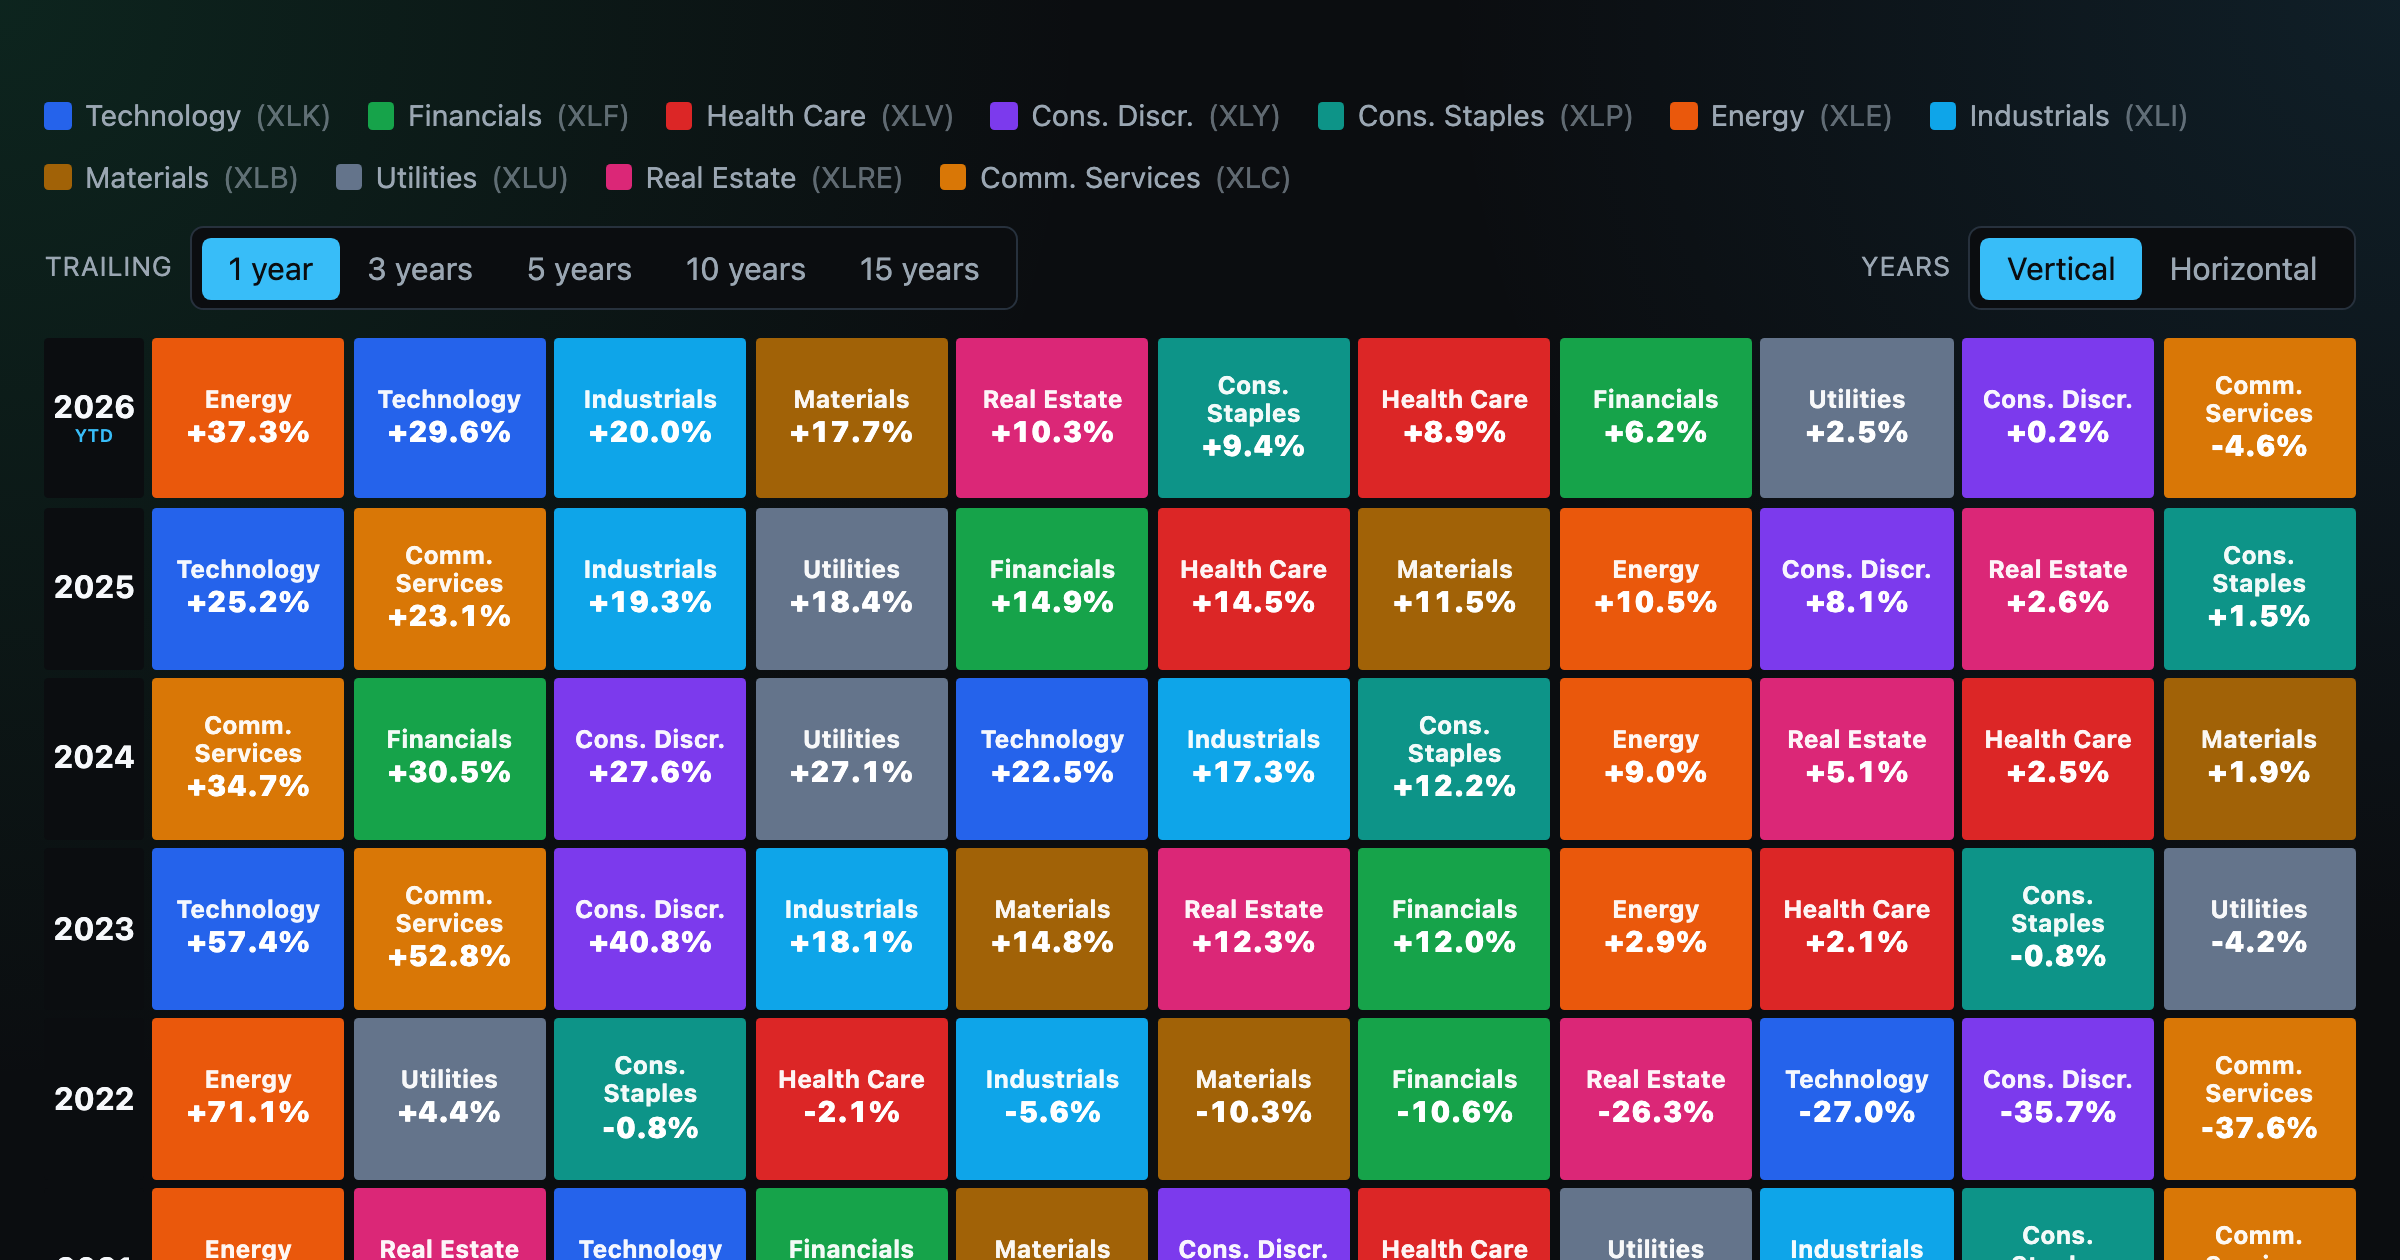
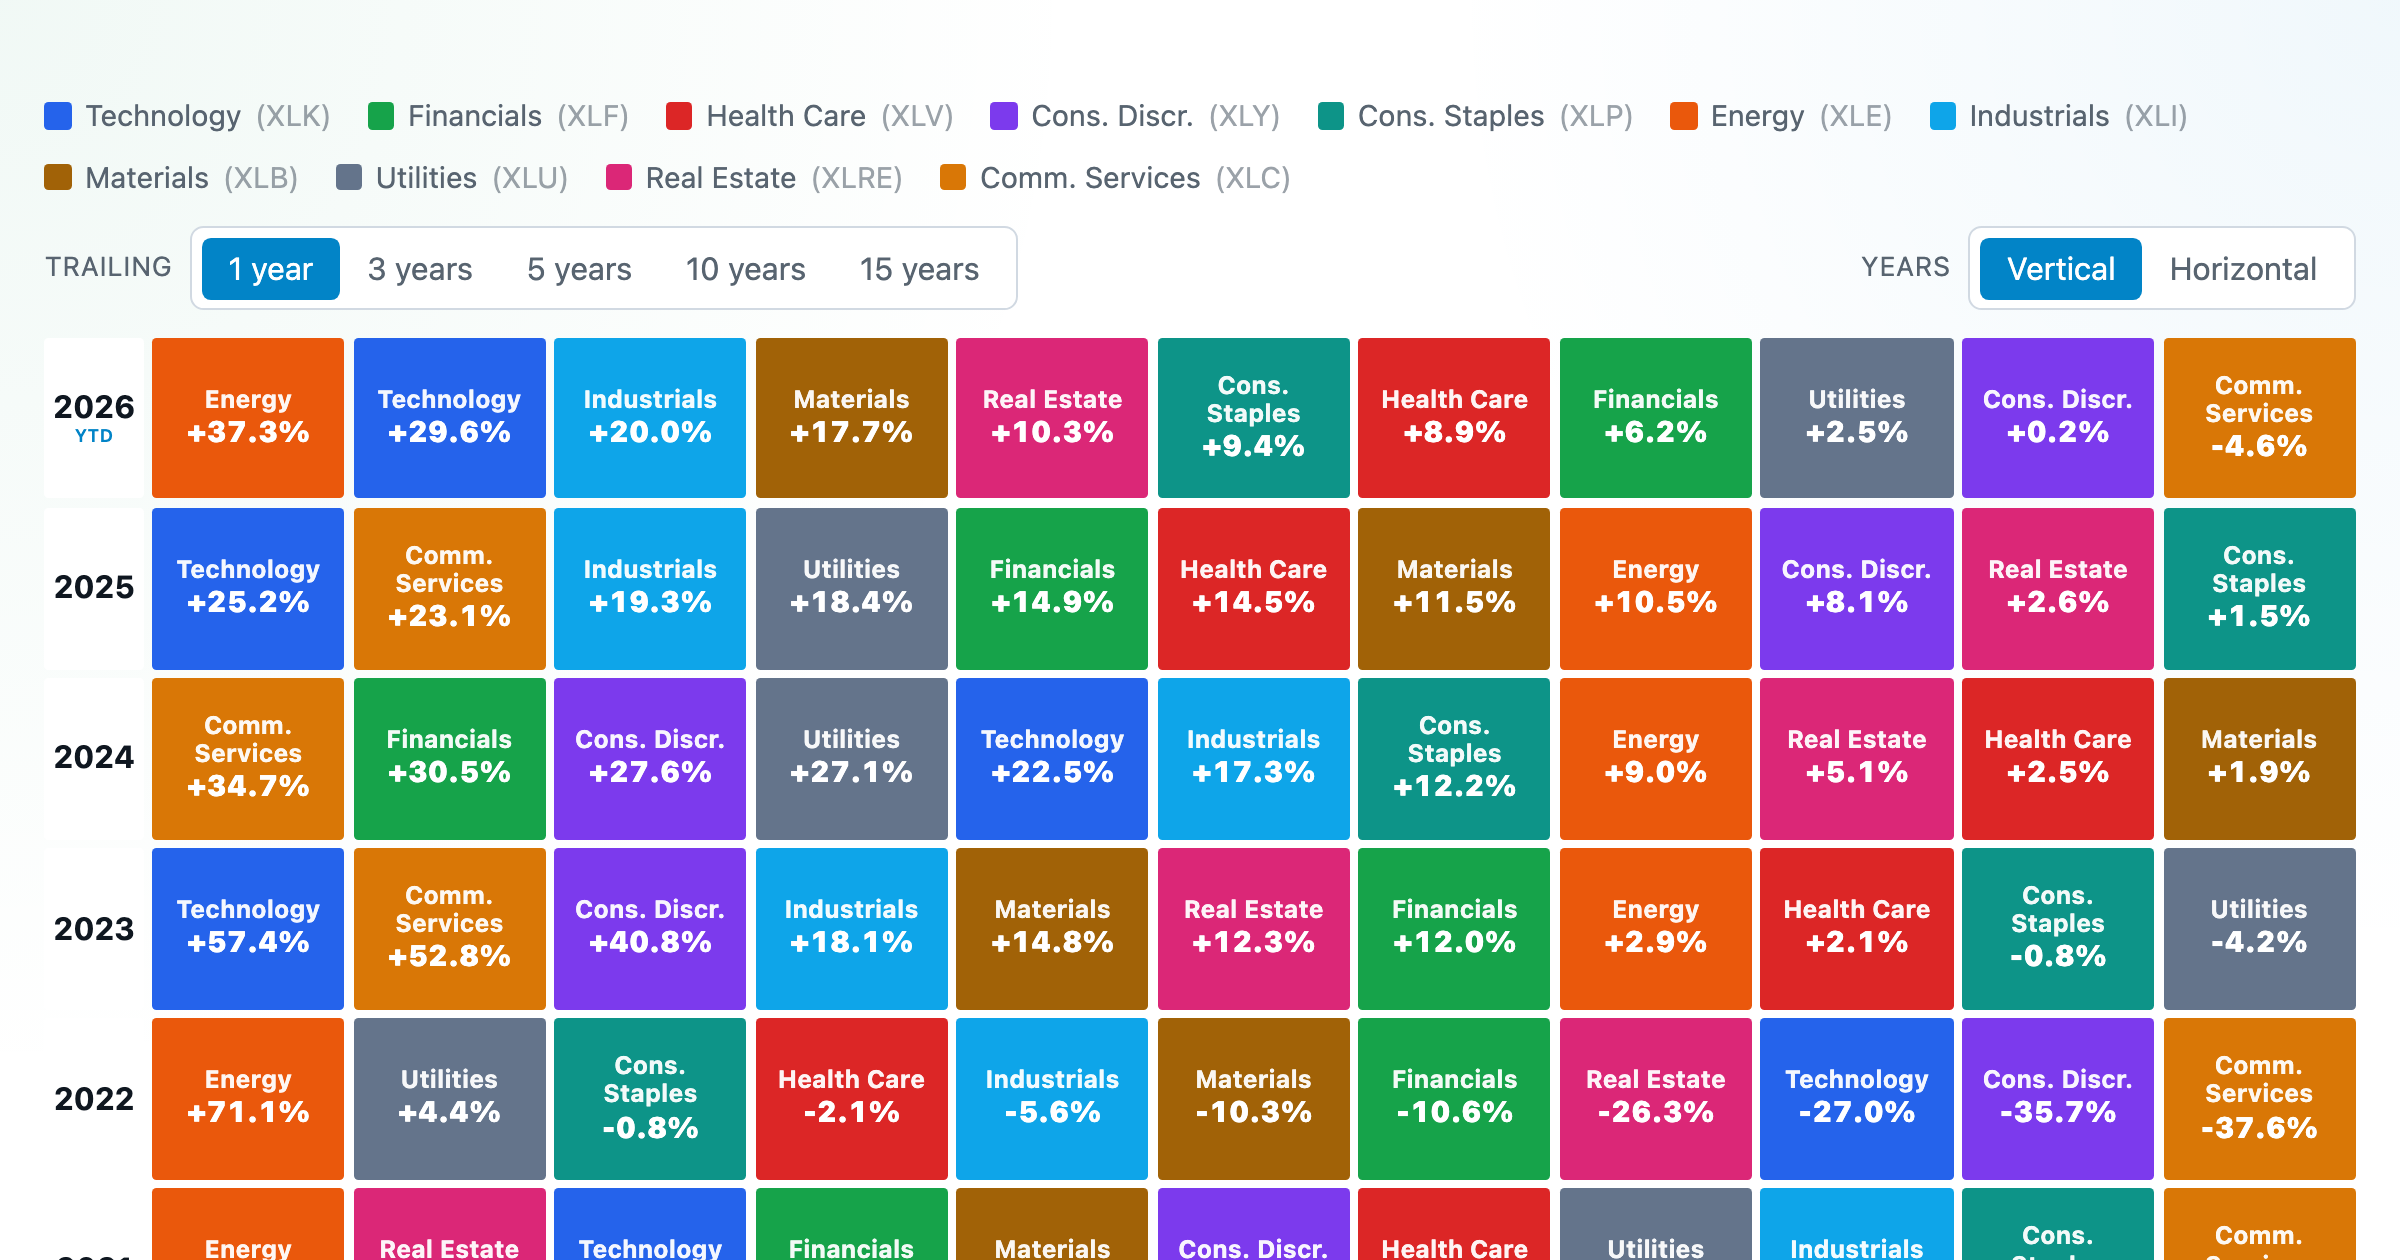
The 11 S&P 500 sectors ranked year by year — a sector quilt chart, back to 1999.
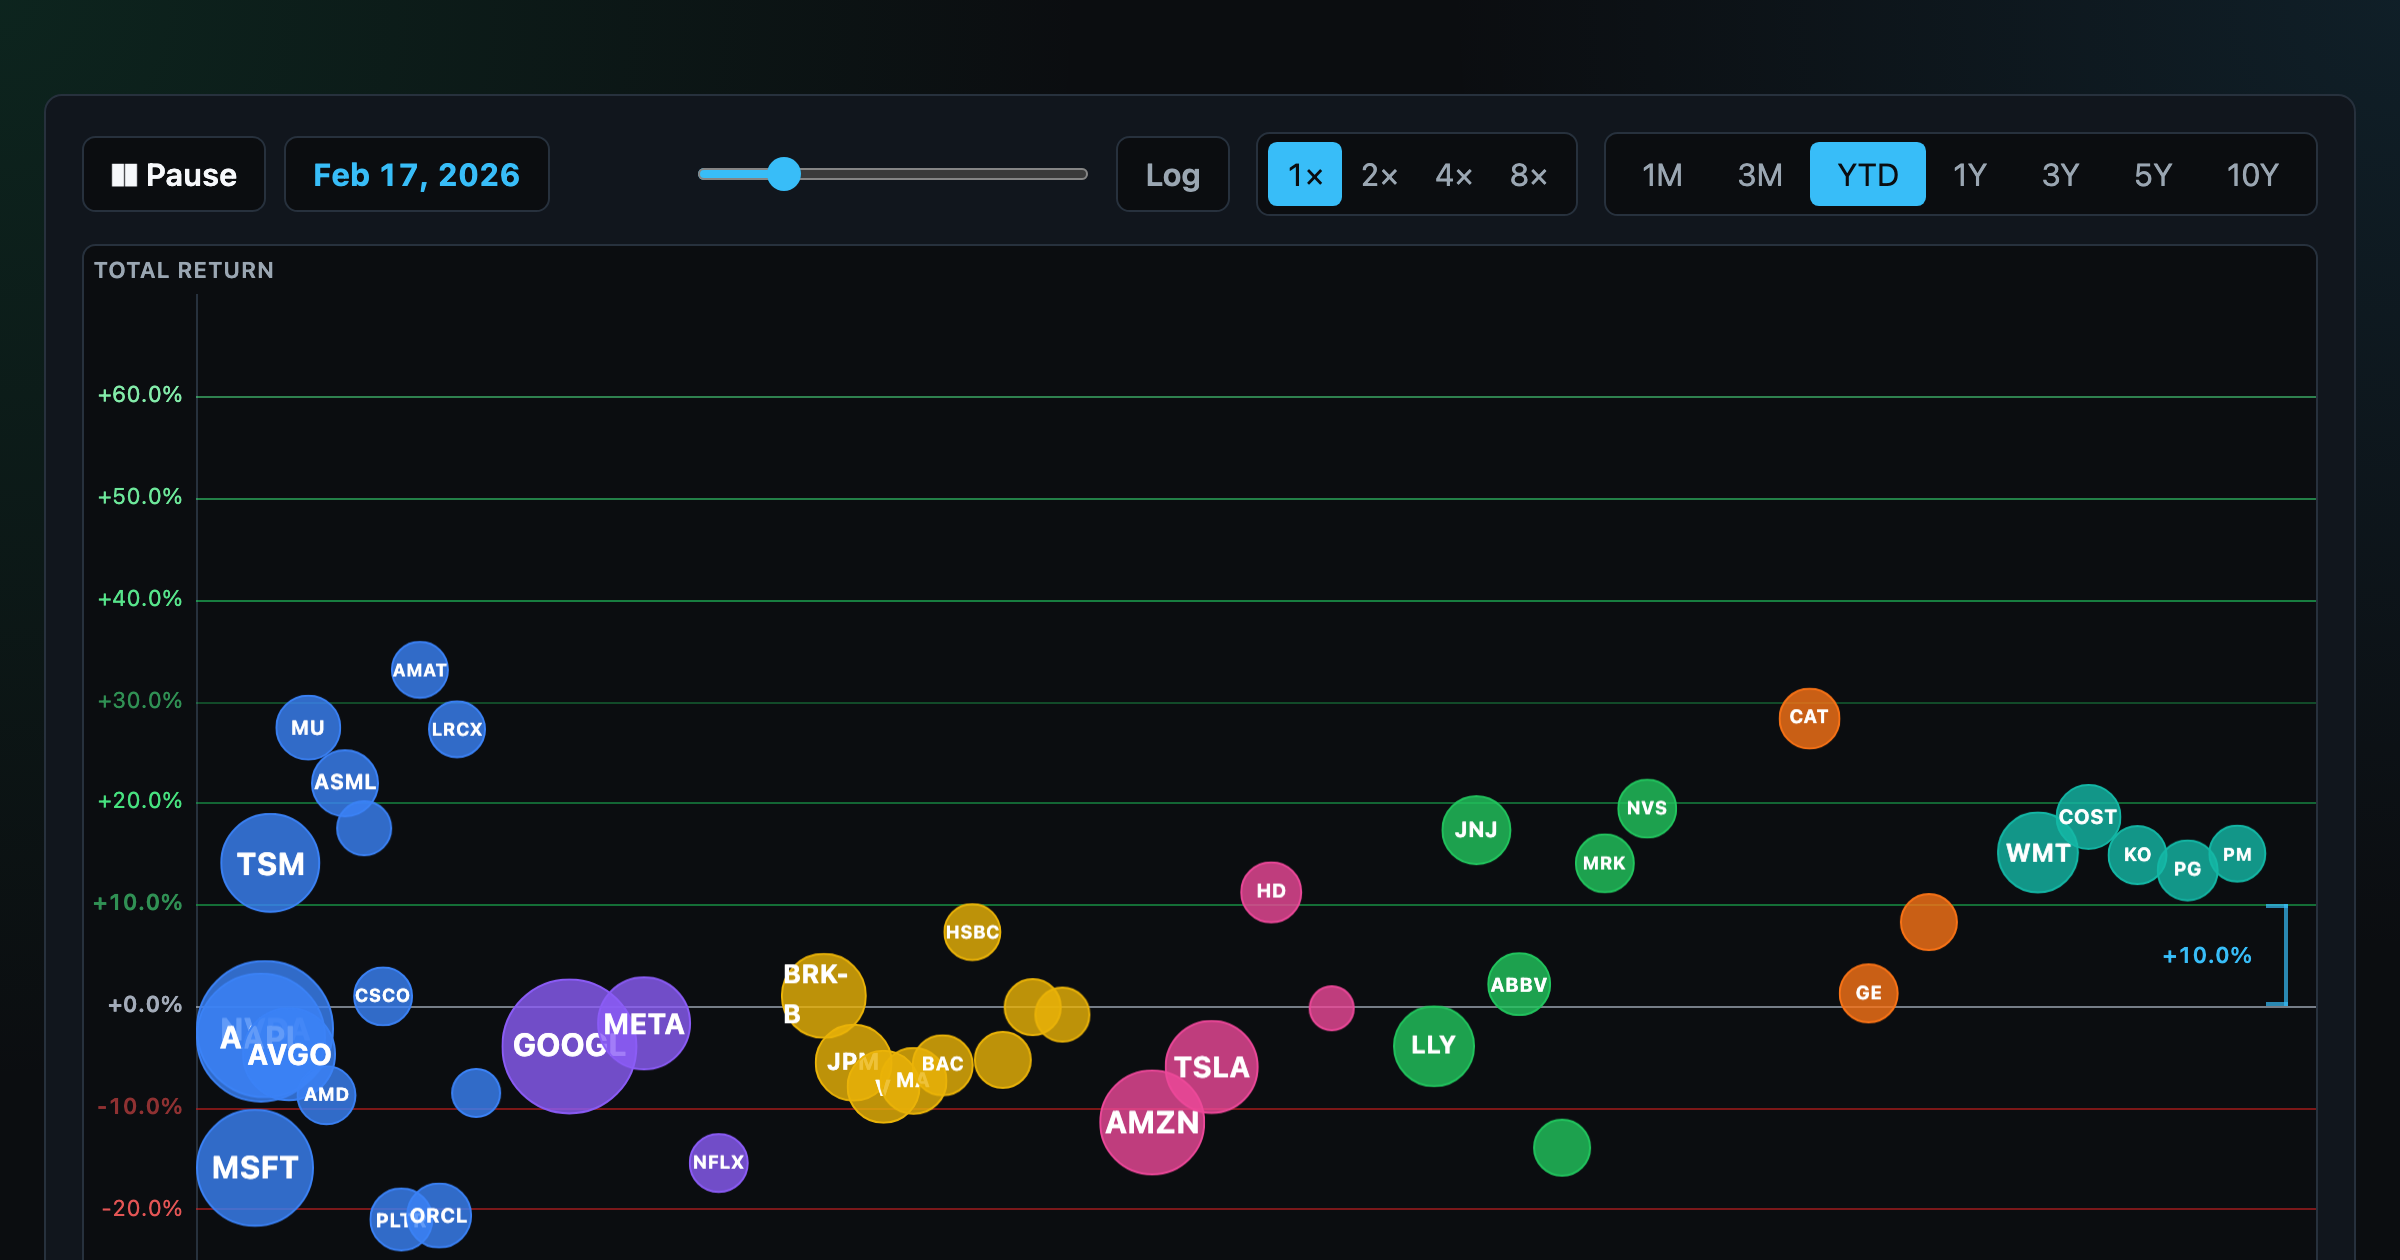
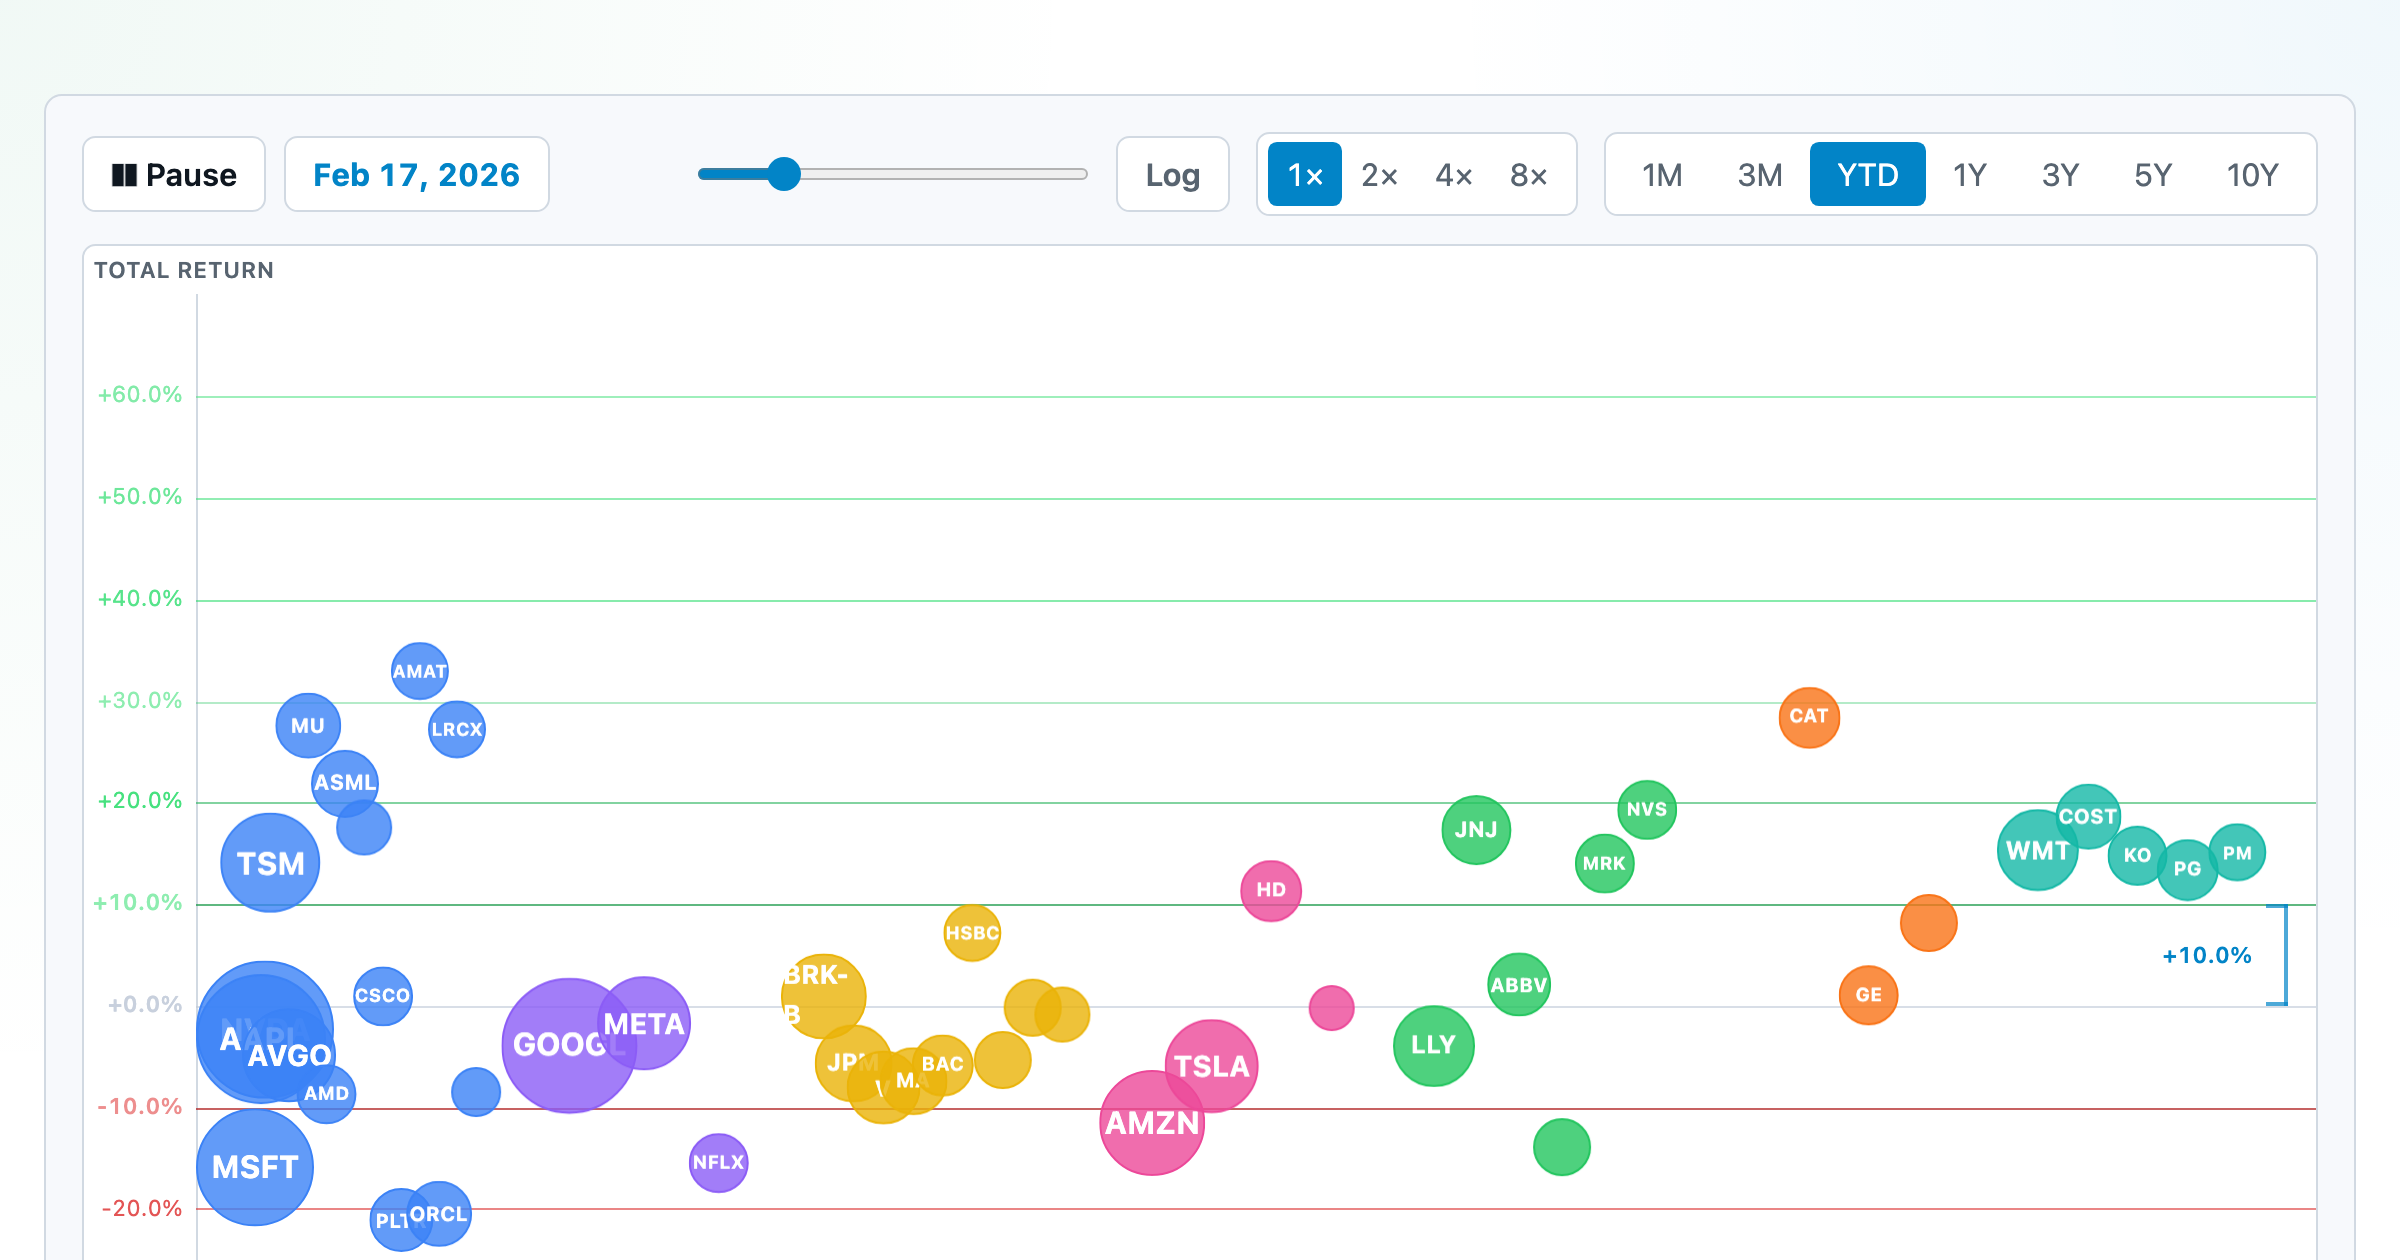
The biggest US companies as animated bubbles, rising and falling with their total return over time.