
Monthly dividend stocks & ETFs (2026)
The 33 stocks and funds below have a combined market cap of $1.2T; the best performer of 2026 is QYLD (+5.1% YTD). Every stock and fund in the universe that pays twelve times a year, ranked by yield — covered-call income funds, bond funds and the monthly-paying REITs. Not investment advice.
End of day 2026-10-01 · 33 entries · digits update live during market hours
Top 33 monthly payers by forward yield
Save as watchlist
Technical analysis0
Addendum charts0
Overlay lines0
Columns (14 shown)
| # Company | CategoryCategory | 1Y1Y chart | ||||||||||||
|---|---|---|---|---|---|---|---|---|---|---|---|---|---|---|
| AGNCAGNC Investment | Real Estate | $8.95 | -1.32% | -15.6% | -17.1% | -16.5% | -9.9% | -43.7% | +16.09% | $1.44 | 77% | Sep 30, 2026 | $11B | |
| JEPQJPMorgan Nasdaq Equity Premium Income ETF | — | $60.80 | -0.75% | +3.1% | +1.0% | +4.6% | +6.3% | — | +13.47% | $8.19 | — | Sep 1, 2026 | $41B | |
| QYLDGlobal X Nasdaq 100 Covered Call ETF | — | $18.58 | +0.13% | +2.2% | +1.4% | +5.1% | +8.9% | -16.2% | +11.42% | $2.12 | — | Sep 21, 2026 | $8B | |
| XYLDGlobal X S&P 500 Covered Call ETF | — | $41.57 | +0.12% | +0.6% | +1.8% | +2.3% | +5.7% | -15.0% | +8.54% | $3.55 | — | Sep 21, 2026 | $3B | |
| JEPIJPMorgan Equity Premium Income ETF | — | $55.93 | -0.52% | -1.9% | -0.3% | -2.3% | -1.6% | -6.4% | +7.96% | $4.45 | — | Sep 1, 2026 | $45B | |
| JNKSPDR Bloomberg High Yield Bond ETF | — | $92.29 | -0.50% | -3.1% | -3.7% | -5.1% | -5.5% | -15.5% | +6.92% | $6.38 | — | Sep 1, 2026 | $7B | |
| HYGiShares iBoxx $ High Yield Corporate Bond ETF | — | $76.89 | -0.41% | -2.8% | -3.4% | -4.6% | -5.0% | -12.0% | +6.79% | $5.22 | — | Sep 1, 2026 | $16B | |
| VCLTVanguard Long-Term Corporate Bond ETF | — | $68.41 | -0.13% | -4.1% | -8.4% | -9.8% | -11.9% | -35.7% | +6.34% | $4.34 | — | Sep 1, 2026 | $7B | |
| VWOBVanguard Emerging Markets Government Bond ETF | — | $62.69 | -0.70% | -4.2% | -6.2% | -7.0% | -6.1% | -19.6% | +6.14% | $3.85 | — | Sep 1, 2026 | $6B | |
| ORealty Income | Real Estate | $53.53 | -1.42% | -12.8% | -13.4% | -5.0% | -11.5% | -16.1% | +6.08% | $3.25 | — | Aug 31, 2026 | $51B | |
| VTCVanguard Total Corporate Bond ETF | — | $72.61 | -0.23% | -2.6% | -5.0% | -6.5% | -7.3% | -20.7% | +5.41% | $3.93 | — | Sep 1, 2026 | $2B | |
| VCITVanguard Intermediate-Term Corporate Bond ETF | — | $78.14 | -0.22% | -2.8% | -4.9% | -6.7% | -7.1% | -17.5% | +5.22% | $4.08 | — | Sep 1, 2026 | $61B | |
| LQDiShares iBoxx $ Investment Grade Corporate Bond ETF | — | $102.07 | -0.11% | -3.0% | -5.9% | -7.4% | -8.5% | -23.7% | +5.22% | $5.33 | — | Sep 1, 2026 | $30B | |
| VGLTVanguard Long-Term Treasury ETF | — | $50.08 | -0.13% | -4.7% | -8.4% | -10.3% | -11.8% | -43.2% | +5.16% | $2.58 | — | Sep 1, 2026 | $10B | |
| DIVOAmplify CWP Enhanced Dividend Income ETF | — | $46.47 | -0.04% | -3.4% | +1.5% | +4.4% | +4.5% | +31.9% | +5.04% | $2.34 | — | Aug 28, 2026 | $7B | |
| TLTiShares 20+ Year Treasury Bond ETF | — | $77.71 | -0.09% | -5.1% | -9.1% | -10.8% | -13.0% | -46.5% | +4.86% | $3.78 | — | Sep 1, 2026 | $43B | |
| VCSHVanguard Short-Term Corporate Bond ETF | — | $77.10 | -0.19% | -1.2% | -2.0% | -3.3% | -3.3% | -6.4% | +4.72% | $3.64 | — | Sep 1, 2026 | $40B | |
| BIVVanguard Intermediate-Term Bond ETF | — | $72.79 | -0.10% | -2.7% | -4.6% | -6.5% | -6.8% | -18.8% | +4.70% | $3.42 | — | Sep 1, 2026 | $28B | |
| VMBSVanguard Mortgage-Backed Securities ETF | — | $44.38 | -0.07% | -3.1% | -4.7% | -5.7% | -5.5% | -16.8% | +4.50% | $2.00 | — | Sep 1, 2026 | $14B | |
| IEFiShares 7-10 Year Treasury Bond ETF | — | $89.30 | -0.01% | -3.0% | -5.0% | -7.1% | -7.5% | -22.8% | +4.46% | $3.98 | — | Sep 1, 2026 | $48B | |
| VGITVanguard Intermediate-Term Treasury ETF | — | $56.65 | -0.02% | -2.1% | -3.5% | -5.5% | -5.6% | -16.3% | +4.37% | $2.47 | — | Sep 1, 2026 | $38B | |
| BNDVanguard Total Bond Market ETF | — | $70.09 | -0.09% | -2.4% | -4.1% | -5.4% | -5.7% | -18.1% | +4.33% | $3.03 | — | Sep 1, 2026 | $153B | |
| AGGiShares Core U.S. Aggregate Bond ETF | — | $94.43 | -0.12% | -2.4% | -4.1% | -5.5% | -5.7% | -17.9% | +4.28% | $4.04 | — | Sep 1, 2026 | $136B | |
| VUSBVanguard Ultra-Short Bond ETF | — | $49.41 | -0.29% | -0.3% | -0.4% | -0.9% | -0.8% | -1.5% | +4.23% | $2.09 | — | Sep 1, 2026 | $9B | |
| BSVVanguard Short-Term Bond ETF | — | $76.29 | -0.14% | -1.1% | -1.7% | -3.2% | -3.2% | -6.9% | +4.22% | $3.22 | — | Sep 1, 2026 | $44B | |
| SHViShares Short Treasury Bond ETF | — | $110.04 | -0.25% | +0.0% | +0.0% | -0.1% | -0.1% | -0.4% | +3.69% | $4.06 | — | Sep 1, 2026 | $21B | |
| BILSPDR Bloomberg 1-3 Month T-Bill ETF | — | $91.41 | -0.26% | +0.0% | +0.0% | +0.0% | -0.1% | -0.1% | +3.68% | $3.36 | — | Sep 1, 2026 | $47B | |
| SGOViShares 0-3 Month Treasury Bond ETF | — | $100.41 | -0.27% | +0.0% | +0.0% | +0.0% | +0.0% | +0.4% | +3.67% | $3.68 | — | Sep 1, 2026 | $92B | |
| VTEBVanguard Tax-Exempt Bond ETF | — | $47.46 | +0.21% | -3.1% | -5.9% | -5.6% | -5.0% | -13.2% | +3.62% | $1.72 | — | Sep 1, 2026 | $41B | |
| SHYiShares 1-3 Year Treasury Bond ETF | — | $81.10 | -0.12% | -0.6% | -0.9% | -2.1% | -2.1% | -5.9% | +3.61% | $2.93 | — | Sep 1, 2026 | $25B | |
| VGSHVanguard Short-Term Treasury ETF | — | $57.49 | -0.12% | -0.6% | -0.9% | -2.1% | -2.1% | -6.4% | +3.50% | $2.01 | — | Sep 1, 2026 | $27B | |
| MUBiShares National Muni Bond ETF | — | $101.32 | +0.22% | -2.9% | -5.6% | -5.4% | -4.7% | -12.7% | +3.43% | $3.48 | — | Sep 1, 2026 | $45B | |
| BITOProShares Bitcoin Strategy ETF | — | $11.33 | +1.16% | +9.2% | +39.4% | -6.8% | -41.7% | — | +1.17% | $0.13 | — | Sep 1, 2026 | $2B |
Methodology
Every stock and exchange-traded fund in the universe whose regular distribution has gone ex twelve times a year over the last two complete years, ranked by forward yield — the latest regular payment times twelve, over the last close. Most of the list is funds: covered-call income ETFs, whose distributions are partly option premium and can fall with volatility, core bond ETFs, whose payouts track interest rates, and futures-based funds such as a bitcoin strategy ETF, whose distributions are realized gains rather than income and can be very large one year and nothing the next. Only two large-cap stocks pay monthly. A yield here is a run-rate, not a promise: an option-income fund's next payment is set each month. The payout ratio is filed net income and applies to the stocks only; a fund's column is blank.
Performance columns are price returns: the change in the split-adjusted share price, the way quote screens report it, through the latest print during the session. Dividends are not reinvested. Fundamentals come from company filings via our EDGAR pipeline. Past performance does not predict future returns; this is not investment advice.
FAQ#
- Which monthly dividend stock or ETF has the highest yield?
- AGNC Investment Corp. (AGNC) has the highest forward yield among monthly payers in the universe, about 16.09% — the latest regular payment times twelve, over the last close.
- What are the top 10 monthly dividend payers by yield?
- The 10 highest forward yields among stocks and ETFs that pay every month: 1. AGNC 16.09%, 2. JEPQ 13.47%, 3. QYLD 11.42%, 4. XYLD 8.54%, 5. JEPI 7.96%, 6. JNK 6.92%, 7. HYG 6.79%, 8. VCLT 6.34%, 9. VWOB 6.14%, 10. O 6.08%.
- Which stocks pay monthly dividends?
- Only 2 large-cap stocks pay monthly: AGNC Investment Corp. (AGNC, 16.09%), Realty Income Corporation (O, 6.08%). Nearly every other monthly payer is a fund; 31 of them are on this list.
- Are monthly dividends better than quarterly?
- Only for cash flow. Twelve smaller payments and four larger ones add up to the same annual yield, and reinvesting monthly compounds only a few basis points faster. What matters is what the payment is made of: a covered-call fund's monthly distribution is partly option premium and moves with volatility, and a bond fund's tracks interest rates, so a high monthly yield is a run-rate rather than a fixed income.
More lists
Highest realized shareholder yield
50 stocksShares actually retired plus dividends — the cash-over-market-cap version flatters fallen stocks.
Highest fundamental return
50 stocksEarnings growth plus cash returned — the annual return the business made, before any re-rating.
Highest realized buyback yield
50 stocksShares actually retired over the past year — the buyback measure a collapsed stock price can't flatter.
Highest dividend stocks
50 stocksThe 50 highest dividend yields among US-listed large caps, each one checked against dividends actually paid in the past year.
Dividend growth stocks
50 stocksLarge caps that have raised the dividend every year for 10 or more years, ranked by how fast the payment has grown over five years.
25+ years of dividend increases
Every US-listed large cap that has raised its dividend for 25 or more consecutive years in our record, longest streak first.
Explore visualizations
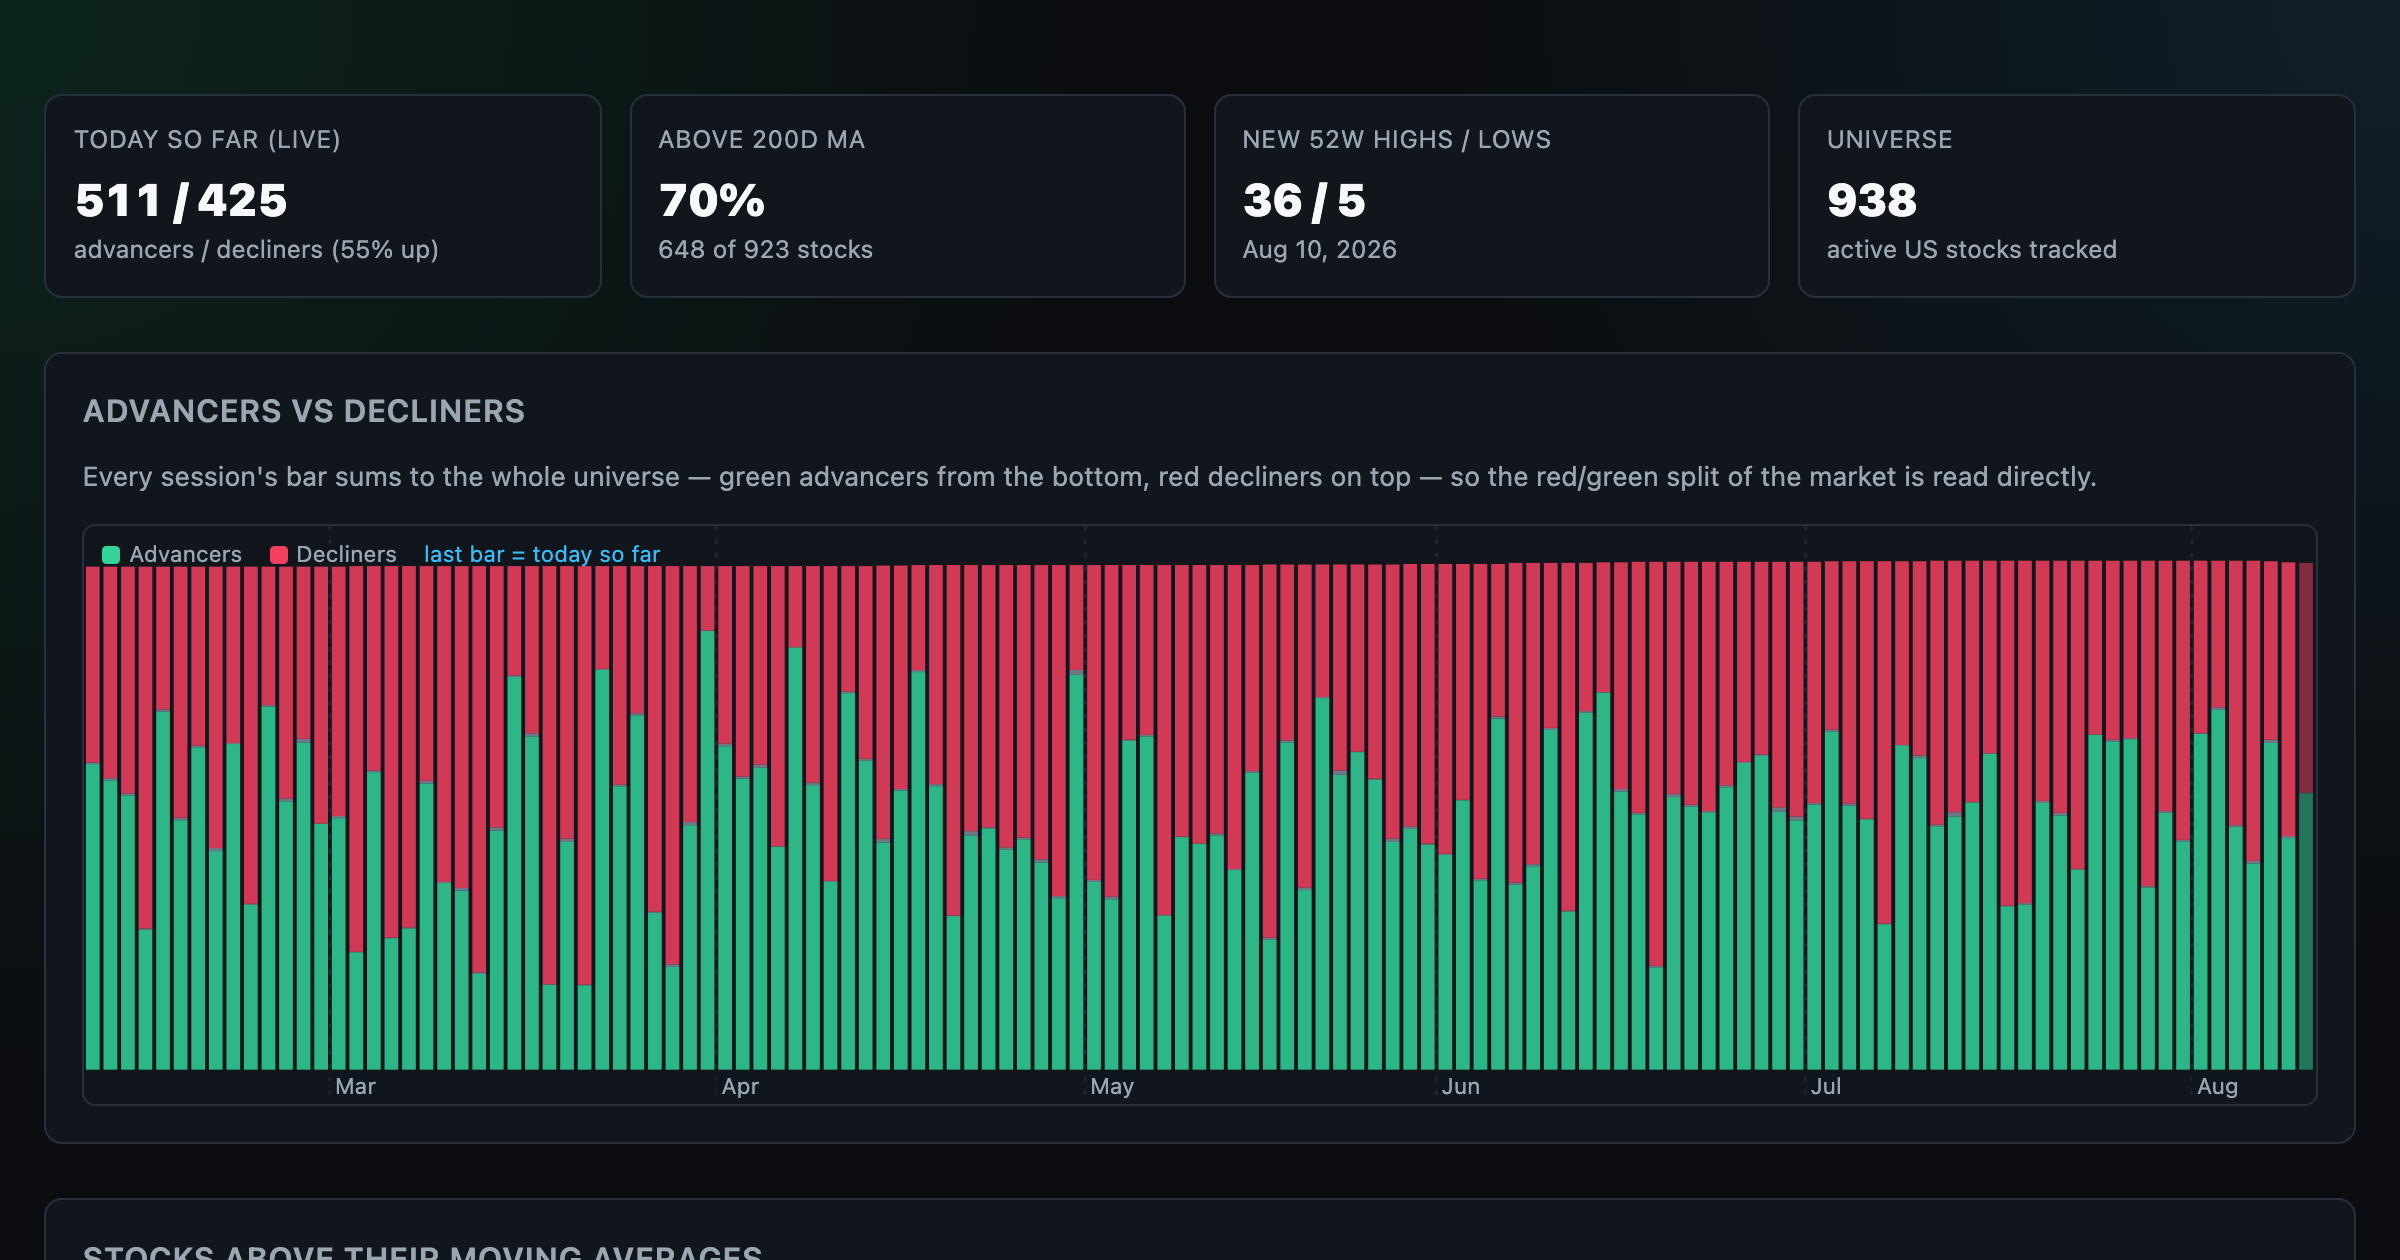
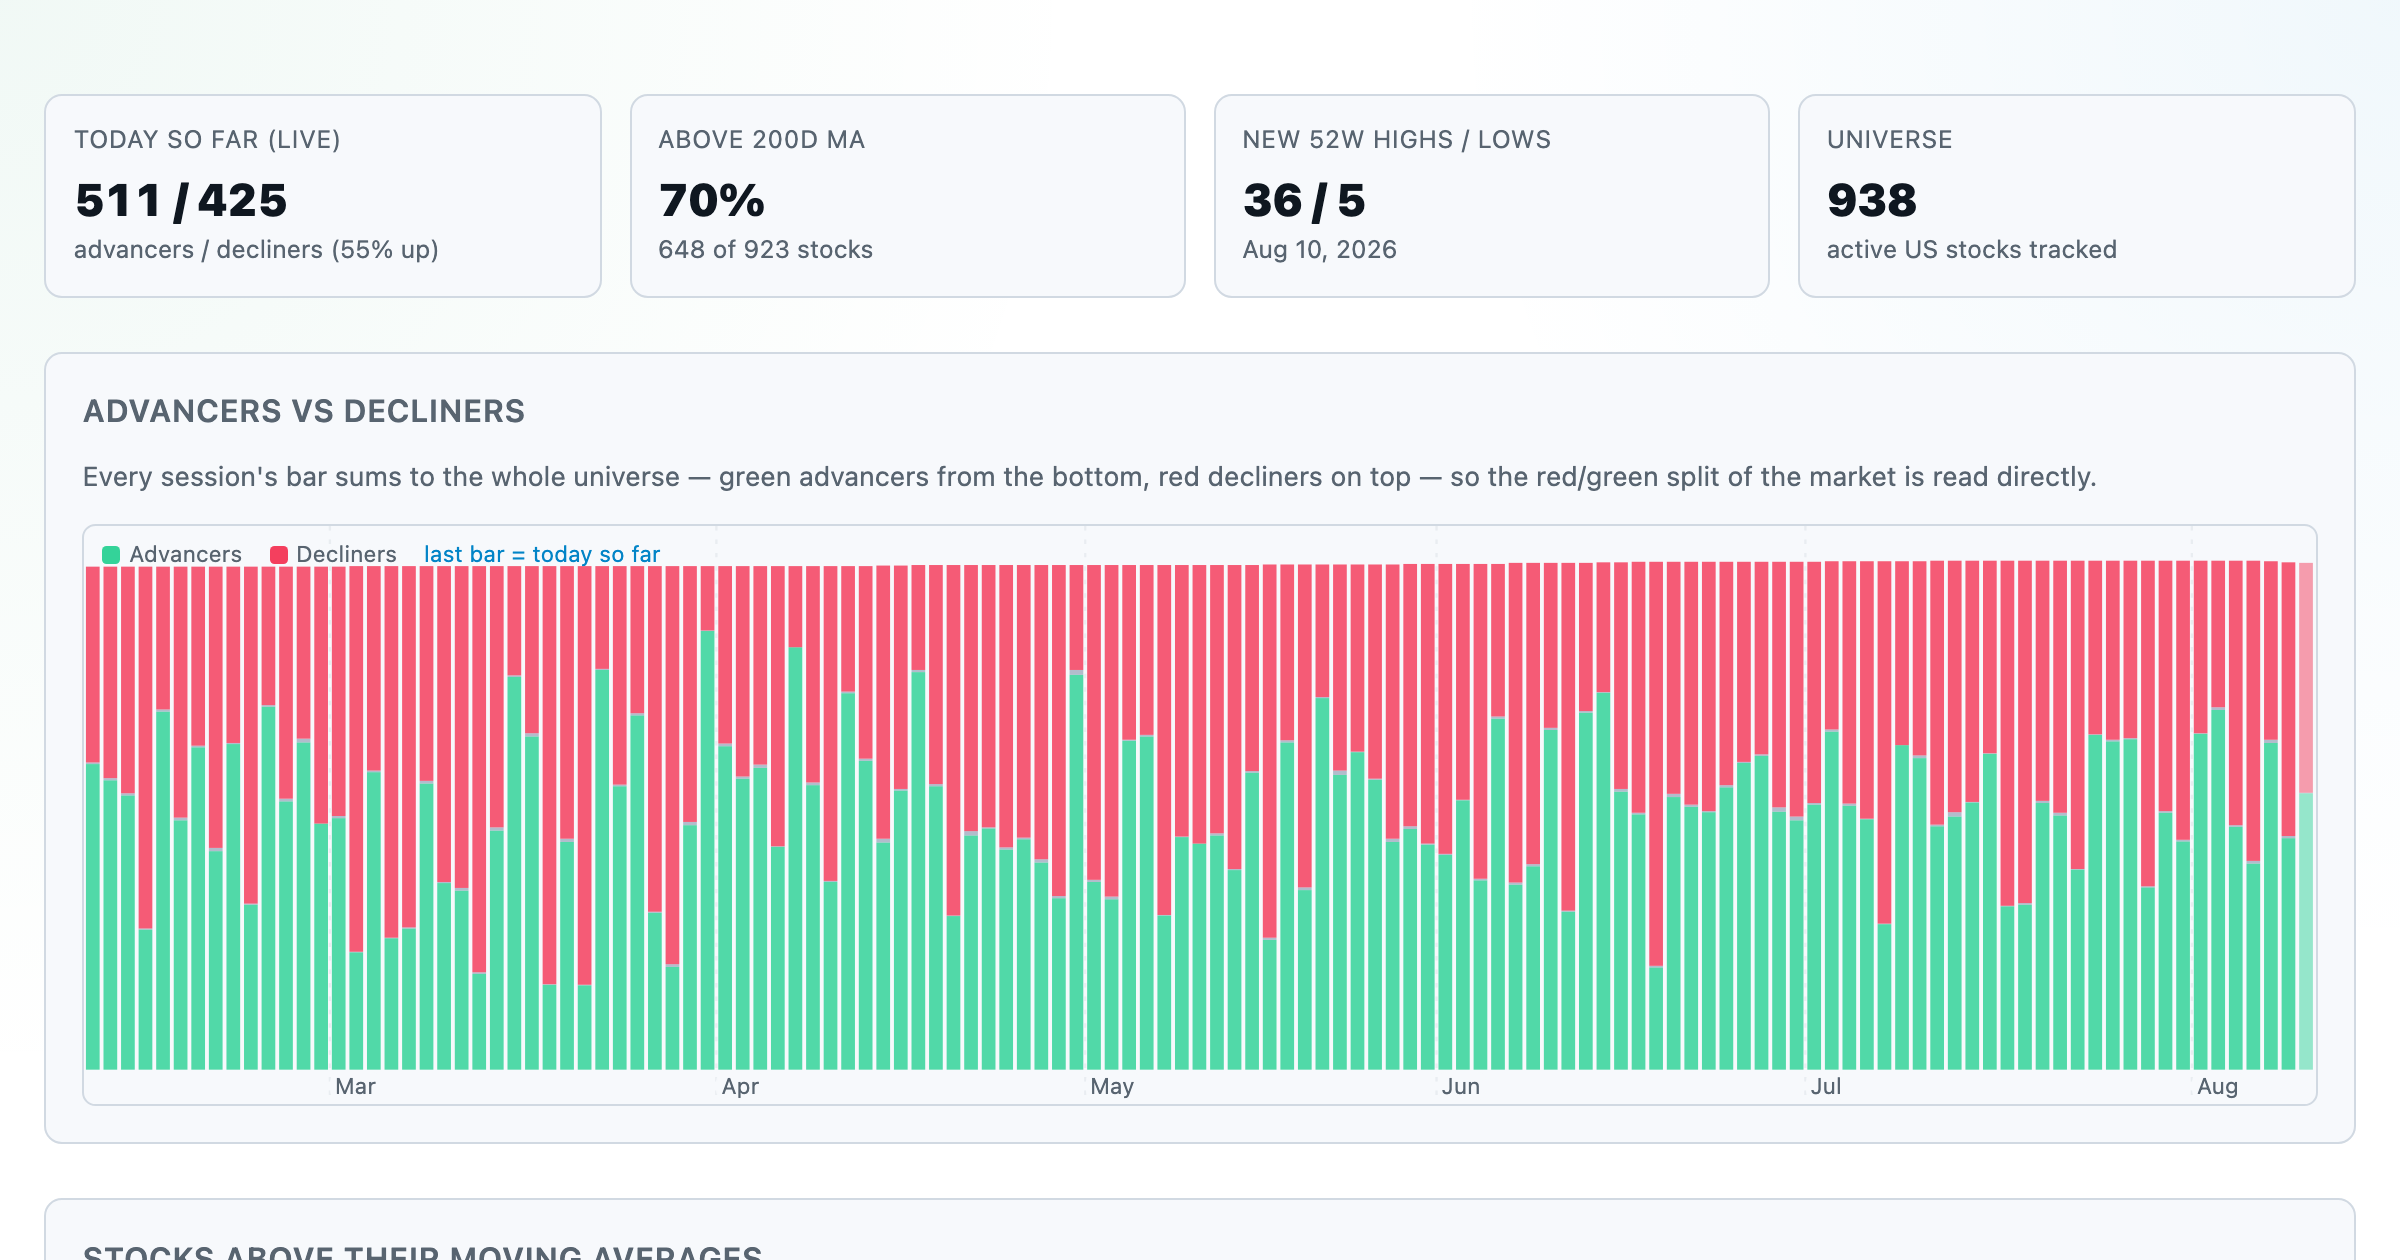
Advancers vs decliners over time, % of stocks above their moving averages, new highs vs lows, and breadth across every trailing window.
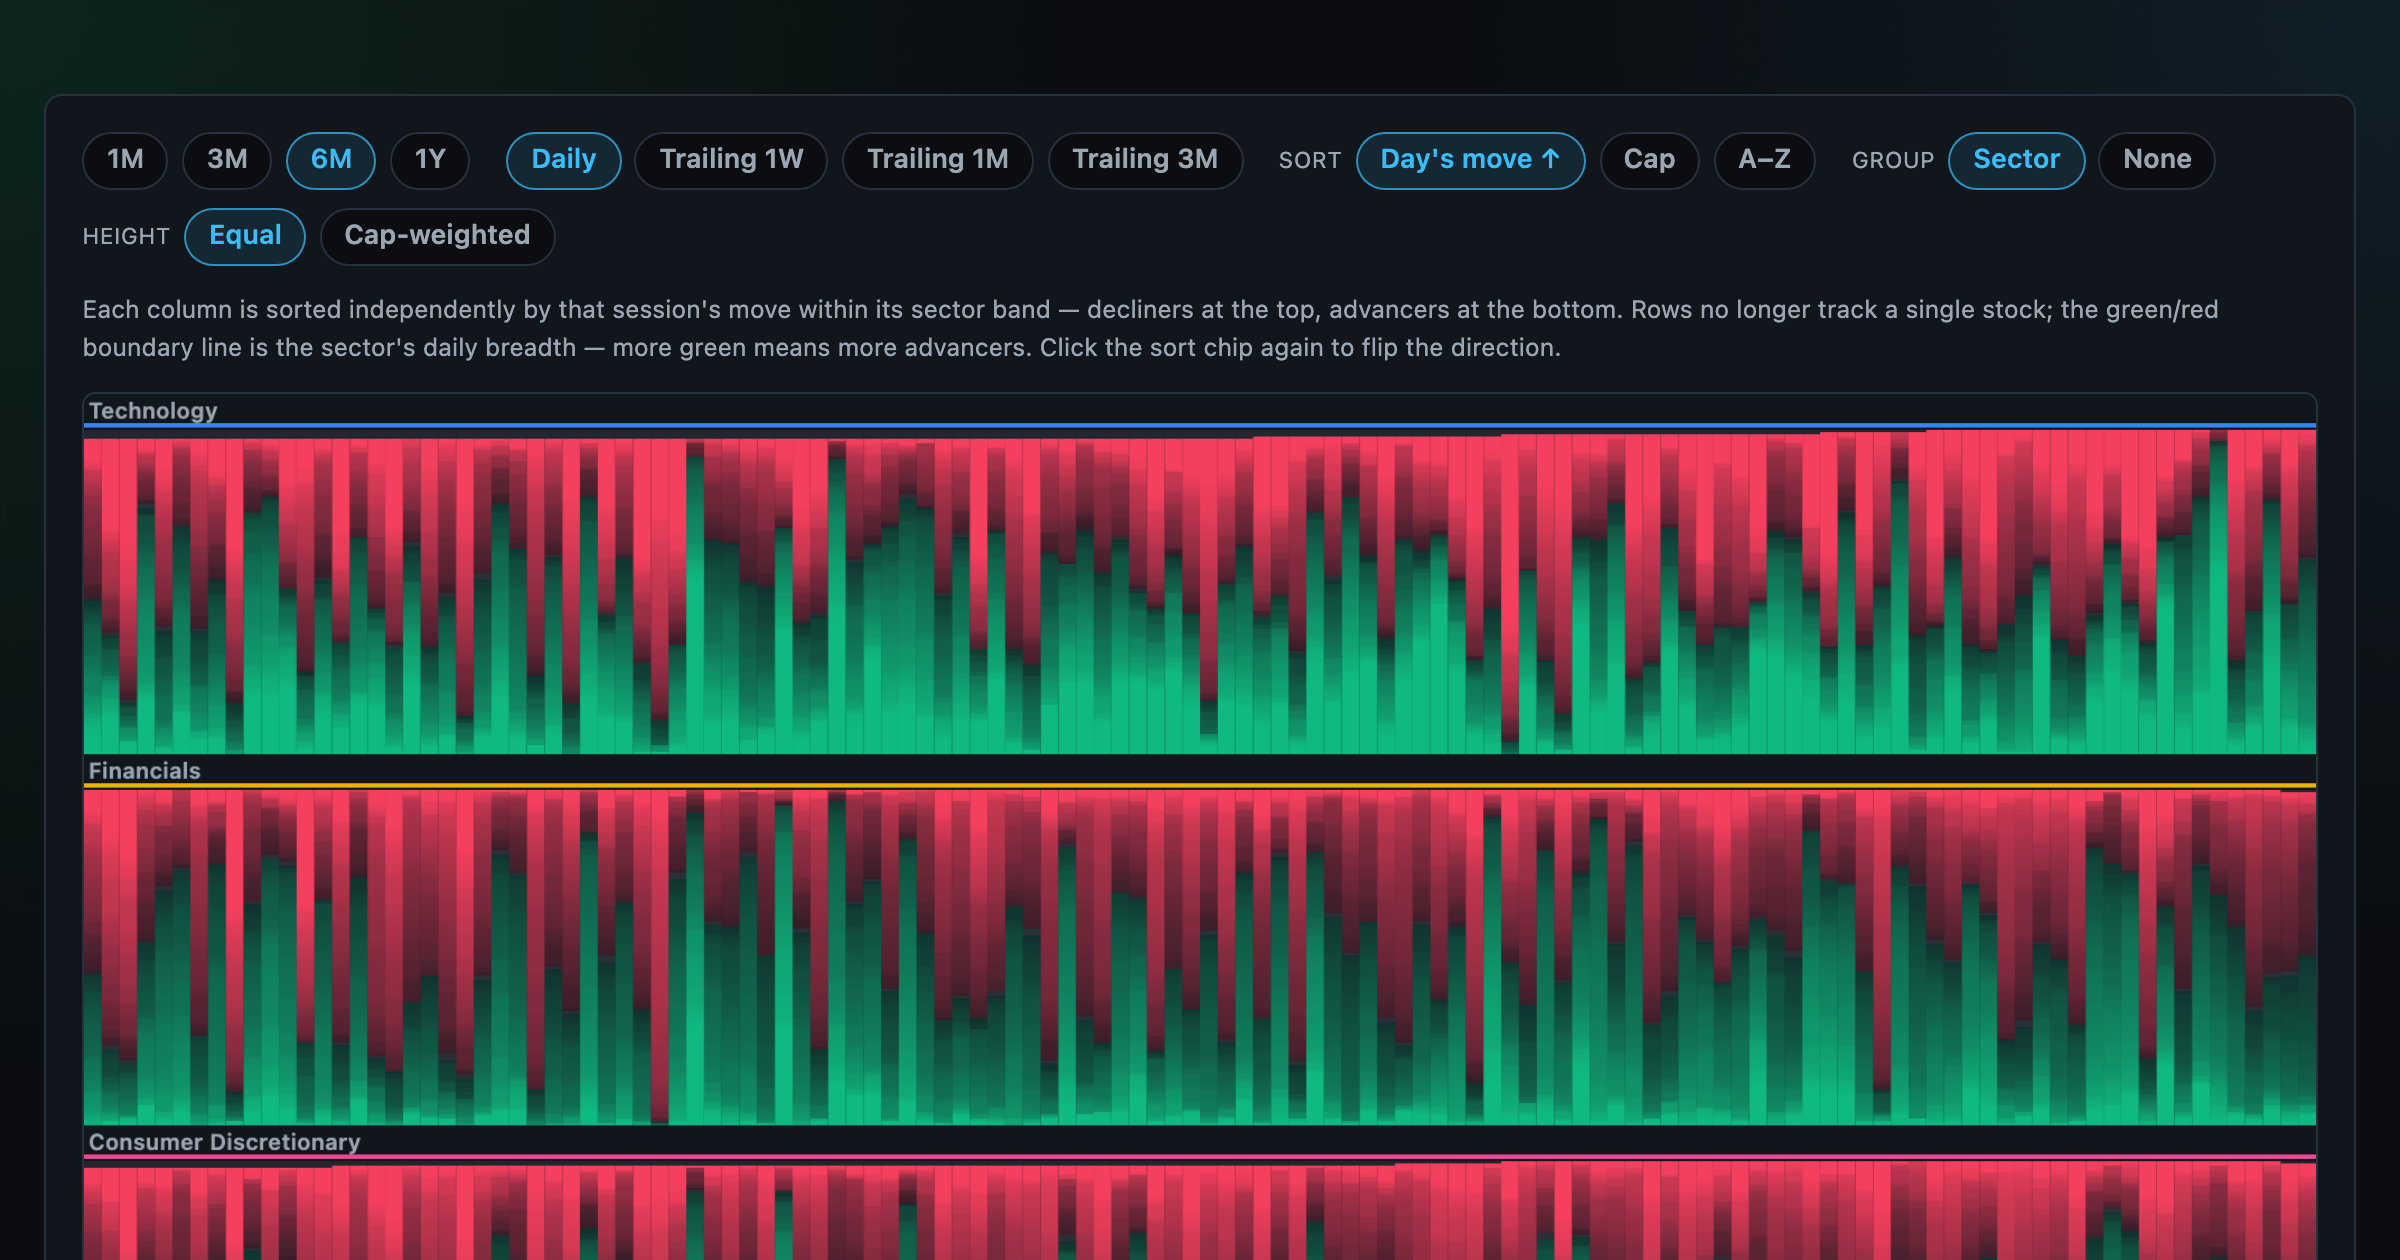
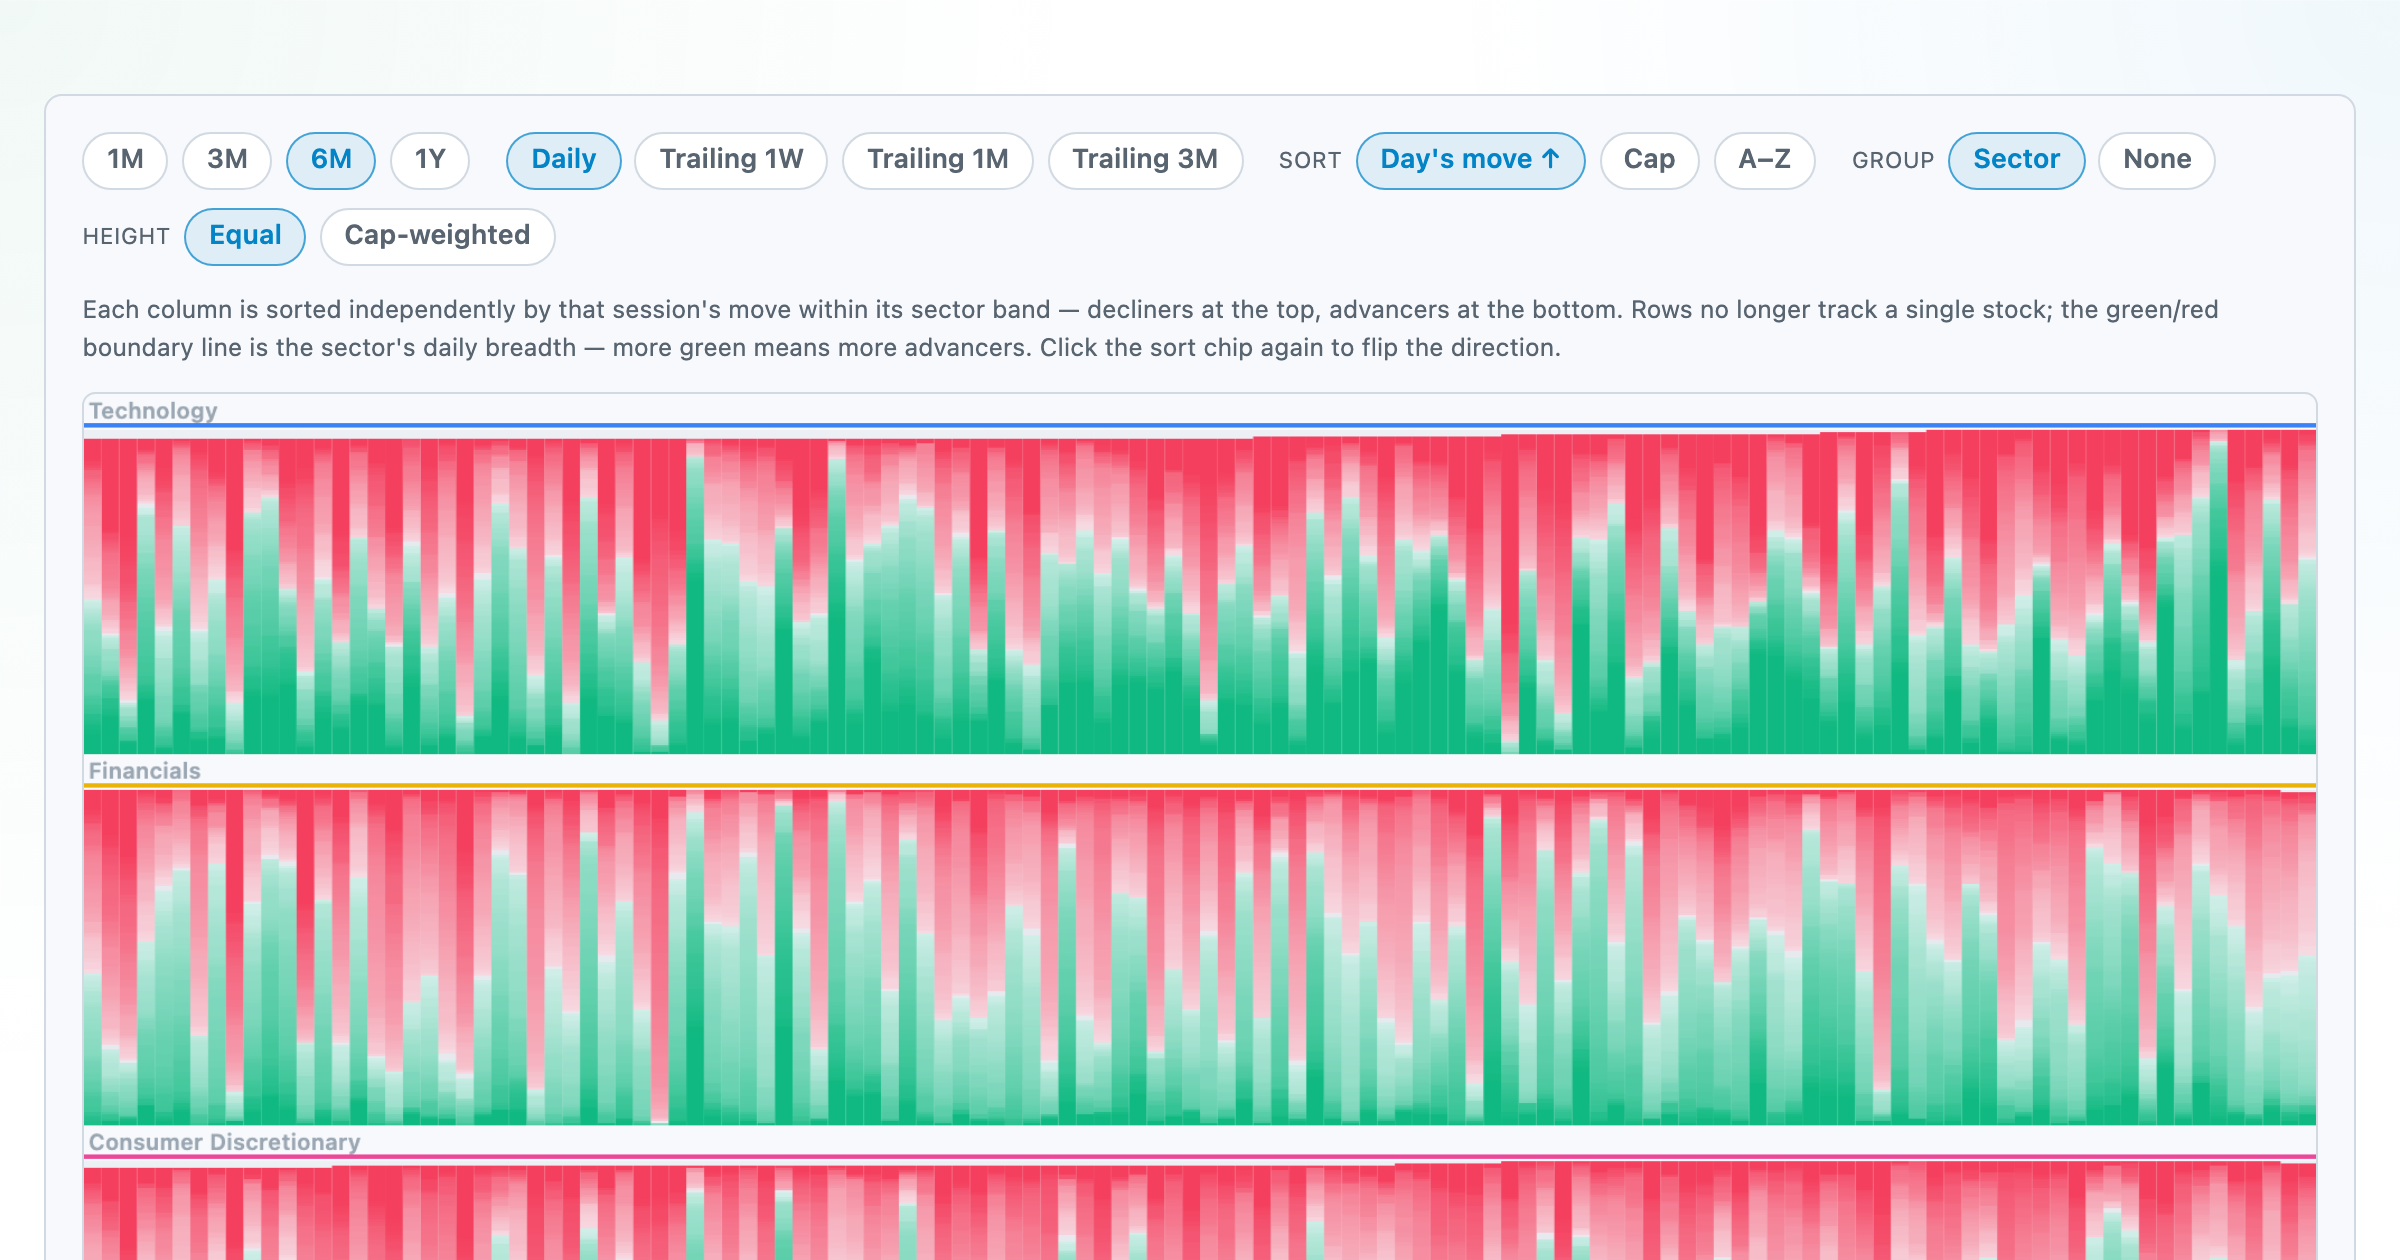
Every stock as a row, every day as a column — market selloffs are vertical stripes, sector routs are blocks.
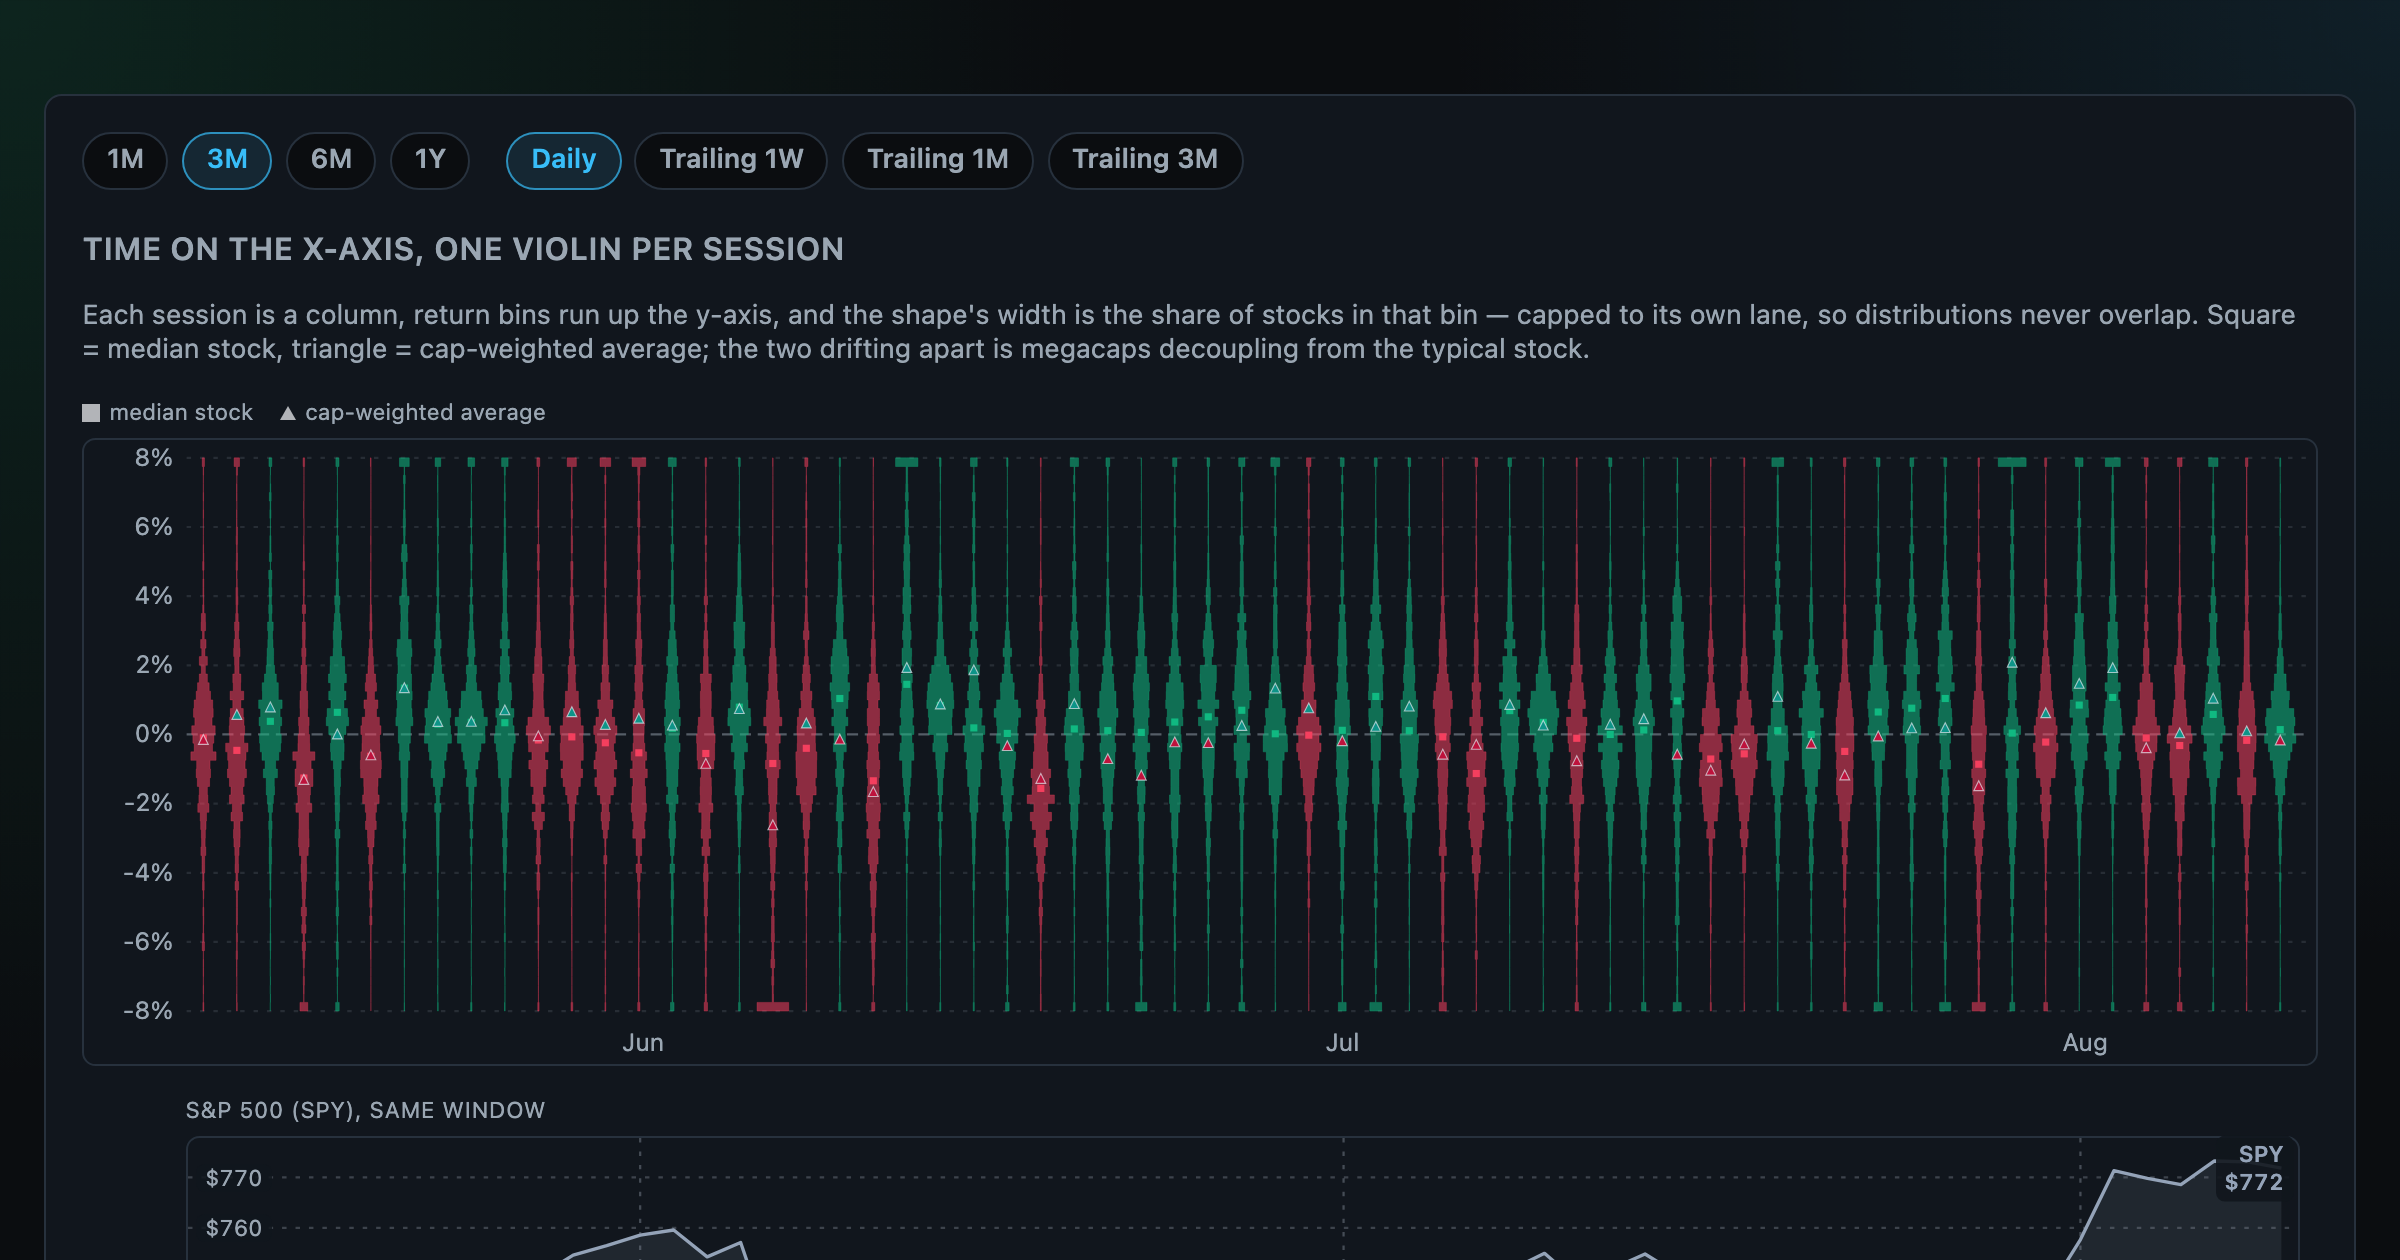
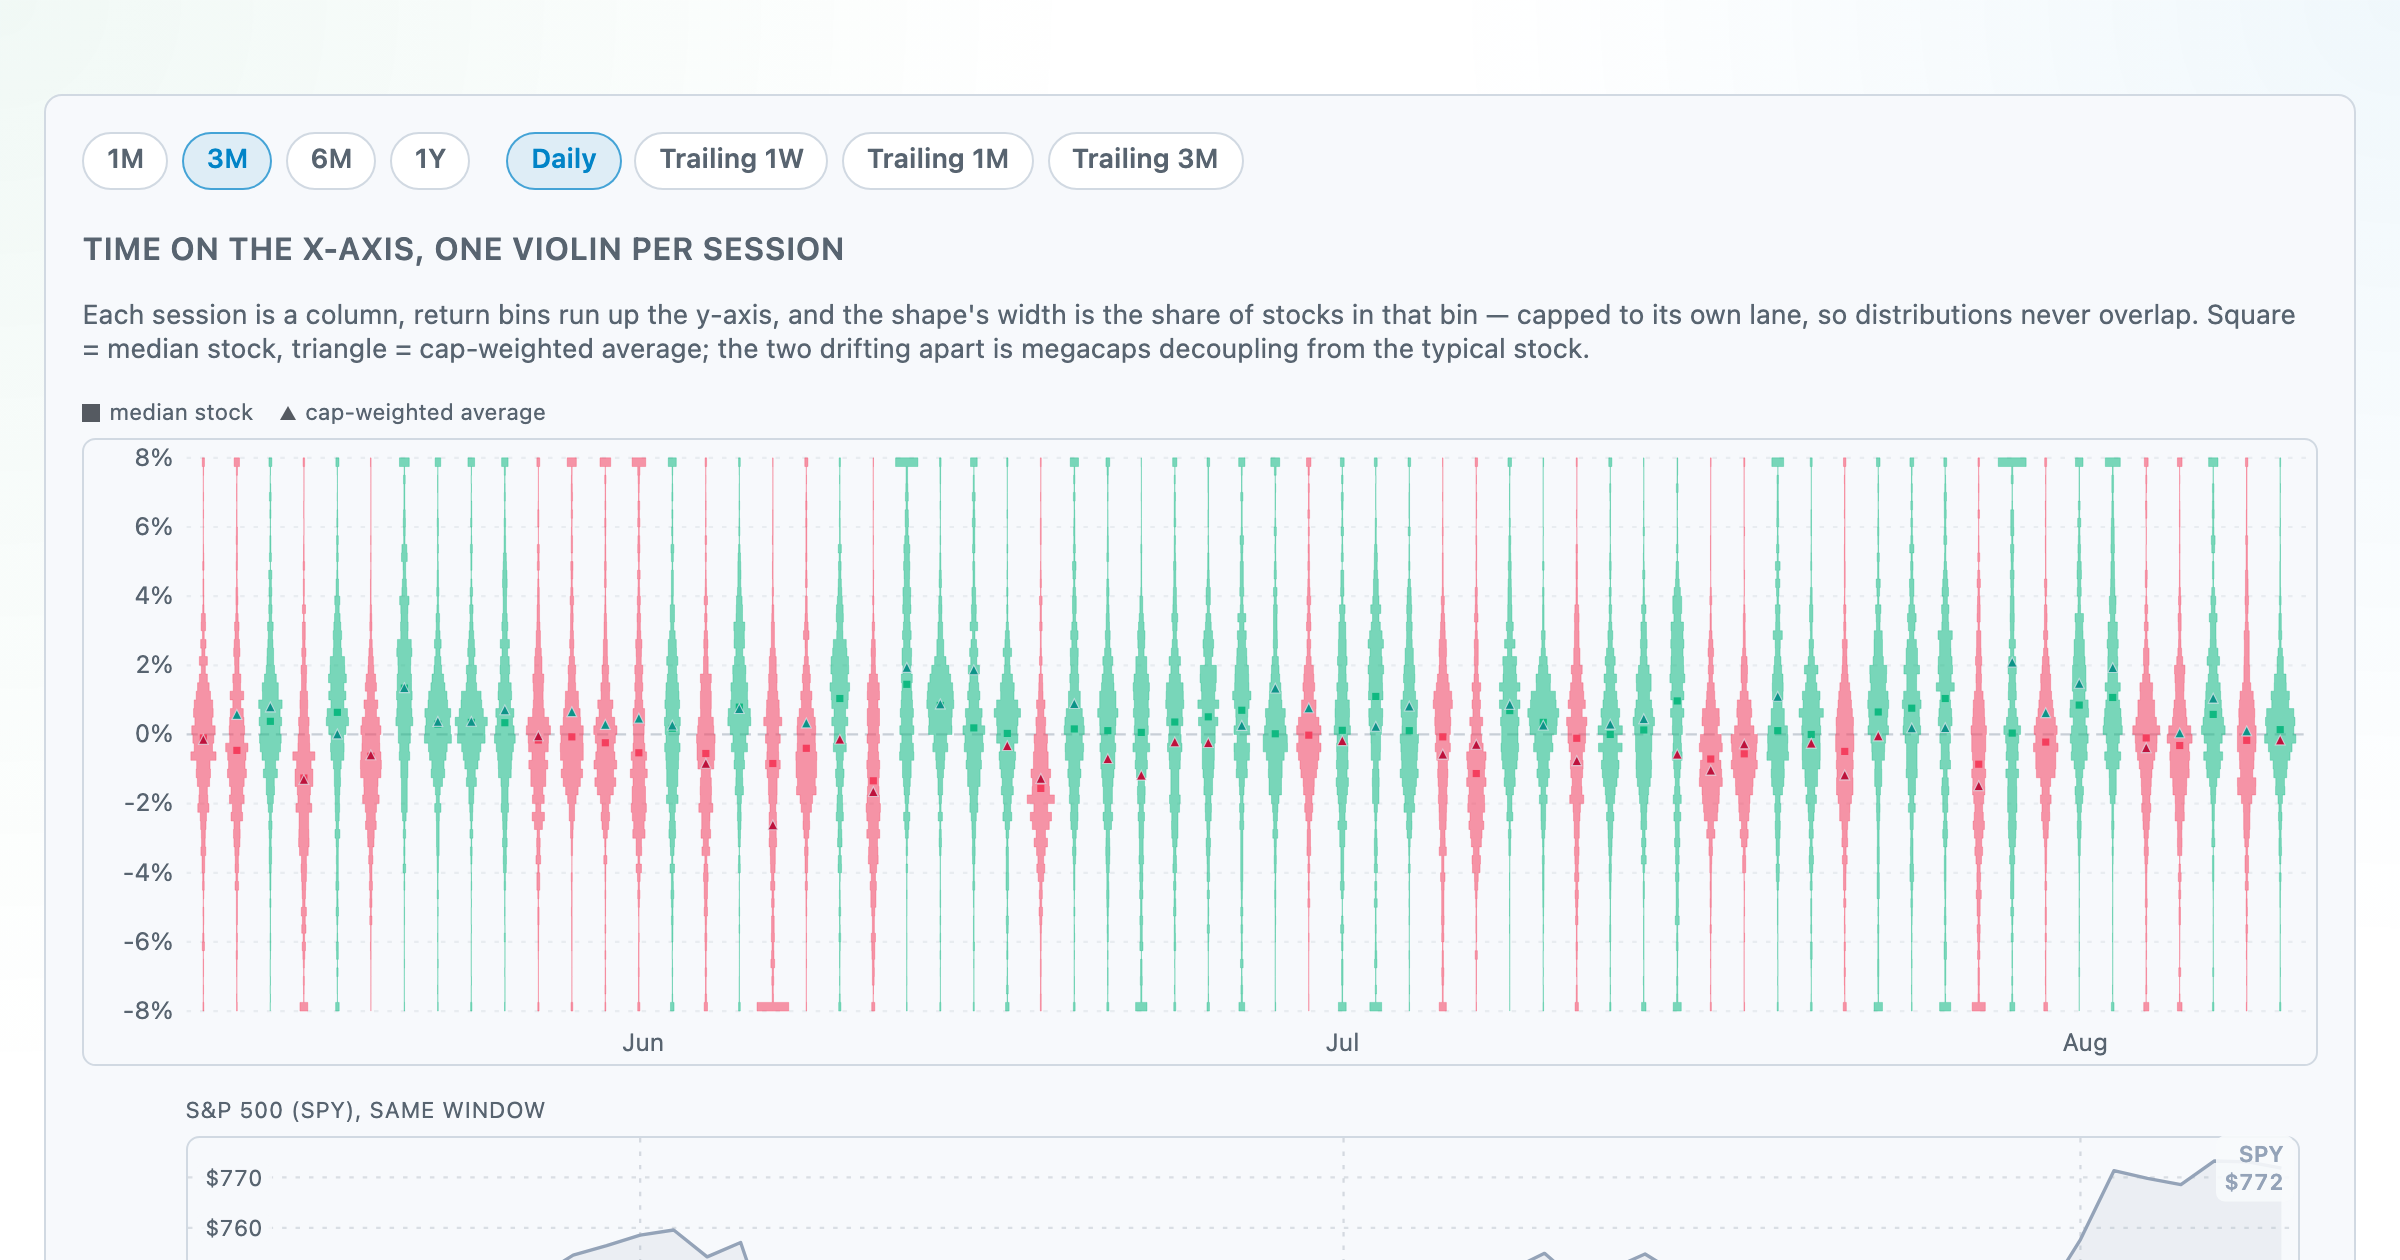
Each session's full distribution of stock returns as an upright violin, with the S&P 500 on the same axis — shifts, dispersion, and fat tails at a glance.