
Highest fundamental return (2026)
The 50 companies below have a combined market cap of $10.0T; the best performer of 2026 is MU (+207.5% YTD). Earnings growth plus cash returned — the annual return the business made, before any re-rating. Not investment advice.
End of day 2026-10-23 · 50 entries · digits update live during market hours
Top 50 by fundamental return#
Save as watchlist
Table
3M
Auto
Candles
3
8
Technical analysis0
Addendum charts0
Overlay lines0
1D %
Price returnTotal returnValuationVs own historyOtherRed/Green
Fund 5Y
Price returnTotal returnGrowth & yieldValuationVs own historyMagnitudeOtherRank, tens
1Y
Total return
Auto
SPY
Fund 5Y
Price returnTotal returnGrowth & yieldValuationVs own historyMagnitudeOtherRank, tens
1Y
Total return
Fund 5Y
Price returnTotal returnGrowth & yieldValuationVs own historyMagnitudeOtherRank, tens
Years
Total return
SPY
Sector
P/E
Price returnTotal returnGrowth & yieldValuationVs own historyMagnitudeFund 5Y
Price returnTotal returnGrowth & yieldValuationVs own historyMagnitudeCap
Fund 5Y
Price returnTotal returnGrowth & yieldValuationVs own historyMagnitudeOtherRank, tens
Sign
SPY
Fund 5Y
Price returnTotal returnGrowth & yieldValuationVs own historyMagnitudeOtherRank, tens
1Y
Total return
SPY
Columns (13 shown)
| # Company | CategoryCategory | 1Y1Y chart | |||||||||||
|---|---|---|---|---|---|---|---|---|---|---|---|---|---|
| FISFidelity National Information Services | Technology | $37.53 | -1.98% | +8.2% | -5.2% | -41.7% | -42.3% | -65.7% | +117.60% | +2961.34% | +2917.7% | $19B | |
| UDRUDR | Real Estate | $35.84 | -0.94% | +6.5% | -8.1% | +1.7% | +2.7% | -20.5% | +102.02% | +313.17% | +296.1% | $12B | |
| NVDANVIDIA | Technology | $210.96 | -0.59% | -6.5% | +1.2% | +13.4% | +16.1% | +832.4% | +95.68% | +125.34% | +123.3% | $5.08T | |
| DBDeutsche Bank | Financials | $31.20 | -0.89% | -13.0% | -8.6% | -16.1% | -3.1% | +164.5% | +81.96% | +25.91% | +19.4% | $59B | |
| OROR Royalties | Materials | $32.85 | -1.44% | -8.8% | +13.3% | -6.7% | -2.0% | +178.2% | +72.92% | — | — | $6B | |
| SMCISuper Micro Computer | Technology | $32.94 | -2.31% | -20.5% | +5.6% | +12.5% | -31.3% | +833.1% | +72.69% | +92.45% | +112.8% | $22B | |
| ESEESCO Technologies | Technology | $232.10 | -0.38% | -12.8% | -29.9% | +18.9% | +6.1% | +178.0% | +70.89% | +173.59% | +174.3% | $6B | |
| MUMicron Technology | Technology | $877.55 | +2.46% | -18.1% | -11.4% | +207.7% | +325.0% | 13.3x | +70.35% | +852.84% | +860.3% | $993B | |
| APGAPi Group | Industrials | $39.45 | +1.68% | +4.3% | -0.3% | +3.1% | +14.3% | +174.2% | +68.20% | +34.29% | +39.5% | $17B | |
| IDCCInterDigital | Technology | $327.28 | -1.44% | +0.4% | +28.1% | +3.8% | -11.7% | +419.0% | +65.59% | -34.01% | -34.8% | $8B | |
| EXELExelixis | Healthcare | $64.53 | -1.19% | +13.7% | +16.0% | +47.2% | +69.6% | +201.5% | +63.33% | +55.48% | +43.1% | $16B | |
| FIXComfort Systems USA | Industrials | $1,160.86 | -9.26% | -28.6% | -36.6% | +24.6% | +41.0% | 14.1x | +62.72% | +96.76% | +94.9% | $41B | |
| TTMITTM Technologies | Technology | $80.11 | +8.42% | -36.3% | -44.7% | +16.1% | +37.2% | +496.1% | +60.71% | +149.95% | +154.9% | $8B | |
| MARMarriott International | Consumer Discretionary | $390.71 | -1.53% | +11.1% | +7.4% | +26.7% | +46.1% | +163.4% | +56.97% | +9.89% | +4.9% | $102B | |
| DINOHF Sinclair | Energy | $121.66 | -0.54% | +14.6% | +37.4% | +170.2% | +129.0% | +295.2% | +56.50% | — | — | $22B | |
| PENPenumbra | Healthcare | $324.39 | -0.18% | +1.5% | +2.0% | +4.3% | +28.0% | +16.3% | +56.48% | +7.65% | +8.7% | $13B | |
| NOWServiceNow | Technology | $158.96 | +1.25% | +12.9% | +72.9% | +3.8% | -15.4% | +15.8% | +56.32% | +1.13% | +0.5% | $164B | |
| PAAPlains All American Pipeline | Energy | $26.63 | +2.82% | +9.0% | +9.7% | +56.9% | +71.4% | +257.4% | +54.74% | +203.44% | +204.4% | $19B | |
| FUTUFutu Holdings ADR | Financials | $99.19 | +0.27% | -9.8% | +0.2% | -38.6% | -41.0% | +43.7% | +54.43% | +109.03% | +108.6% | $14B | |
| FTITechnipFMC | Energy | $69.89 | +4.59% | -1.9% | -8.0% | +57.2% | +71.4% | +825.5% | +53.91% | +35.60% | +29.1% | $27B | |
| DISWalt Disney | Communication Services | $112.52 | -0.54% | +8.8% | +21.2% | -0.3% | +1.0% | -31.5% | +53.08% | -21.39% | -25.6% | $194B | |
| TRGPTarga Resources | Energy | $302.37 | +4.43% | +6.8% | +6.4% | +66.3% | +97.0% | +497.8% | +52.91% | +40.61% | +38.5% | $65B | |
| STRLSterling Infrastructure | Industrials | $355.30 | -4.70% | -30.6% | -50.5% | +16.0% | +0.4% | 15.6x | +50.36% | +50.60% | +51.4% | $11B | |
| CNMCore & Main | Industrials | $41.97 | -0.85% | -1.8% | -2.7% | -19.2% | -22.9% | +71.0% | +50.04% | +10.26% | +6.5% | $8B | |
| PFGCPerformance Food Group | Consumer Staples | $94.71 | -3.25% | +4.3% | -14.1% | +5.3% | -6.9% | +107.6% | +49.88% | +4.95% | +5.6% | $15B | |
| RLRalph Lauren | Consumer Discretionary | $377.40 | -1.19% | +12.2% | +1.8% | +7.6% | +13.4% | +237.9% | +48.87% | +26.82% | +23.8% | $22B | |
| KEXKirby | Industrials | $133.15 | +1.25% | +2.4% | -10.7% | +20.8% | +55.1% | +134.3% | +48.24% | +23.90% | +17.2% | $7B | |
| BBVABanco Bilbao Vizcaya Argentaria | Financials | $24.88 | -0.60% | -10.0% | -0.1% | +11.8% | +35.0% | +413.6% | +47.87% | +14.66% | +10.1% | $142B | |
| RNRRenaissanceRe Holdings | Financials | $352.60 | -2.76% | +7.2% | +11.2% | +25.9% | +45.5% | +147.4% | +47.64% | +49.81% | +31.8% | $15B | |
| CFCF Industries Holdings | Materials | $120.68 | +1.79% | +0.0% | -4.3% | +58.3% | +41.7% | +124.6% | +47.32% | +74.33% | +61.3% | $18B | |
| HWMHowmet Aerospace | Industrials | $185.91 | -3.82% | -18.7% | -35.2% | -9.2% | -6.9% | +519.2% | +46.99% | +35.67% | +34.0% | $74B | |
| DYDycom Industries | Industrials | $224.56 | -0.27% | -20.1% | -49.0% | -33.5% | -21.6% | +181.1% | +46.51% | — | — | $7B | |
| NTRNutrien | Materials | $69.74 | +0.94% | -6.5% | +2.5% | +15.7% | +24.6% | +17.9% | +45.53% | +234.58% | +228.4% | $34B | |
| ITTITT | Industrials | $190.10 | +0.98% | -10.3% | -2.4% | +10.2% | +9.2% | +112.5% | +45.00% | -27.90% | -18.4% | $17B | |
| HLHecla Mining | Materials | $13.85 | -1.84% | -24.2% | -9.6% | -27.8% | +7.2% | +142.4% | +44.48% | +217.59% | +233.4% | $9B | |
| CVXChevron | Energy | $233.21 | +2.88% | +13.5% | +21.0% | +57.3% | +54.8% | +152.6% | +44.25% | +34.33% | +50.2% | $461B | |
| ACAArcosa | Industrials | $149.15 | +0.08% | +1.8% | +2.8% | +40.5% | +61.8% | +185.6% | +44.08% | +433.05% | +433.6% | $7B | |
| BSXBoston Scientific | Healthcare | $45.69 | -0.70% | +2.4% | +4.8% | -52.1% | -55.4% | +1.9% | +44.02% | +50.28% | +47.0% | $66B | |
| COPConocoPhillips | Energy | $150.80 | +3.55% | +17.7% | +26.3% | +64.6% | +72.7% | +134.2% | +43.34% | +7.31% | +1.1% | $181B | |
| AGIAlamos Gold | Materials | $29.94 | -1.19% | -13.2% | +2.0% | -22.2% | -5.7% | +287.9% | +42.34% | +212.50% | +211.8% | $13B | |
| HALHalliburton | Energy | $34.92 | +5.21% | +5.8% | +7.3% | +25.3% | +30.9% | +48.7% | +42.30% | +57.56% | +52.9% | $29B | |
| MTSIMACOM Technology Solutions Holdings | Technology | $236.24 | +2.83% | -14.4% | -16.5% | +37.9% | +69.6% | +255.3% | +41.42% | — | — | $18B | |
| WDCWestern Digital | Technology | $343.67 | -2.97% | -27.4% | -38.4% | +99.7% | +173.9% | +700.9% | +41.24% | +256.74% | +290.5% | $129B | |
| AVGOBroadcom | Technology | $321.68 | -0.48% | -9.4% | -17.9% | -6.5% | -5.9% | +581.8% | +41.06% | +101.21% | +102.6% | $1.54T | |
| PTCPTC | Technology | $193.80 | -0.10% | +38.0% | +71.4% | +11.2% | -5.3% | +51.3% | +41.03% | +163.69% | +138.8% | $21B | |
| IFSIntercorp Financial Services | Financials | $51.82 | +0.35% | -6.3% | -12.4% | +27.3% | +30.3% | +137.9% | +40.88% | +60.77% | +55.6% | $6B | |
| EMEEMCOR Group | Industrials | $647.66 | -1.93% | -13.8% | -15.7% | +6.1% | -6.8% | +443.0% | +40.47% | +32.37% | +30.2% | $29B | |
| NFGNational Fuel Gas | Energy | $80.53 | -0.49% | +3.2% | -1.2% | +2.6% | +0.7% | +61.5% | +40.24% | +166.38% | +177.5% | $8B | |
| ANETArista Networks | Technology | $172.37 | +0.76% | -15.3% | -2.4% | +31.6% | +12.8% | +606.2% | +40.13% | +23.98% | +24.4% | $217B | |
| EIXEdison International | Utilities | $57.35 | -0.95% | +8.9% | -26.8% | +0.9% | +5.8% | +20.7% | +39.95% | +48.11% | +42.2% | $22B |
Methodology#
Fundamental return is realized shareholder yield plus earnings growth: roughly the annual return the business itself produced, before the market re-rated it up or down. It is what you would have earned if the multiple never moved. The 5Y column uses CAGRs on both legs so the two terms are the same kind of rate.
Performance columns from 5 days to 5 years are total returns, dividends reinvested, through the latest print during the session; in session they count a dividend going ex that day once it is on record, and the nightly update corrects anything missed. The 1D column is the price move, the way quote screens report it. Fundamentals come from company filings via our EDGAR pipeline. Past performance does not predict future returns; this is not investment advice.
FAQ#
- What is fundamental return?
- Fundamental return is the annual return a business generated on its own, before any change in how the market values it. It adds two things a company controls: the growth in its earnings, and what it returned to owners — shares retired plus dividends paid. Total shareholder return is roughly this plus (or minus) the re-rating of the valuation multiple. A stock can beat its fundamental return for years because the multiple expanded, and that part isn't repeatable; the fundamental part is the piece with a business behind it.
- Why use earnings growth instead of EPS growth?
- Because EPS growth already contains the buyback. Earnings per share is profit divided by share count, so retiring shares raises EPS on its own — adding a buyback yield on top of EPS growth would count the same retirement twice and systematically flatter the heaviest repurchasers. Pairing the yield with company-level earnings growth counts each effect once.
- Is a high fundamental return a buy signal?
- No — it is backward-looking, and it says nothing about price. It measures what the business did over the past five years, not what it will do or what you have to pay for it today. Two stocks with identical fundamental returns can trade at wildly different multiples; the P/E, P/S and P/FCF columns are on this table for exactly that reason. Fast historical compounding also tends to mean-revert as a business scales. Not investment advice.
- Which stock has the highest fundamental return?
- Fidelity National Information Services Inc. (FIS) currently leads US large caps at about 117.60% a year.
- What are the top 10 fundamental return stocks?
- The 10 highest fundamental returns right now: 1. FIS 117.60%, 2. UDR 102.02%, 3. NVDA 95.68%, 4. DB 81.96%, 5. OR 72.92%, 6. SMCI 72.69%, 7. ESE 70.89%, 8. MU 70.35%, 9. APG 68.20%, 10. IDCC 65.59%.
More lists
Highest realized shareholder yield
50 stocksShares actually retired plus dividends — the cash-over-market-cap version flatters fallen stocks.
Highest realized buyback yield
50 stocksShares actually retired over the past year — the buyback measure a collapsed stock price can't flatter.
Highest dividend stocks
50 stocksThe 50 highest dividend yields among US-listed large caps, each one checked against dividends actually paid in the past year.
Dividend growth stocks
50 stocksLarge caps that have raised the dividend every year for 10 or more years, ranked by how fast the payment has grown over five years.
25+ years of dividend increases
Every US-listed large cap that has raised its dividend for 25 or more consecutive years in our record, longest streak first.
Monthly dividend stocks & ETFs
Every stock and fund in the universe that pays twelve times a year, ranked by yield — covered-call income funds, bond funds and the monthly-paying REITs.
Explore visualizations
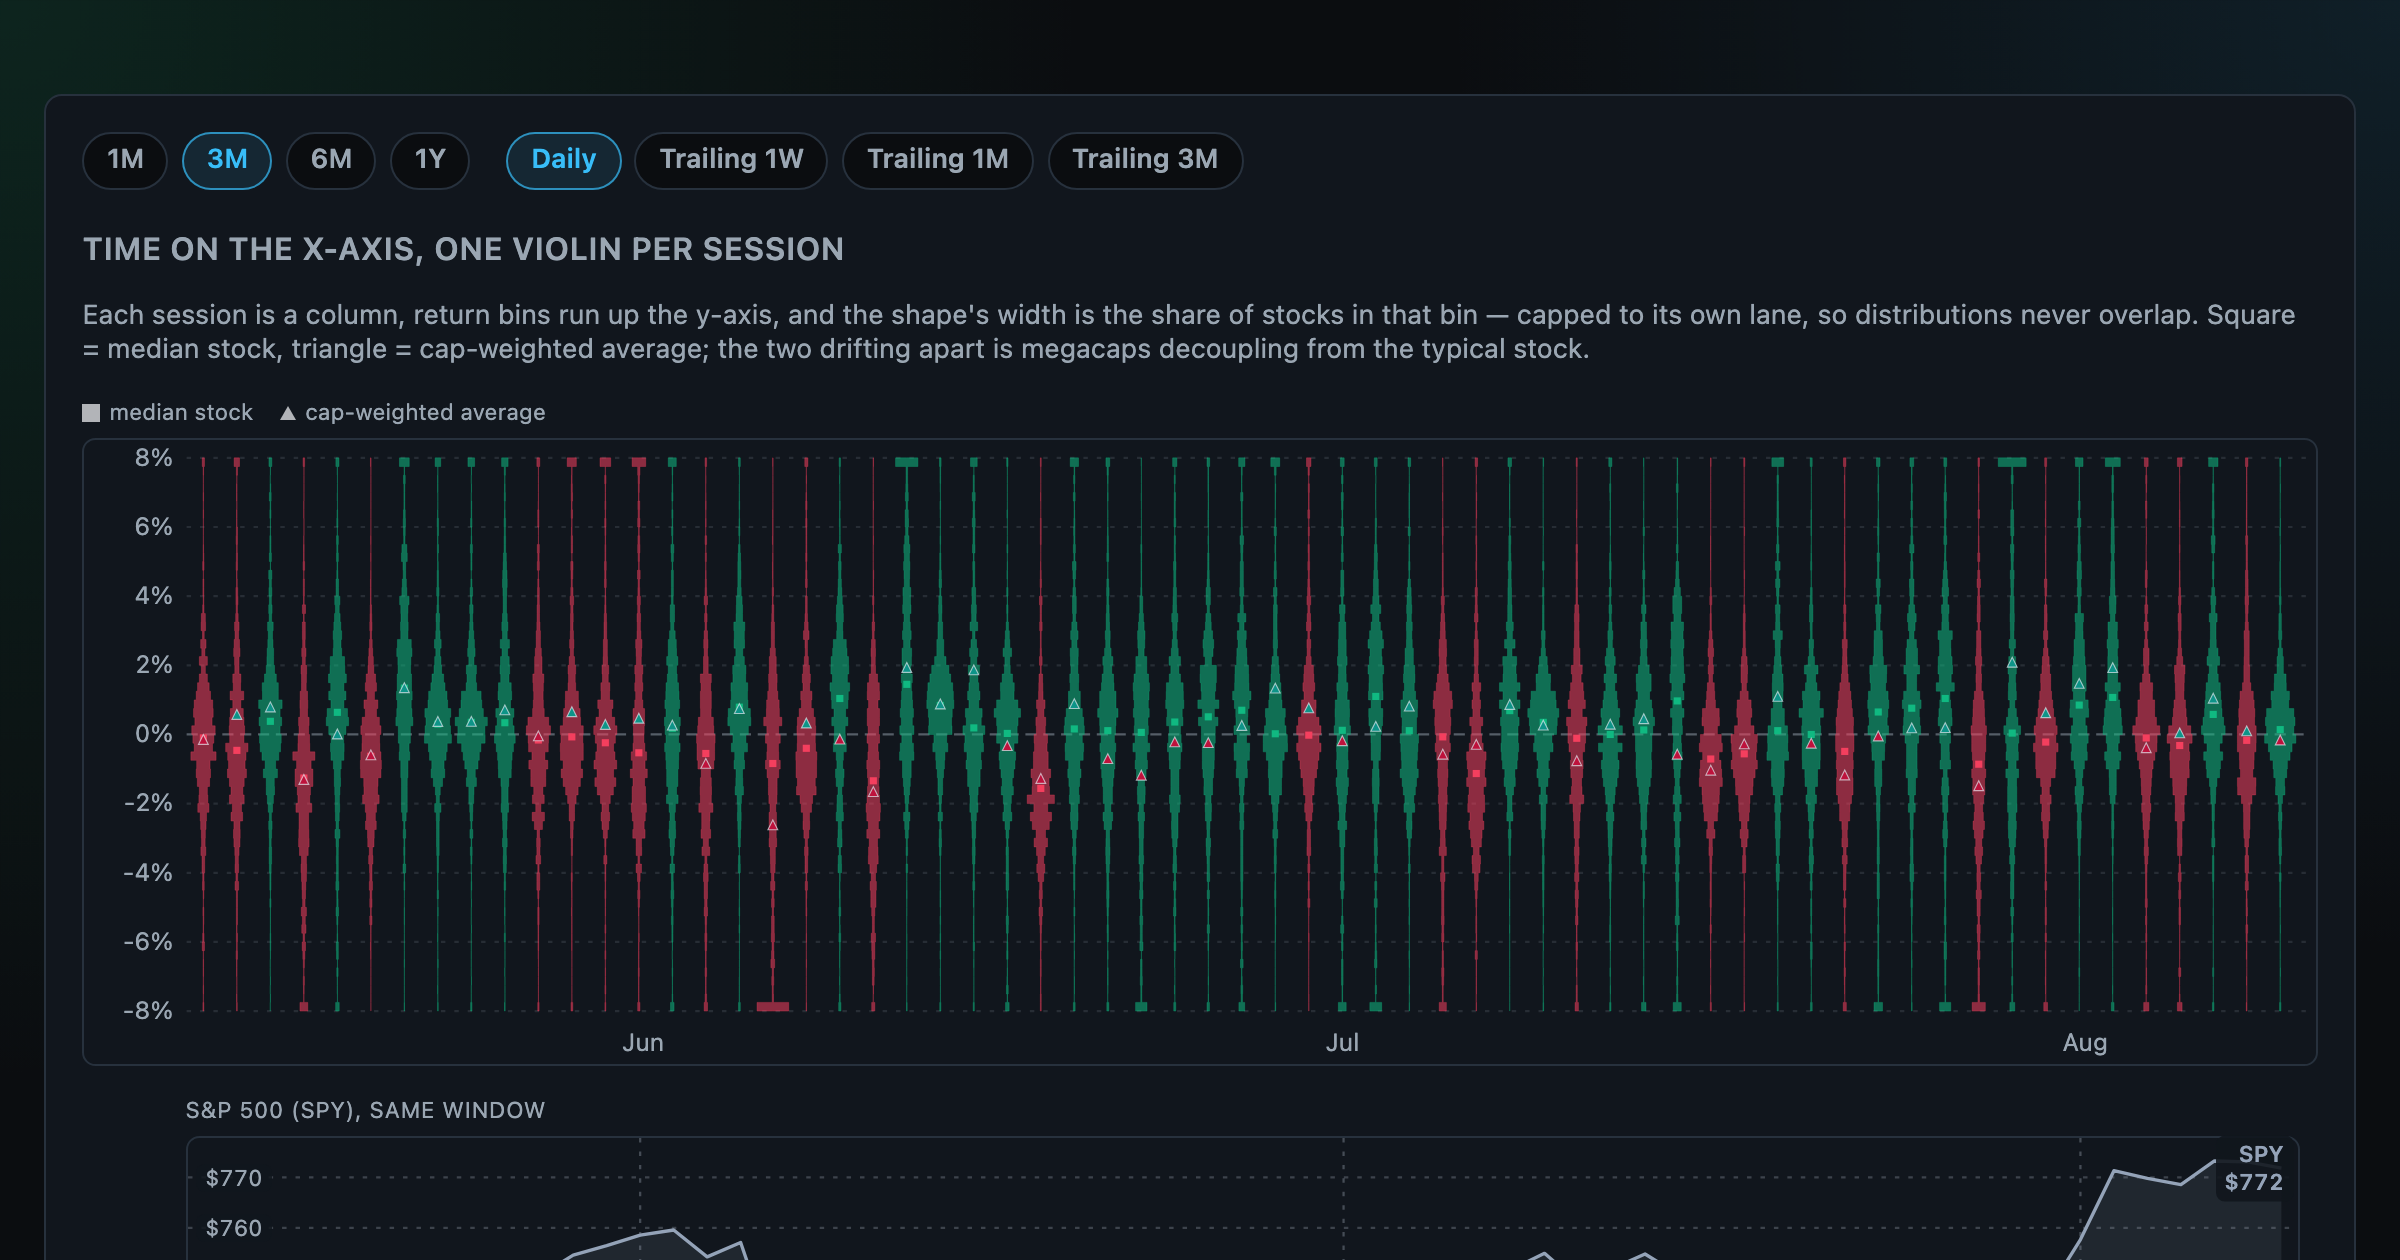
Each session's full distribution of stock returns as an upright violin, with the S&P 500 on the same axis — shifts, dispersion, and fat tails at a glance.
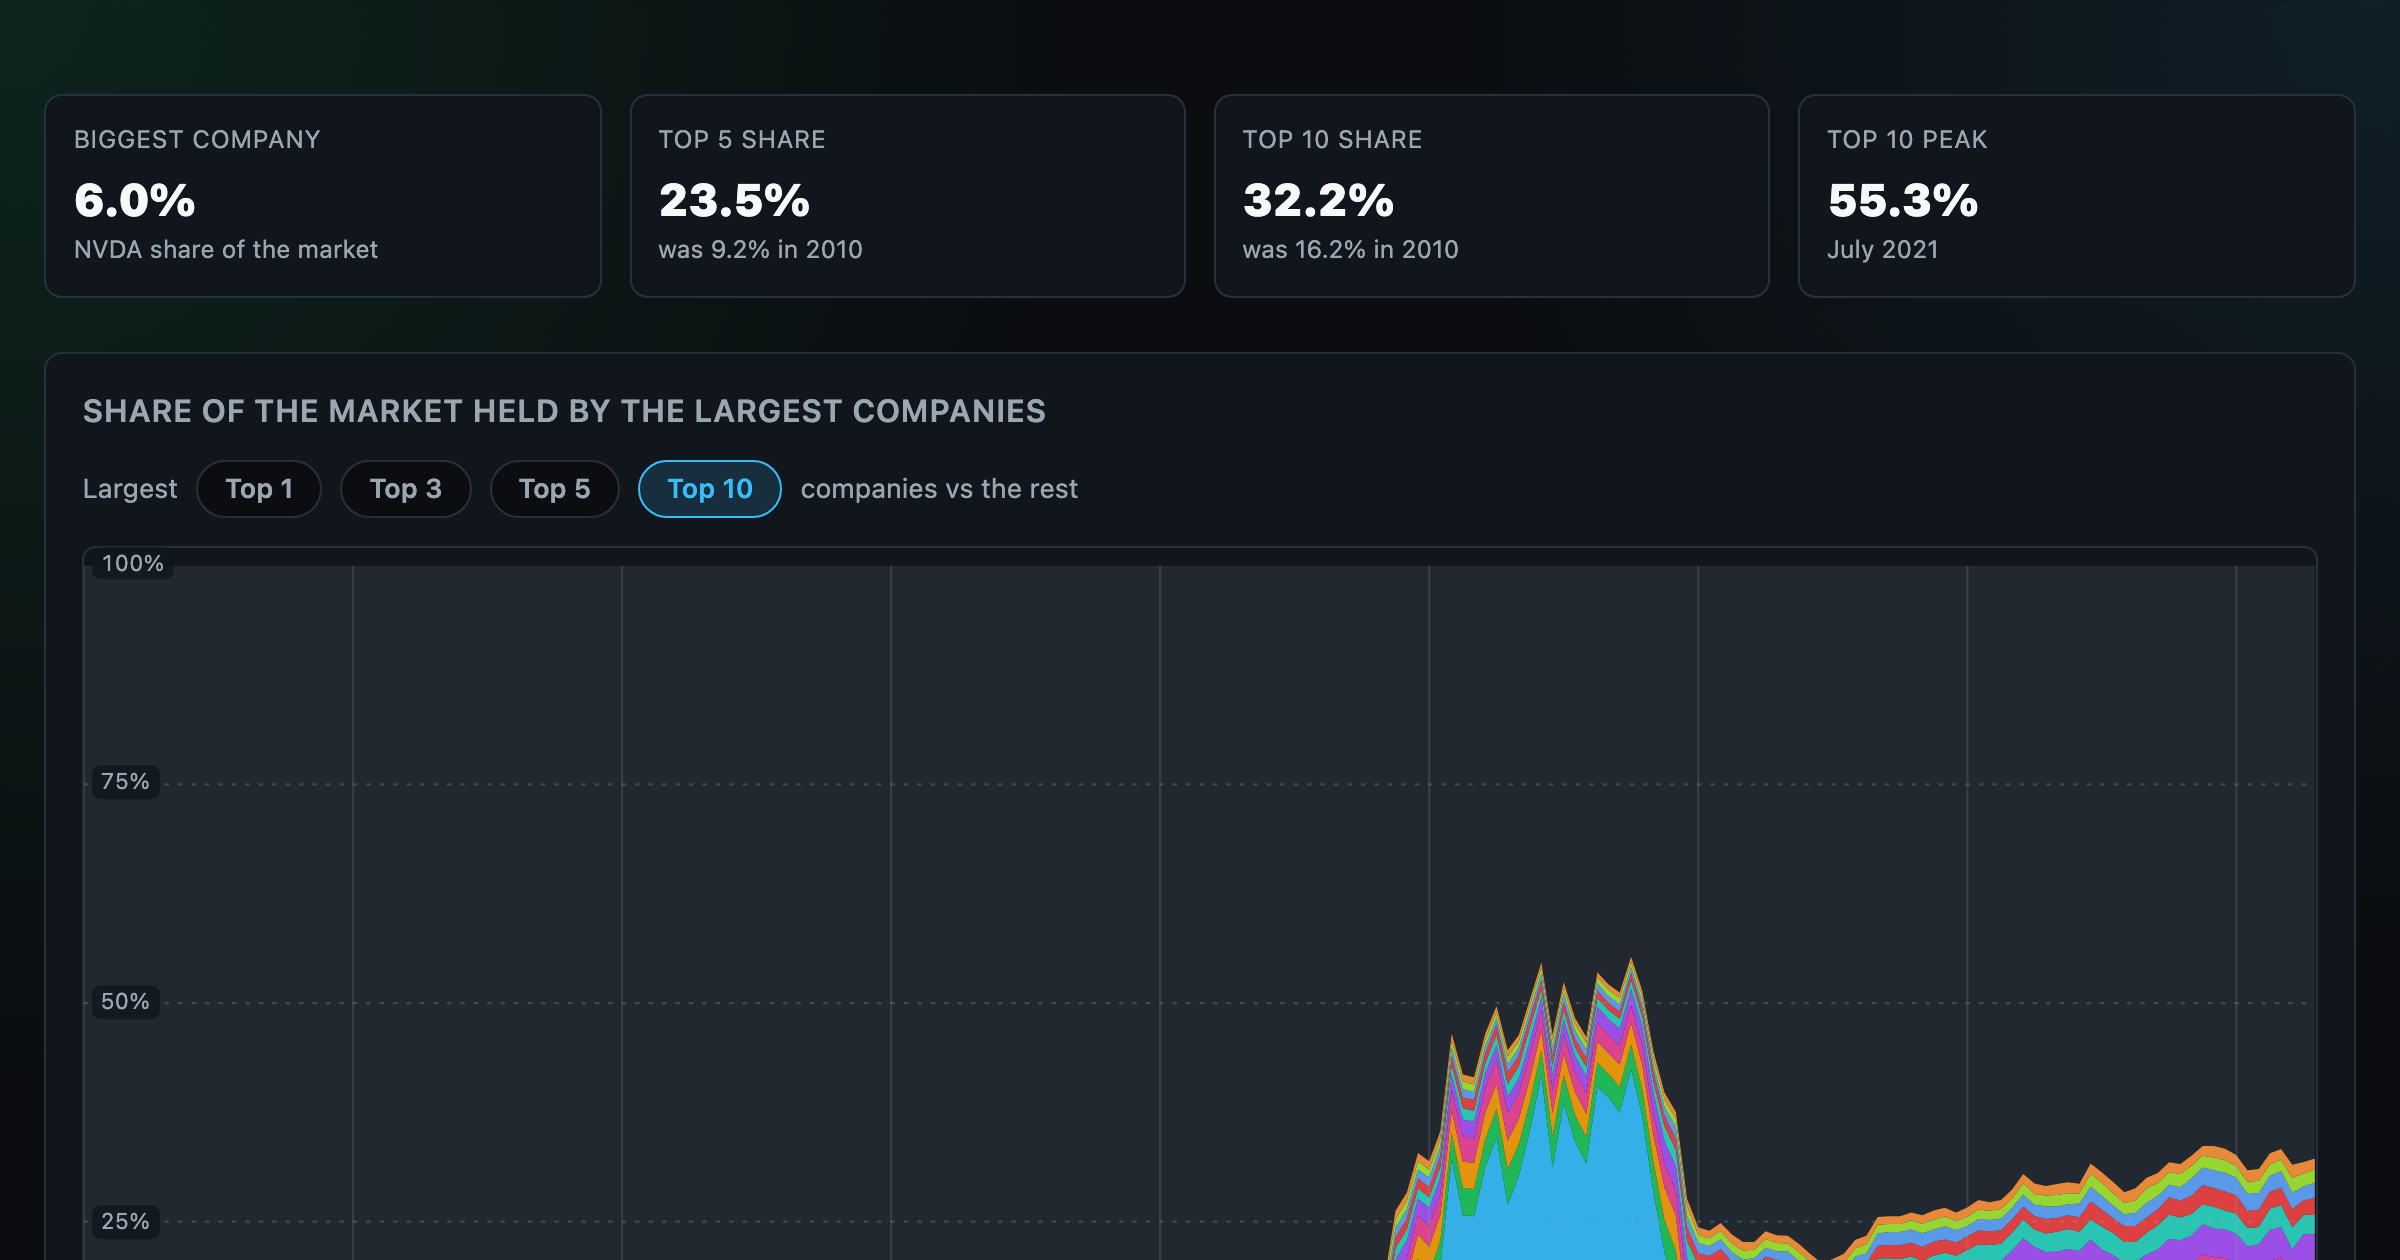
How top-heavy is the market? The top 1–10 companies' share of total market value, month by month since 2010.
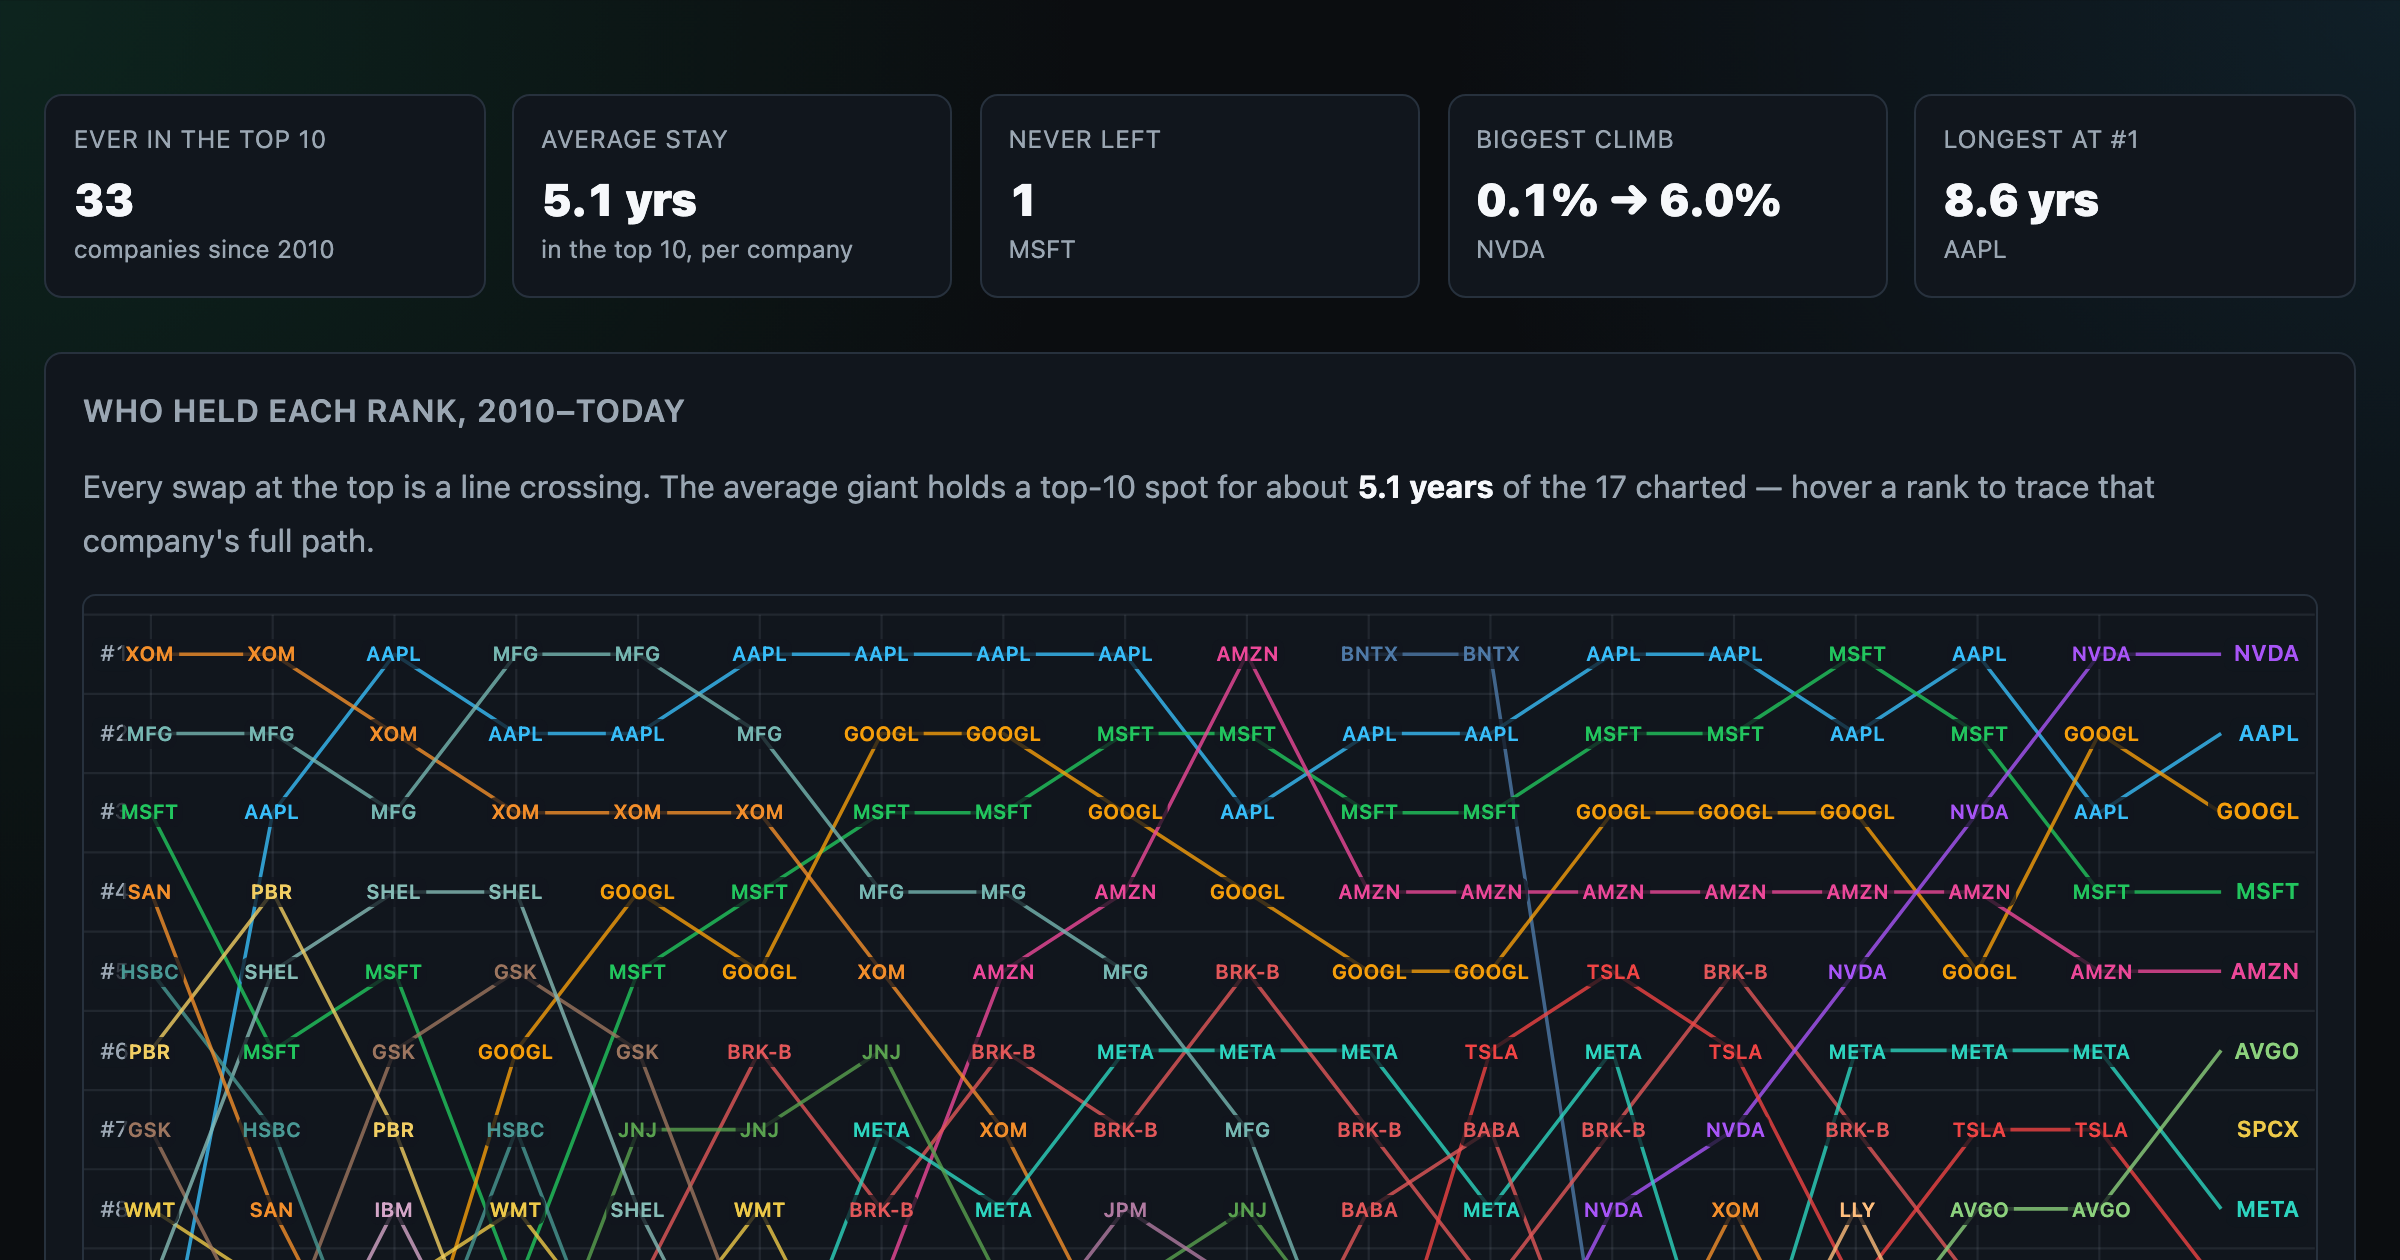
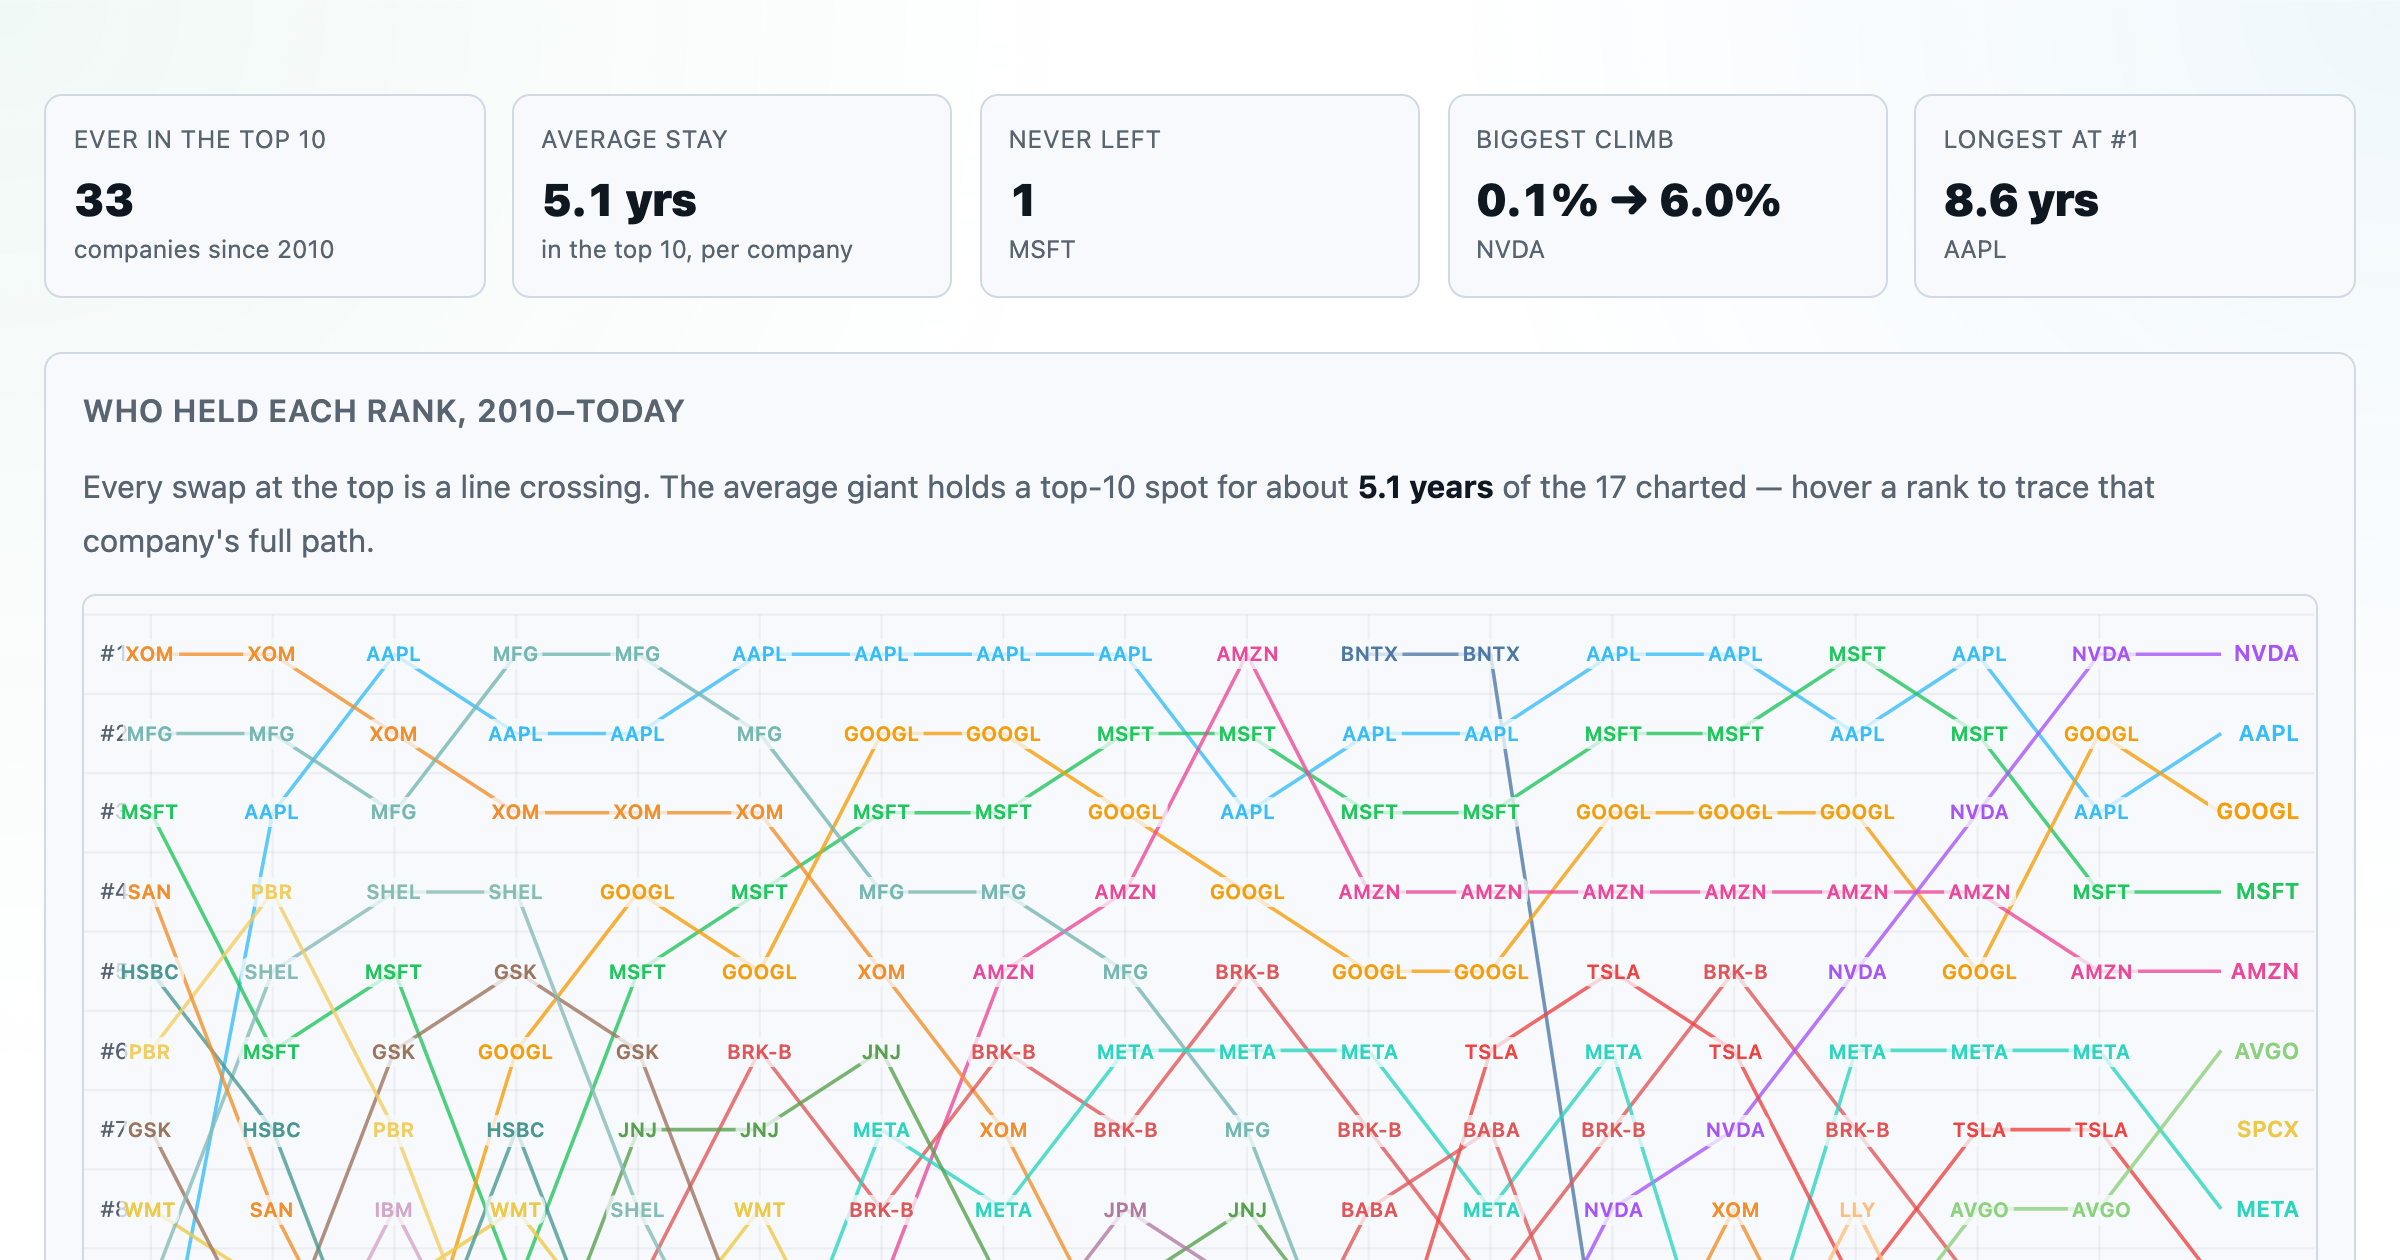
Every company that ever cracked the market's top 10 since 2010 — who climbed, who faded, who never left.