
Cheapest P/S vs their own history (2026)
Each of the 50 large caps below sits in the cheapest 2% of its own ten-year price-to-sales range; the median of them trades 52% below its own ten-year median multiple. Cheapest against its own history: Boston Scientific Corporation (BSX) at 2.9× sales, the cheapest it has been in its own last ten years, 45% below its ten-year median of 5.3×. Large caps at the cheapest price-to-sales of their own last ten years — each ranked against a decade of its own history, not against other companies. Not investment advice.
End of day 2026-10-05 · 50 entries · digits update live during market hours
Top 50 by P/S percentile against their own ten-year history, cheapest first
Save as watchlist
Technical analysis0
Addendum charts0
Overlay lines0
Columns (16 shown)
| # Company | CategoryCategory | 1Y1Y chart | ||||||||||||||
|---|---|---|---|---|---|---|---|---|---|---|---|---|---|---|---|---|
| BSXBoston Scientific | Healthcare | $42.39 | -0.49% | -11.3% | -6.1% | -55.5% | -56.4% | -0.1% | 0 | 2.9 | 5.3 | -45.2% | +13.5% | +47.0% | $61B | |
| CHTRCharter Communications | Communication Services | $107.77 | -1.39% | -29.1% | -21.5% | -48.4% | -61.5% | -85.6% | 0 | 0.2 | 1.7 | -86.2% | -1.5% | -6.5% | $13B | |
| LULULululemon Athletica | Consumer Discretionary | $93.14 | -1.40% | -7.4% | -21.4% | -55.2% | -47.0% | -76.5% | 0 | 0.9 | 5.3 | -83.2% | +1.7% | -20.7% | $10B | |
| CMCSAComcast | Communication Services | $21.57 | +0.00% | -18.6% | -9.3% | -23.0% | -25.5% | -59.5% | 0 | 0.6 | 1.6 | -62.6% | +0.6% | -51.1% | $77B | |
| LVSLas Vegas Sands | Consumer Discretionary | $36.59 | +0.99% | -17.5% | -22.1% | -43.8% | -28.2% | -2.3% | 0 | 1.7 | 4.0 | -57.1% | +18.1% | +22.3% | $24B | |
| NKENike | Consumer Discretionary | $33.97 | +0.28% | -11.6% | -23.0% | -46.7% | -52.8% | -77.3% | 0 | 1.1 | 3.2 | -65.7% | -1.2% | +6.8% | $50B | |
| CLXClorox | Consumer Staples | $82.01 | +1.99% | -11.9% | -15.7% | -18.7% | -33.4% | -49.6% | 0 | 1.5 | 2.7 | -46.1% | -5.4% | -27.5% | $10B | |
| UDRUDR | Real Estate | $33.84 | +1.71% | -7.0% | -17.6% | -7.7% | -7.0% | -36.8% | 0 | 6.3 | 9.5 | -33.4% | +1.5% | +296.1% | $12B | |
| FISVFiserv | Consumer Discretionary | $46.14 | +4.01% | -12.9% | -11.8% | -31.3% | -63.8% | -57.3% | 0 | 1.2 | 4.6 | -74.8% | +1.9% | -17.1% | $25B | |
| TUTelus | Communication Services | $7.89 | -1.93% | -18.5% | -22.7% | -40.2% | -49.8% | -64.1% | 0 | 0.8 | 2.0 | -59.1% | -1.3% | -18.7% | $12B | |
| BCEBCE | Communication Services | $19.73 | +0.00% | -16.6% | -7.8% | -17.1% | -15.5% | -60.7% | 0 | 1.0 | 2.2 | -52.0% | -1.7% | — | $18B | |
| FISFidelity National Information Services | Financials | $33.57 | +3.48% | -19.8% | -19.7% | -49.5% | -49.7% | -72.1% | 0 | 1.4 | 4.2 | -65.9% | +18.3% | +2917.7% | $17B | |
| POOLPool | Consumer Discretionary | $159.26 | -1.34% | -14.0% | -27.4% | -30.3% | -48.5% | -63.8% | 0 | 1.1 | 2.3 | -54.0% | +2.2% | -2.7% | $6B | |
| ORealty Income | Real Estate | $53.78 | -0.65% | -12.2% | -15.8% | -4.6% | -11.0% | -16.2% | 0 | 8.4 | 12.8 | -34.1% | +10.9% | +23.0% | $51B | |
| PEPPepsiCo | Consumer Staples | $125.65 | -0.19% | -8.7% | -12.9% | -12.5% | -11.5% | -16.8% | 0 | 1.8 | 2.6 | -32.2% | +5.6% | +38.6% | $171B | |
| MAAMid-America Apartment Communities | Real Estate | $116.52 | +1.08% | -9.2% | -18.1% | -16.2% | -14.8% | -38.6% | 0 | 6.1 | 8.4 | -27.6% | +0.8% | -29.5% | $14B | |
| SBACSBA Communications | Real Estate | $161.91 | +2.16% | -14.6% | -12.3% | -16.3% | -15.8% | -51.1% | 0 | 6.0 | 10.4 | -42.5% | +5.4% | +12.8% | $17B | |
| STLAStellantis | Industrials | $4.51 | +2.50% | -19.2% | -22.7% | -58.8% | -58.2% | -76.5% | 0 | 0.1 | 0.2 | -68.3% | +2.3% | — | $13B | |
| ZTSZoetis | Healthcare | $71.42 | +2.48% | -5.8% | -4.5% | -43.2% | -51.2% | -63.7% | 0 | 3.1 | 8.8 | -64.8% | +1.5% | +1.0% | $30B | |
| AMTAmerican Tower Corporation (REIT) | Real Estate | $162.26 | +0.04% | -7.7% | -2.3% | -7.6% | -14.7% | -38.7% | 0 | 6.9 | 9.8 | -29.7% | +6.7% | +15.3% | $76B | |
| PODDInsulet | Healthcare | $135.65 | +3.01% | -8.0% | -17.5% | -52.3% | -56.1% | -52.8% | 0 | 3.1 | 10.1 | -69.5% | +29.4% | +59.0% | $9B | |
| ROLRollins | Industrials | $29.69 | -1.57% | -17.2% | -31.6% | -50.5% | -49.4% | -17.3% | 0 | 3.6 | 6.9 | -47.2% | +9.9% | +8.7% | $14B | |
| FLUTFlutter Entertainment | Technology | $75.76 | +1.27% | -24.4% | -28.6% | -64.8% | -70.5% | -61.7% | 0 | 0.8 | 9.3 | -91.8% | +15.2% | — | $13B | |
| EFXEquifax | Industrials | $142.67 | +1.91% | -19.5% | -17.1% | -34.3% | -39.7% | -44.8% | 0 | 2.6 | 5.0 | -47.8% | +10.4% | +8.1% | $17B | |
| HDBHDFC Bank | Financials | $22.11 | -1.03% | -4.6% | -14.2% | -39.5% | -35.4% | -39.6% | 0 | 4.6 | 10.2 | -55.1% | -3.2% | -4.7% | $113B | |
| CSGPCoStar Group | Real Estate | $27.66 | +1.02% | -10.5% | -7.8% | -58.9% | -67.4% | -68.0% | 0 | 3.2 | 13.5 | -76.7% | +22.0% | -29.3% | $11B | |
| APTVAptiv | Consumer Discretionary | $43.90 | +0.82% | -8.5% | -25.5% | -42.3% | -50.1% | -72.2% | 0 | 0.5 | 1.5 | -67.4% | +5.3% | -78.3% | $9B | |
| ALNYAlnylam Pharmaceuticals | Healthcare | $220.02 | +0.14% | -17.4% | -29.7% | -44.7% | -51.8% | +10.9% | 0 | 6.1 | 30.0 | -79.6% | +95.2% | — | $29B | |
| ZTOZTO Express (Cayman) ADR | Industrials | $19.71 | +1.08% | -6.0% | -14.6% | -5.7% | +3.7% | -35.3% | 0 | 2.2 | 5.4 | -58.8% | +15.7% | +7.5% | $16B | |
| LKQLKQ | Consumer Discretionary | $22.41 | -1.71% | -12.3% | -15.6% | -25.8% | -28.6% | -56.2% | 0 | 0.4 | 0.9 | -56.4% | +1.3% | -35.2% | $6B | |
| EIXEdison International | Utilities | $54.26 | +0.69% | -4.5% | -28.3% | -9.6% | -1.9% | -2.6% | 0 | 1.1 | 1.6 | -33.5% | +10.7% | +42.2% | $21B | |
| TAPMolson Coors Beverage | Consumer Staples | $36.52 | -0.92% | -9.8% | -8.2% | -21.8% | -21.3% | -24.3% | 0 | 0.5 | 0.9 | -41.1% | -2.6% | — | $7B | |
| JDJD.com ADR | Consumer Discretionary | $26.36 | +2.25% | -6.7% | -1.0% | -8.2% | -25.5% | -63.2% | 0 | 0.2 | 0.6 | -69.8% | +17.9% | -50.5% | $36B | |
| TRUTransUnion | Financials | $63.85 | +0.65% | -20.1% | -18.5% | -25.6% | -17.5% | -44.4% | 0 | 2.5 | 4.7 | -46.7% | +12.4% | +88.5% | $12B | |
| MGMMGM Resorts International | Consumer Discretionary | $30.18 | -0.98% | -26.8% | -35.9% | -17.3% | -11.1% | -32.9% | 0 | 0.4 | 1.2 | -63.8% | +3.2% | -21.1% | $8B | |
| CPTCamden Property Trust | Real Estate | $97.40 | +1.50% | -7.9% | -17.0% | -11.5% | -6.6% | -35.7% | 0 | 6.2 | 8.6 | -28.2% | +0.8% | +109.2% | $10B | |
| HRLHormel Foods | Consumer Staples | $20.08 | -0.86% | -6.8% | -19.7% | -15.3% | -18.5% | -51.3% | 1 | 0.9 | 2.0 | -55.0% | +0.7% | -54.7% | $11B | |
| CICigna Group | Healthcare | $271.35 | +0.30% | -4.0% | -5.7% | -1.4% | -12.8% | +34.7% | 1 | 0.3 | 0.5 | -46.0% | +7.8% | +51.9% | $72B | |
| CAGConagra Brands | Consumer Staples | $13.20 | -1.20% | -14.8% | -8.0% | -23.8% | -31.0% | -61.5% | 1 | 0.6 | 1.4 | -60.9% | -1.8% | — | $6B | |
| DPZDomino's Pizza | Consumer Discretionary | $297.37 | -0.08% | -12.8% | -4.6% | -28.7% | -30.3% | -37.4% | 1 | 2.0 | 3.3 | -40.3% | +5.2% | -0.1% | $10B | |
| INTUIntuit | Technology | $284.72 | +1.29% | -14.4% | +3.4% | -57.0% | -58.1% | -46.6% | 1 | 3.5 | 9.8 | -63.9% | +13.9% | +18.0% | $76B | |
| COOCooper Companies | Healthcare | $56.76 | -0.26% | -18.4% | -23.5% | -30.7% | -19.4% | -45.3% | 1 | 2.5 | 5.2 | -51.2% | +4.7% | +39.9% | $11B | |
| WYNNWynn Resorts | Consumer Discretionary | $77.19 | +1.73% | -15.7% | -19.5% | -35.9% | -37.6% | -9.3% | 1 | 1.1 | 2.1 | -47.7% | +6.4% | +16.9% | $8B | |
| WYWeyerhaeuser | Real Estate | $18.51 | +0.19% | -19.7% | -22.3% | -22.0% | -26.4% | -48.3% | 1 | 1.9 | 2.9 | -33.1% | -2.6% | +69.2% | $13B | |
| MKCMcCormick | Consumer Staples | $45.51 | +1.88% | -12.6% | -14.8% | -33.1% | -33.9% | -43.1% | 1 | 1.6 | 2.9 | -44.2% | +13.2% | +91.7% | $12B | |
| KHCKraft Heinz | Consumer Staples | $21.84 | -1.58% | -12.1% | -13.9% | -9.9% | -16.2% | -41.1% | 1 | 1.0 | 1.6 | -36.9% | -1.6% | — | $26B | |
| EXRExtra Space Storage | Real Estate | $132.88 | -0.28% | -4.6% | -11.0% | +2.1% | -6.9% | -20.8% | 1 | 8.1 | 10.6 | -23.3% | +4.2% | -1.9% | $28B | |
| HDHome Depot | Consumer Discretionary | $281.11 | -0.62% | -12.4% | -21.4% | -18.3% | -28.8% | -14.7% | 1 | 1.7 | 2.1 | -22.7% | +2.5% | -2.8% | $280B | |
| YUMCYum China Holdings | Consumer Discretionary | $40.23 | +0.63% | -7.7% | -3.5% | -15.7% | -4.9% | -30.9% | 1 | 1.1 | 1.9 | -40.9% | +8.8% | +6.1% | $14B | |
| LENLennar | Consumer Discretionary | $74.44 | -6.73% | -10.9% | -15.6% | -27.6% | -42.8% | -16.3% | 2 | 0.6 | 0.9 | -41.2% | -8.0% | -51.3% | $18B |
Methodology
Every US-listed large cap ($5B and up) with a full ten years of daily price-to-sales on file — at least 2,400 positive daily observations in the window, 95% of a decade of sessions — ranked by where today's P/S sits in its own ten-year distribution: the 0th percentile is the cheapest the stock has been on sales in that window, the 100th the dearest. Each company is compared with its own past, never with other companies. Price to sales rather than P/E or P/FCF because sales carry no one-off gains, are never negative, and are on file for the whole decade for far more companies. Multiples use trailing-twelve-month revenue from SEC filings over the settled close; the ten-year median and the discount to it come from the same daily series. Cheap against its own past is a screen, not a verdict — the sales- and earnings-growth columns show whether the business shrank with the multiple.
Performance columns are price returns: the change in the split-adjusted share price, the way quote screens report it, through the latest print during the session. Dividends are not reinvested. Fundamentals come from company filings via our EDGAR pipeline. Past performance does not predict future returns; this is not investment advice.
FAQ#
- Which large-cap stock is the cheapest against its own price-to-sales history?
- Boston Scientific Corporation (BSX) trades at 2.9× sales at the cheapest it has been in its own last ten years, 45% below its ten-year median of 5.3×.
- What does the P/S percentile mean?
- Where today's price-to-sales sits among every daily value the stock has recorded over the last ten years: 0 means it has never been cheaper on sales in that window, 100 never dearer, 50 is its own median. It compares a company with its own past, not with other companies — a software company at 8× sales and a grocer at 0.4× can both sit at their 5th percentile, and both belong here.
- Why price to sales rather than P/E or price to free cash flow?
- Sales carry no one-off gains or losses, are never negative, and are on file for a full decade for far more companies than earnings or free cash flow — so a low reading is a real de-rating, not one odd quarter. What P/S cannot see: a company whose margins fell, or one that bought a large low-margin business, looks cheaper on sales without being cheaper. The sales- and earnings-growth columns catch the first; the second needs a look at the company.
- Is a stock at a ten-year-low valuation a buy?
- Not by itself. A multiple at the bottom of its own range means the market now pays far less for a dollar of this company's sales than it used to — sometimes because the business changed for the worse, sometimes because sentiment did. The columns beside the percentile are there to tell the two apart: revenue and earnings growth over the last year, and how far today's multiple sits below the ten-year median. This is a screen, not advice.
- Why is a well-known company missing?
- The list requires a full ten years of daily price-to-sales on file (at least 2,400 observations) and a market cap of $5 billion or more. A company listed, spun off or re-keyed in our record within the last decade is left out rather than compared against a shorter history labelled as ten years; so are companies whose revenue we cannot read from their filings. Our record is not complete, and a company can be missing for no better reason than a hole in it.
More lists
Highest realized shareholder yield
50 stocksShares actually retired plus dividends — the cash-over-market-cap version flatters fallen stocks.
Highest fundamental return
50 stocksEarnings growth plus cash returned — the annual return the business made, before any re-rating.
Highest realized buyback yield
50 stocksShares actually retired over the past year — the buyback measure a collapsed stock price can't flatter.
Highest dividend stocks
50 stocksThe 50 highest dividend yields among US-listed large caps, each one checked against dividends actually paid in the past year.
Dividend growth stocks
50 stocksLarge caps that have raised the dividend every year for 10 or more years, ranked by how fast the payment has grown over five years.
25+ years of dividend increases
Every US-listed large cap that has raised its dividend for 25 or more consecutive years in our record, longest streak first.
Explore visualizations
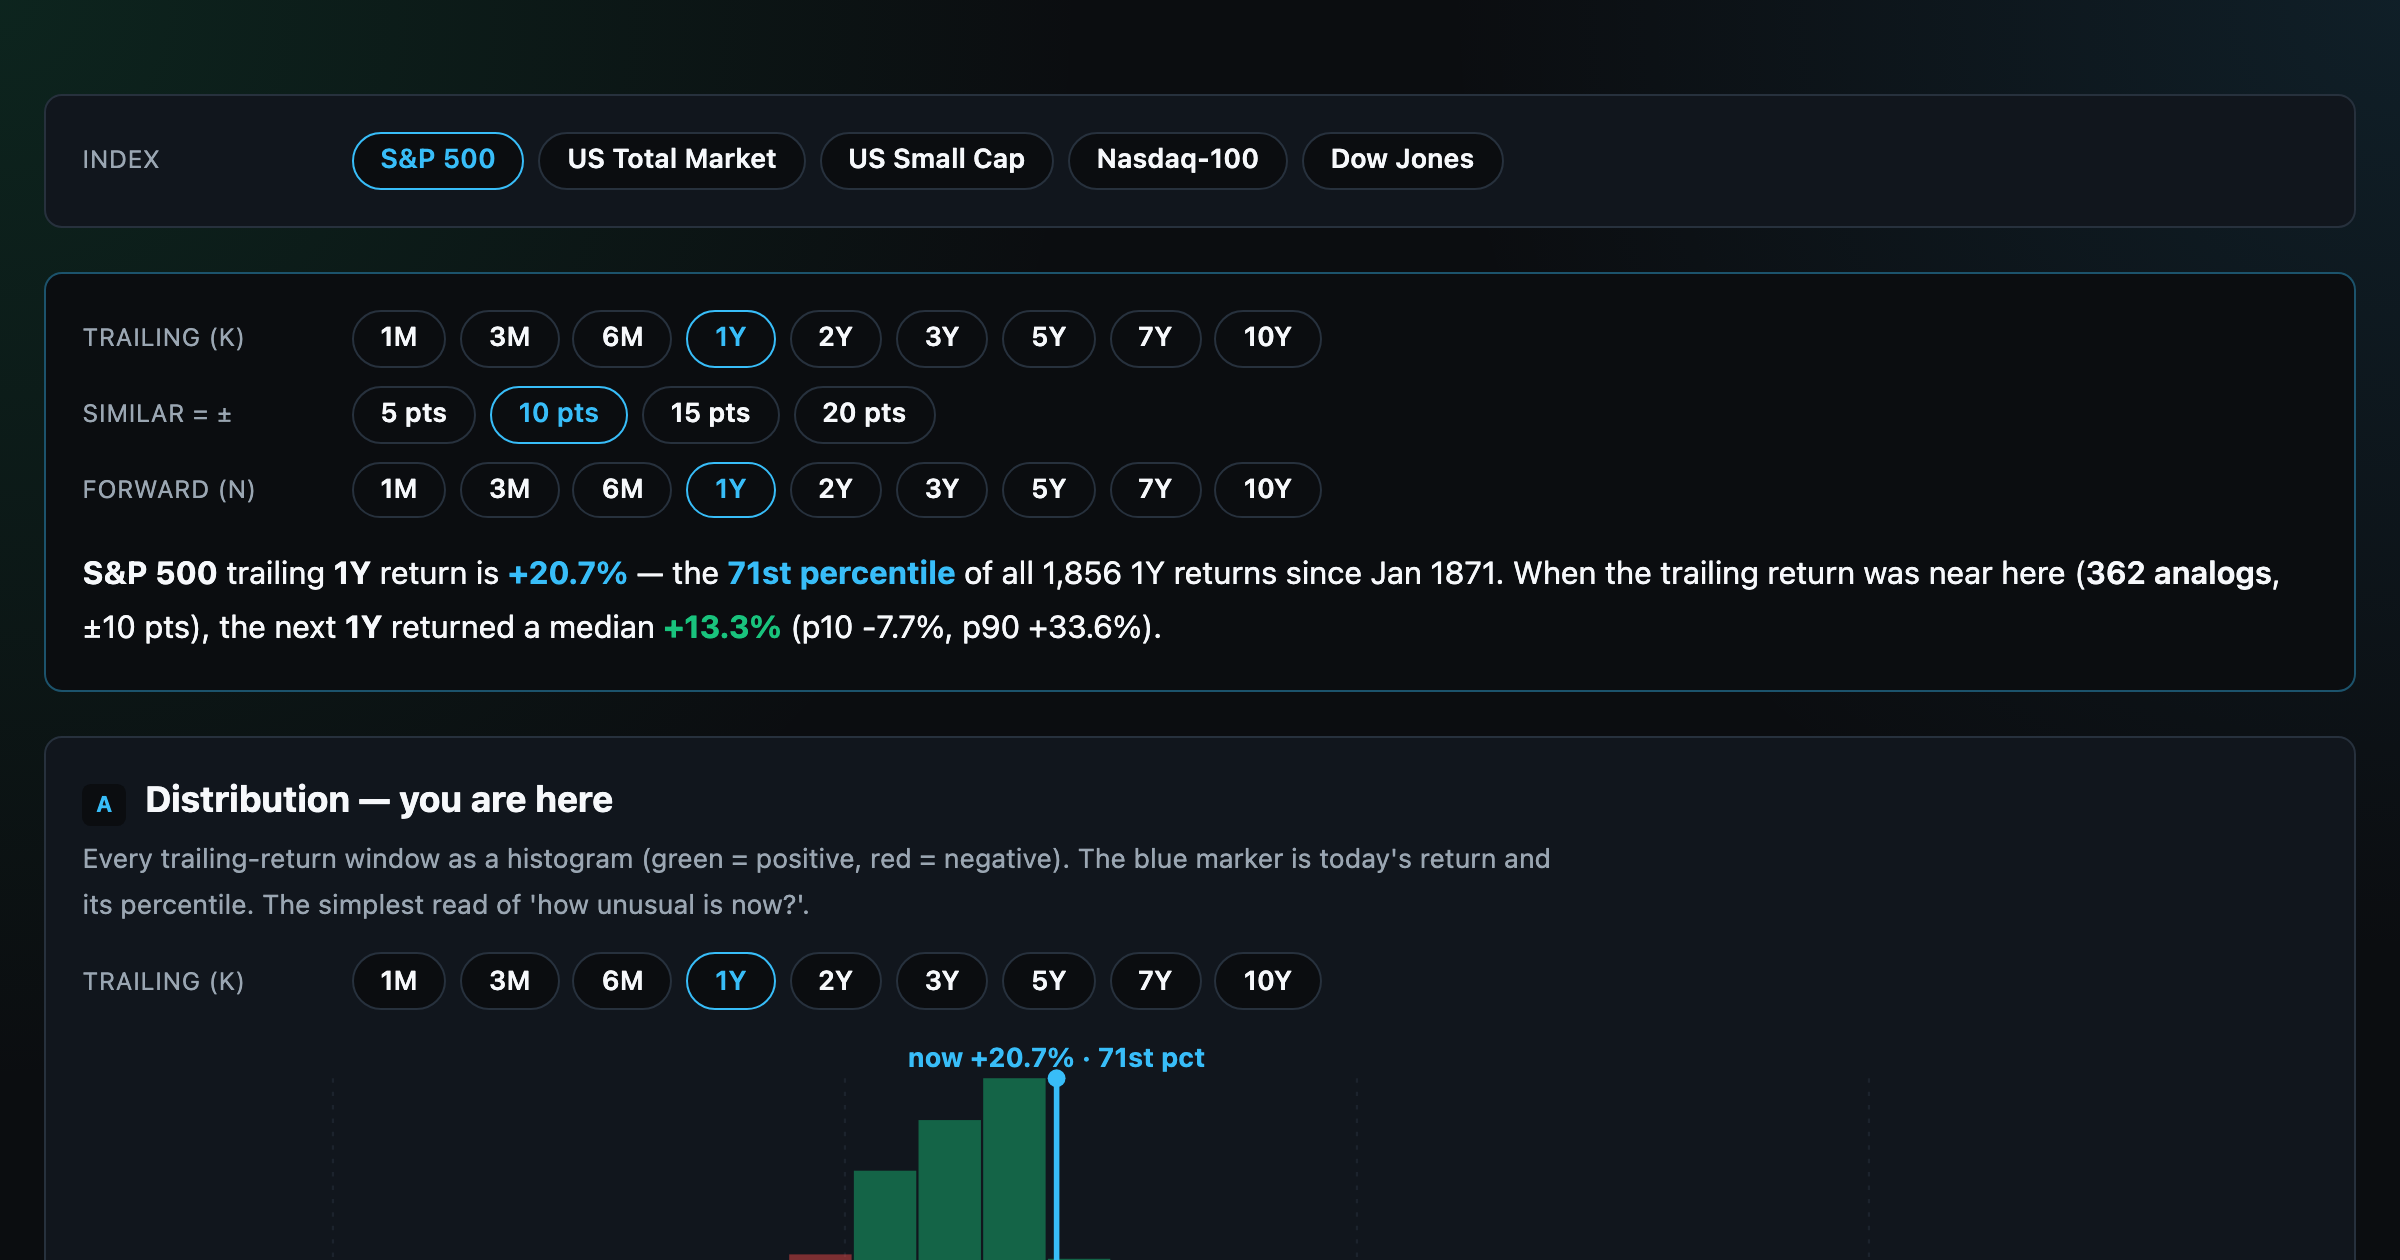
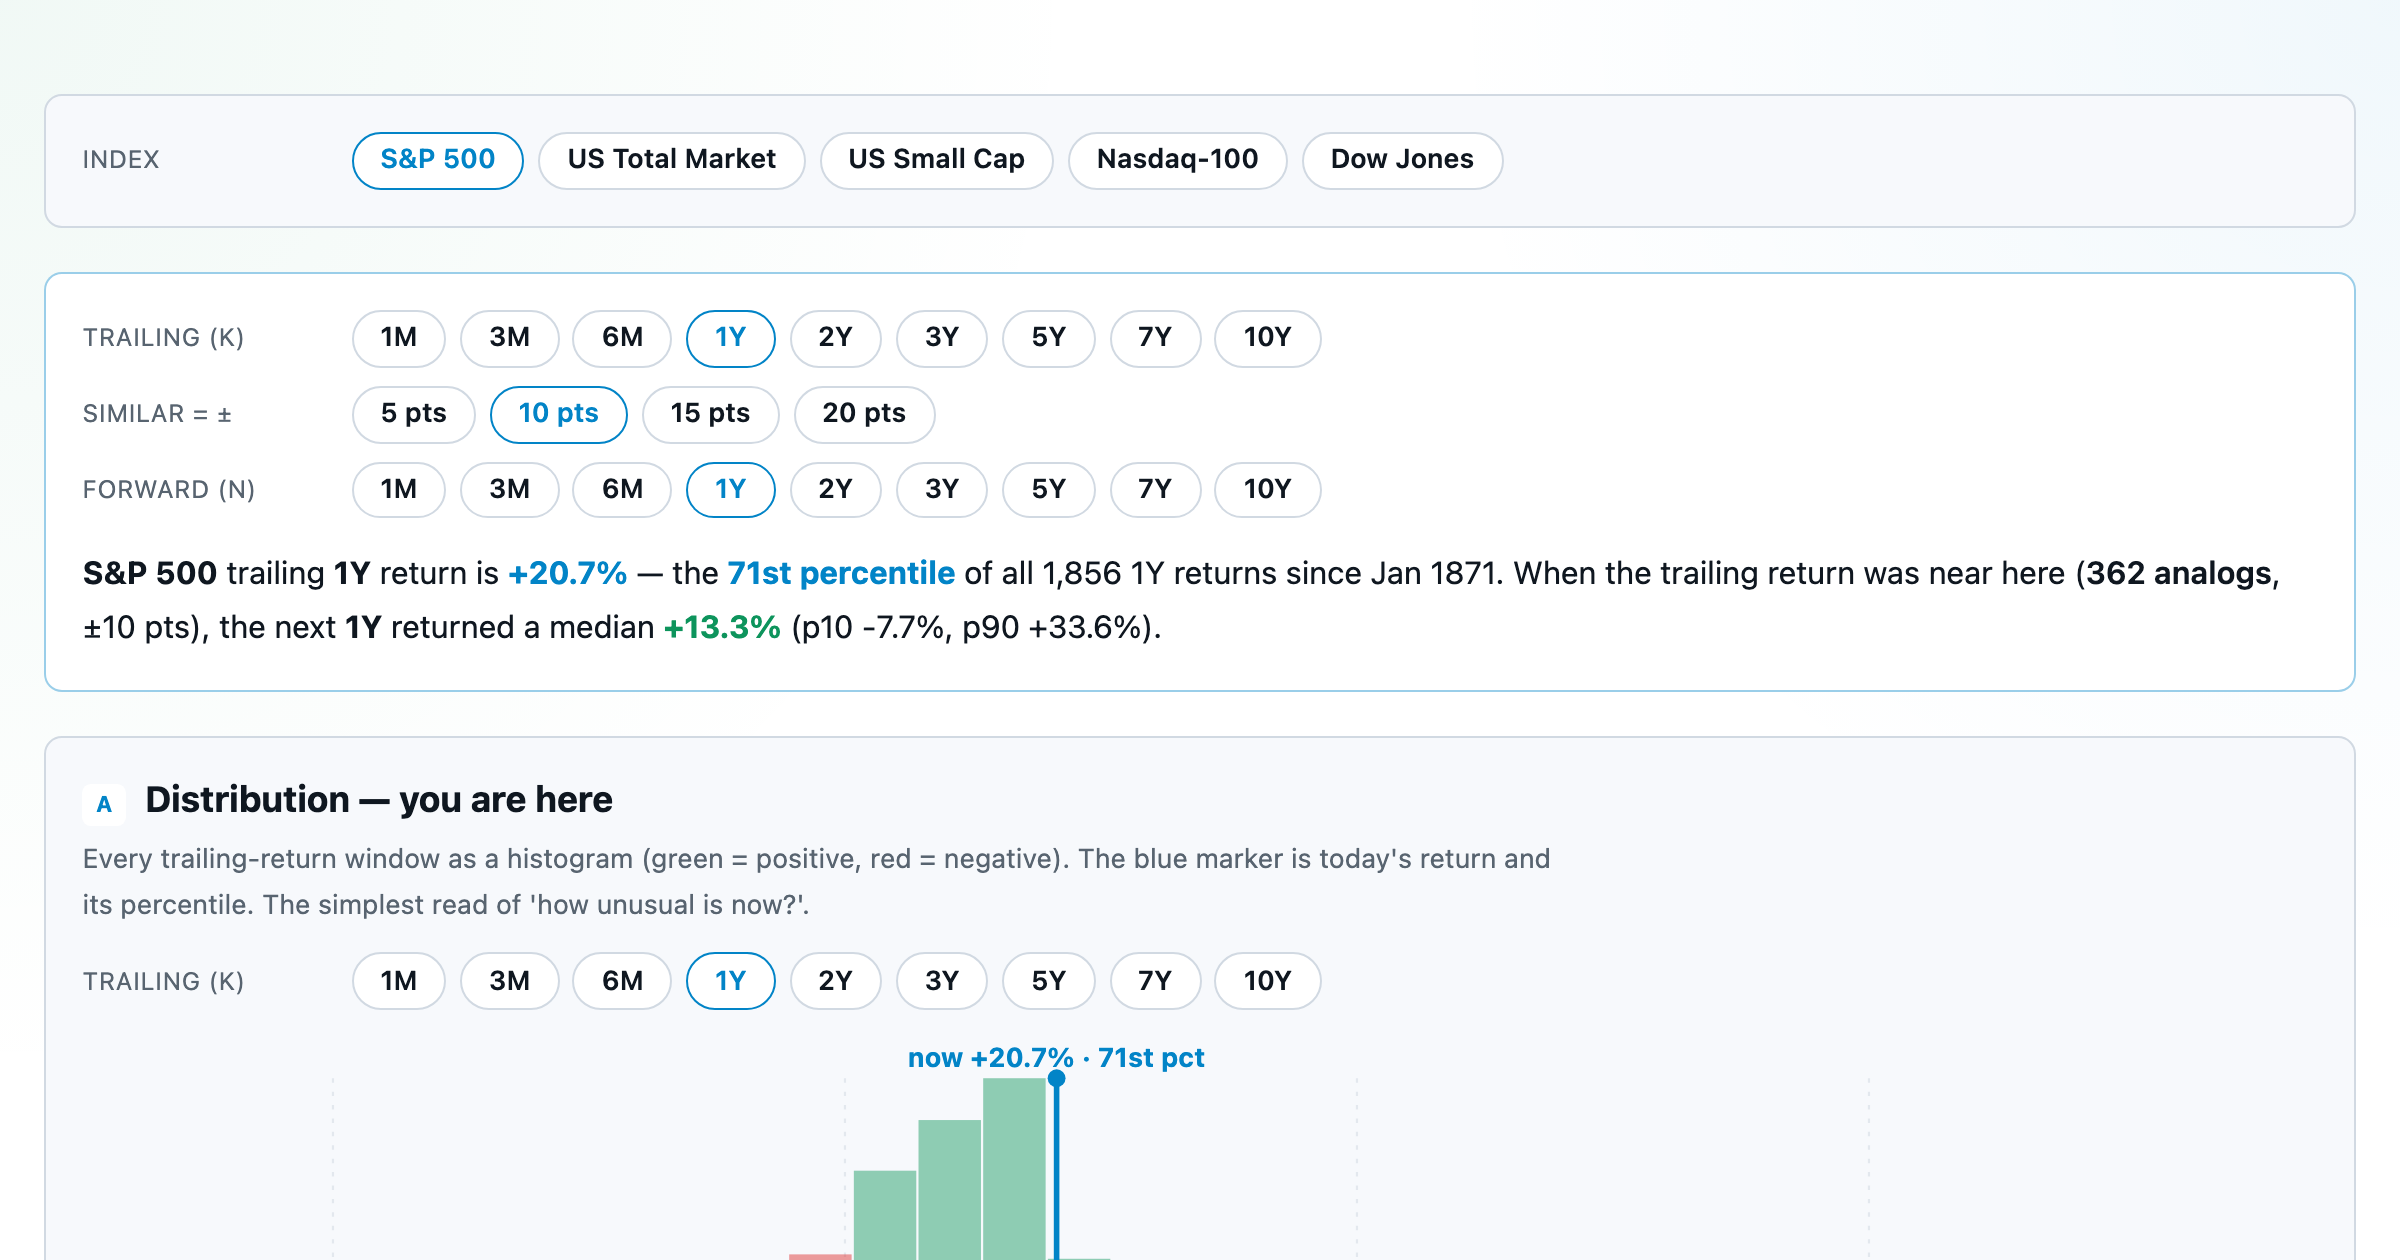
Where today's S&P 500 return ranks against all history — and the forward returns that followed similar moments.
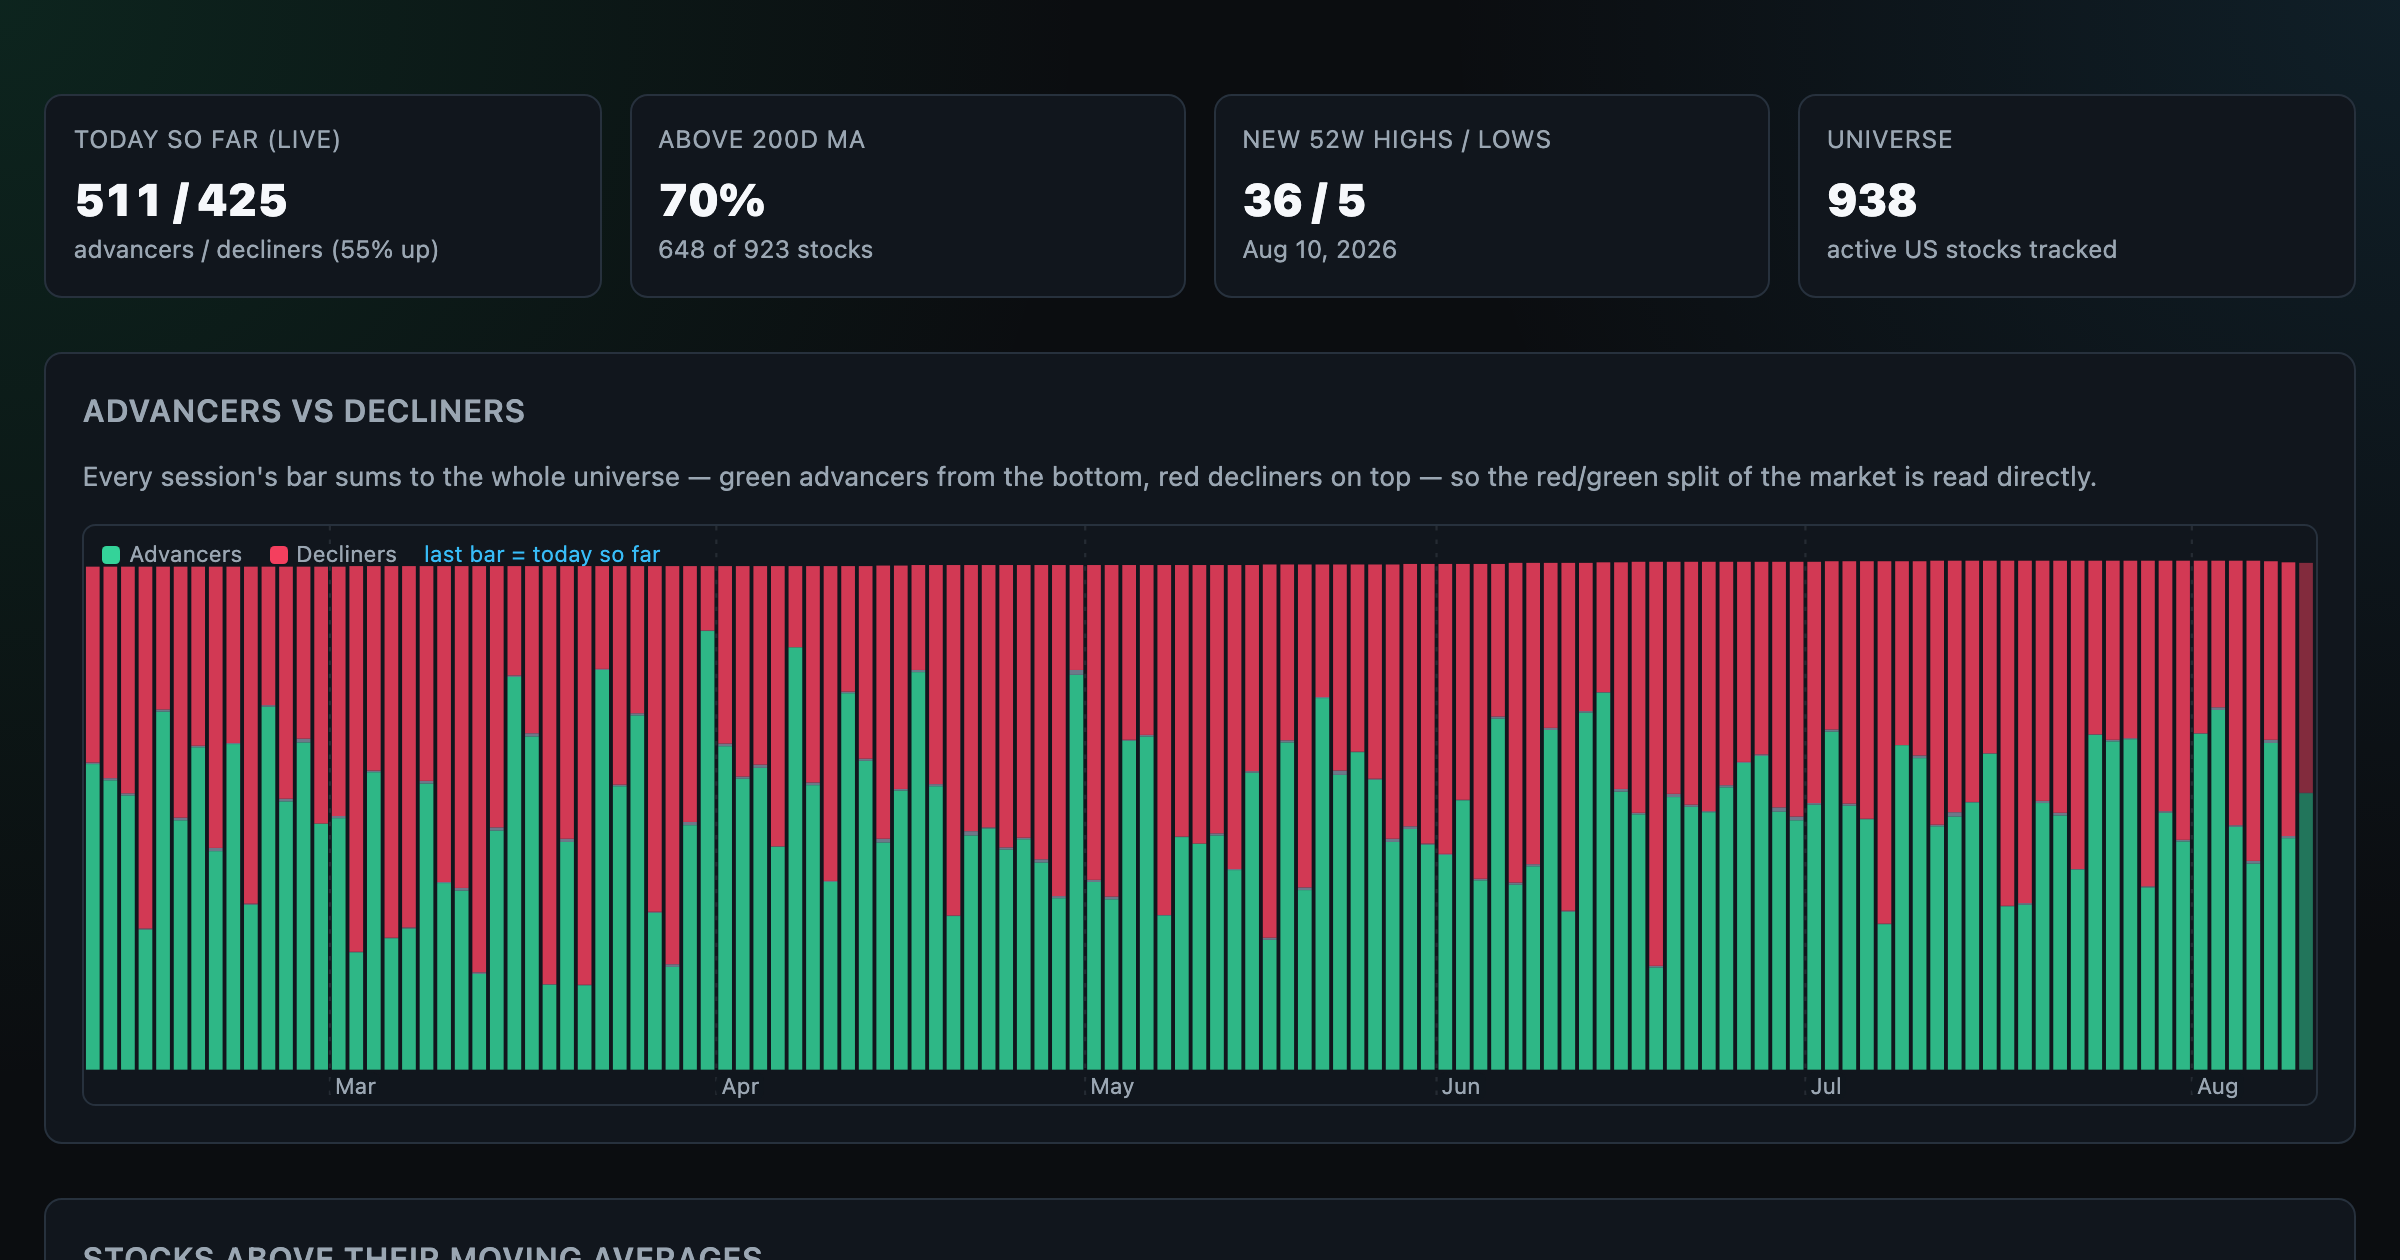
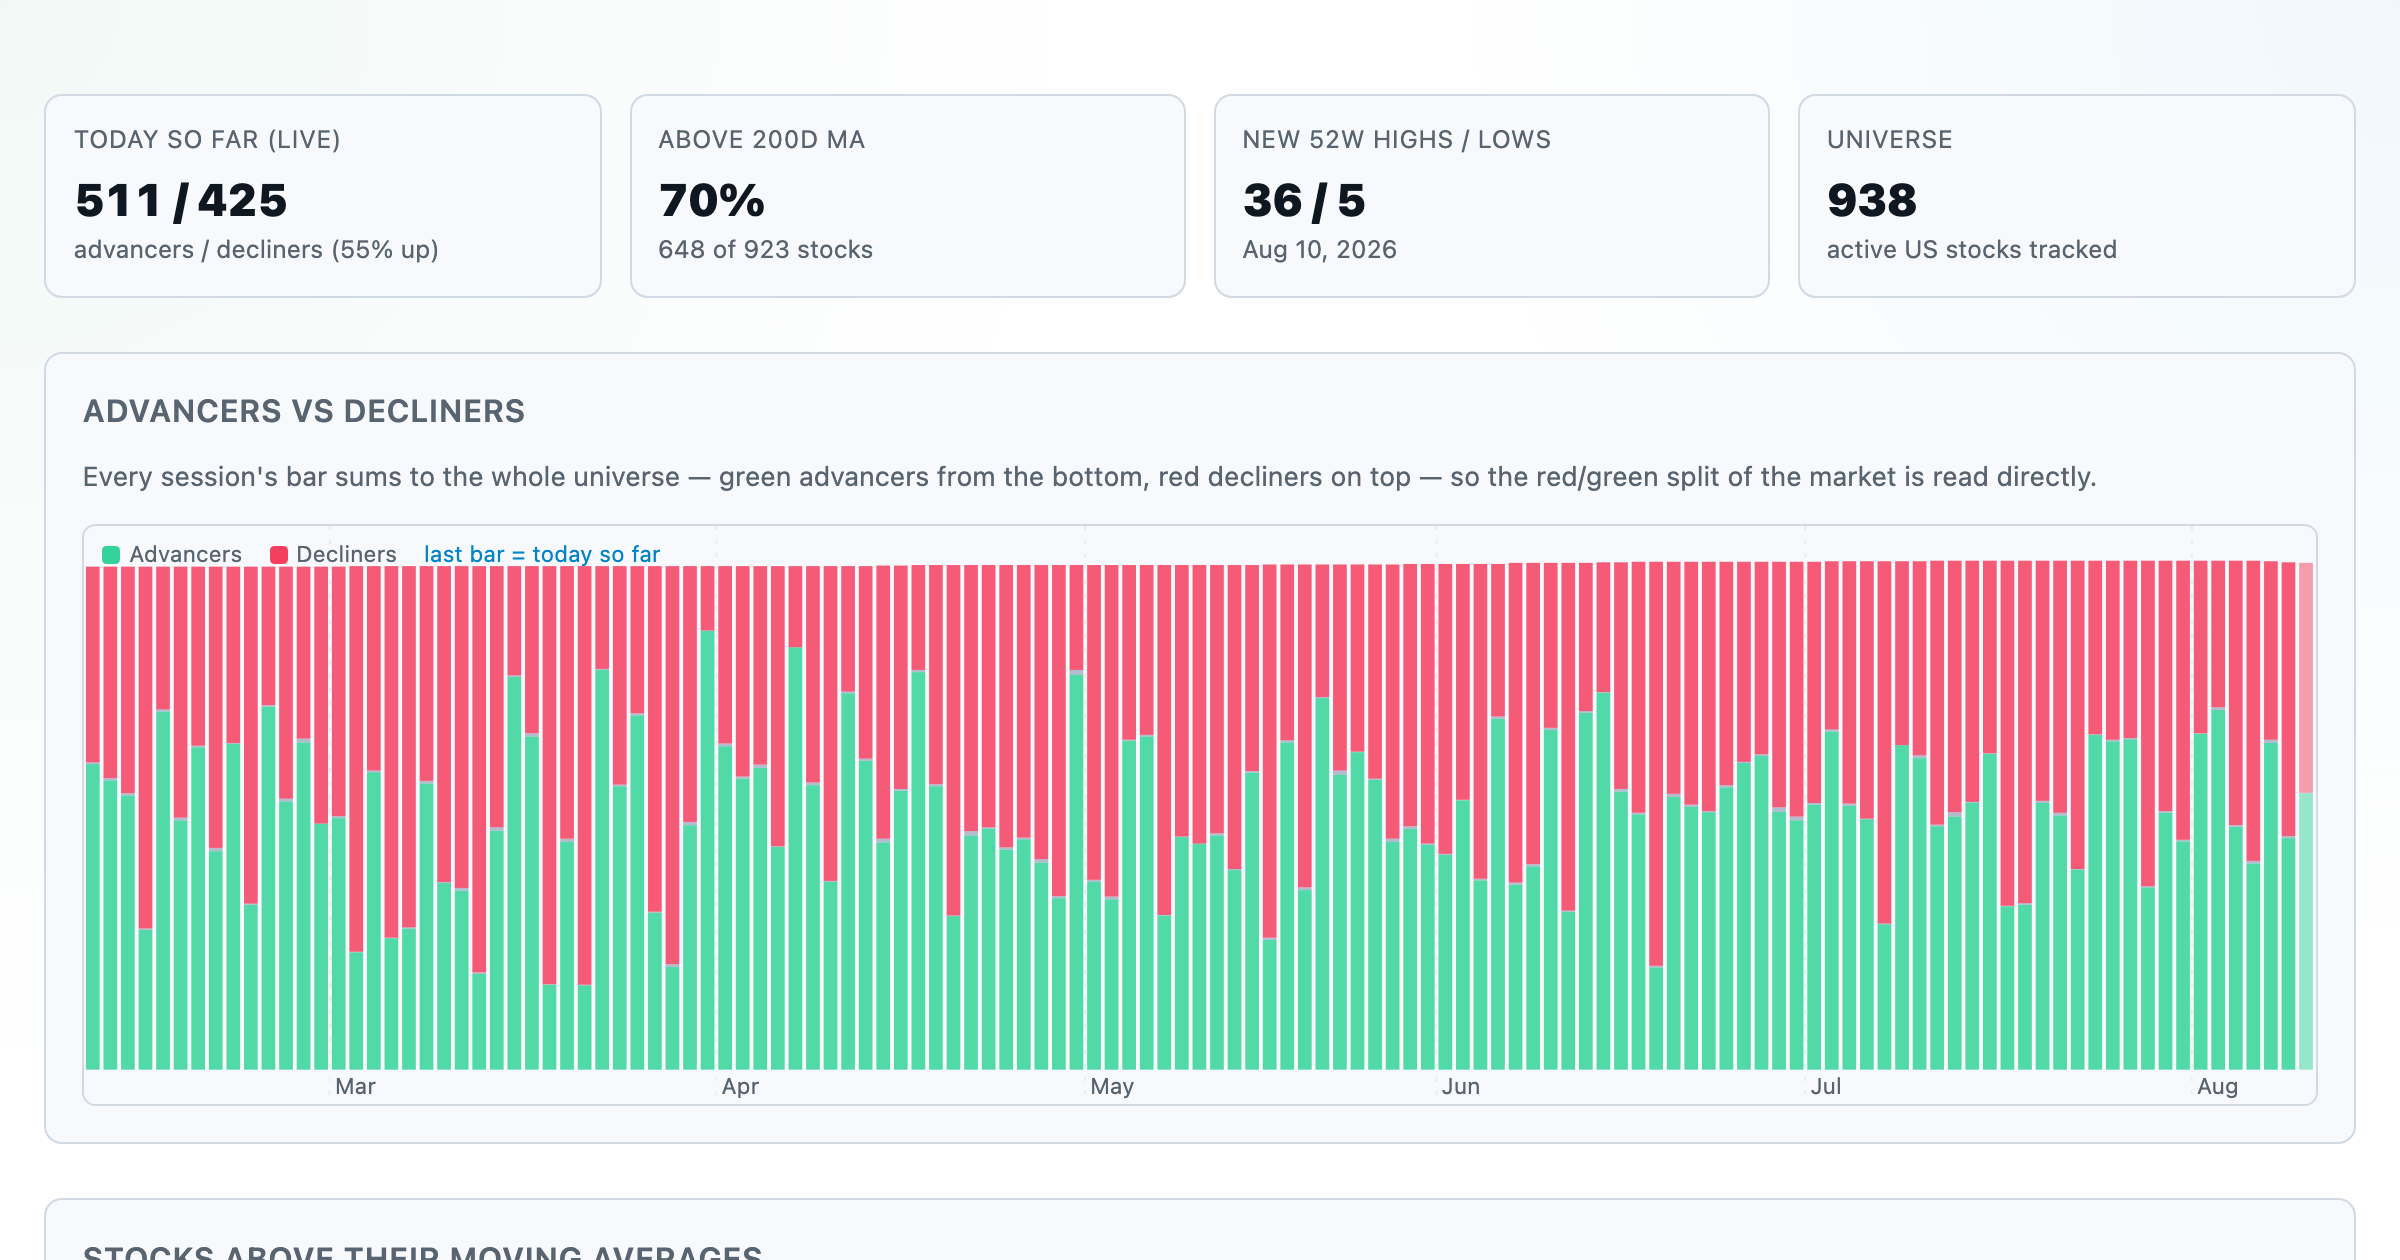
Advancers vs decliners over time, % of stocks above their moving averages, new highs vs lows, and breadth across every trailing window.
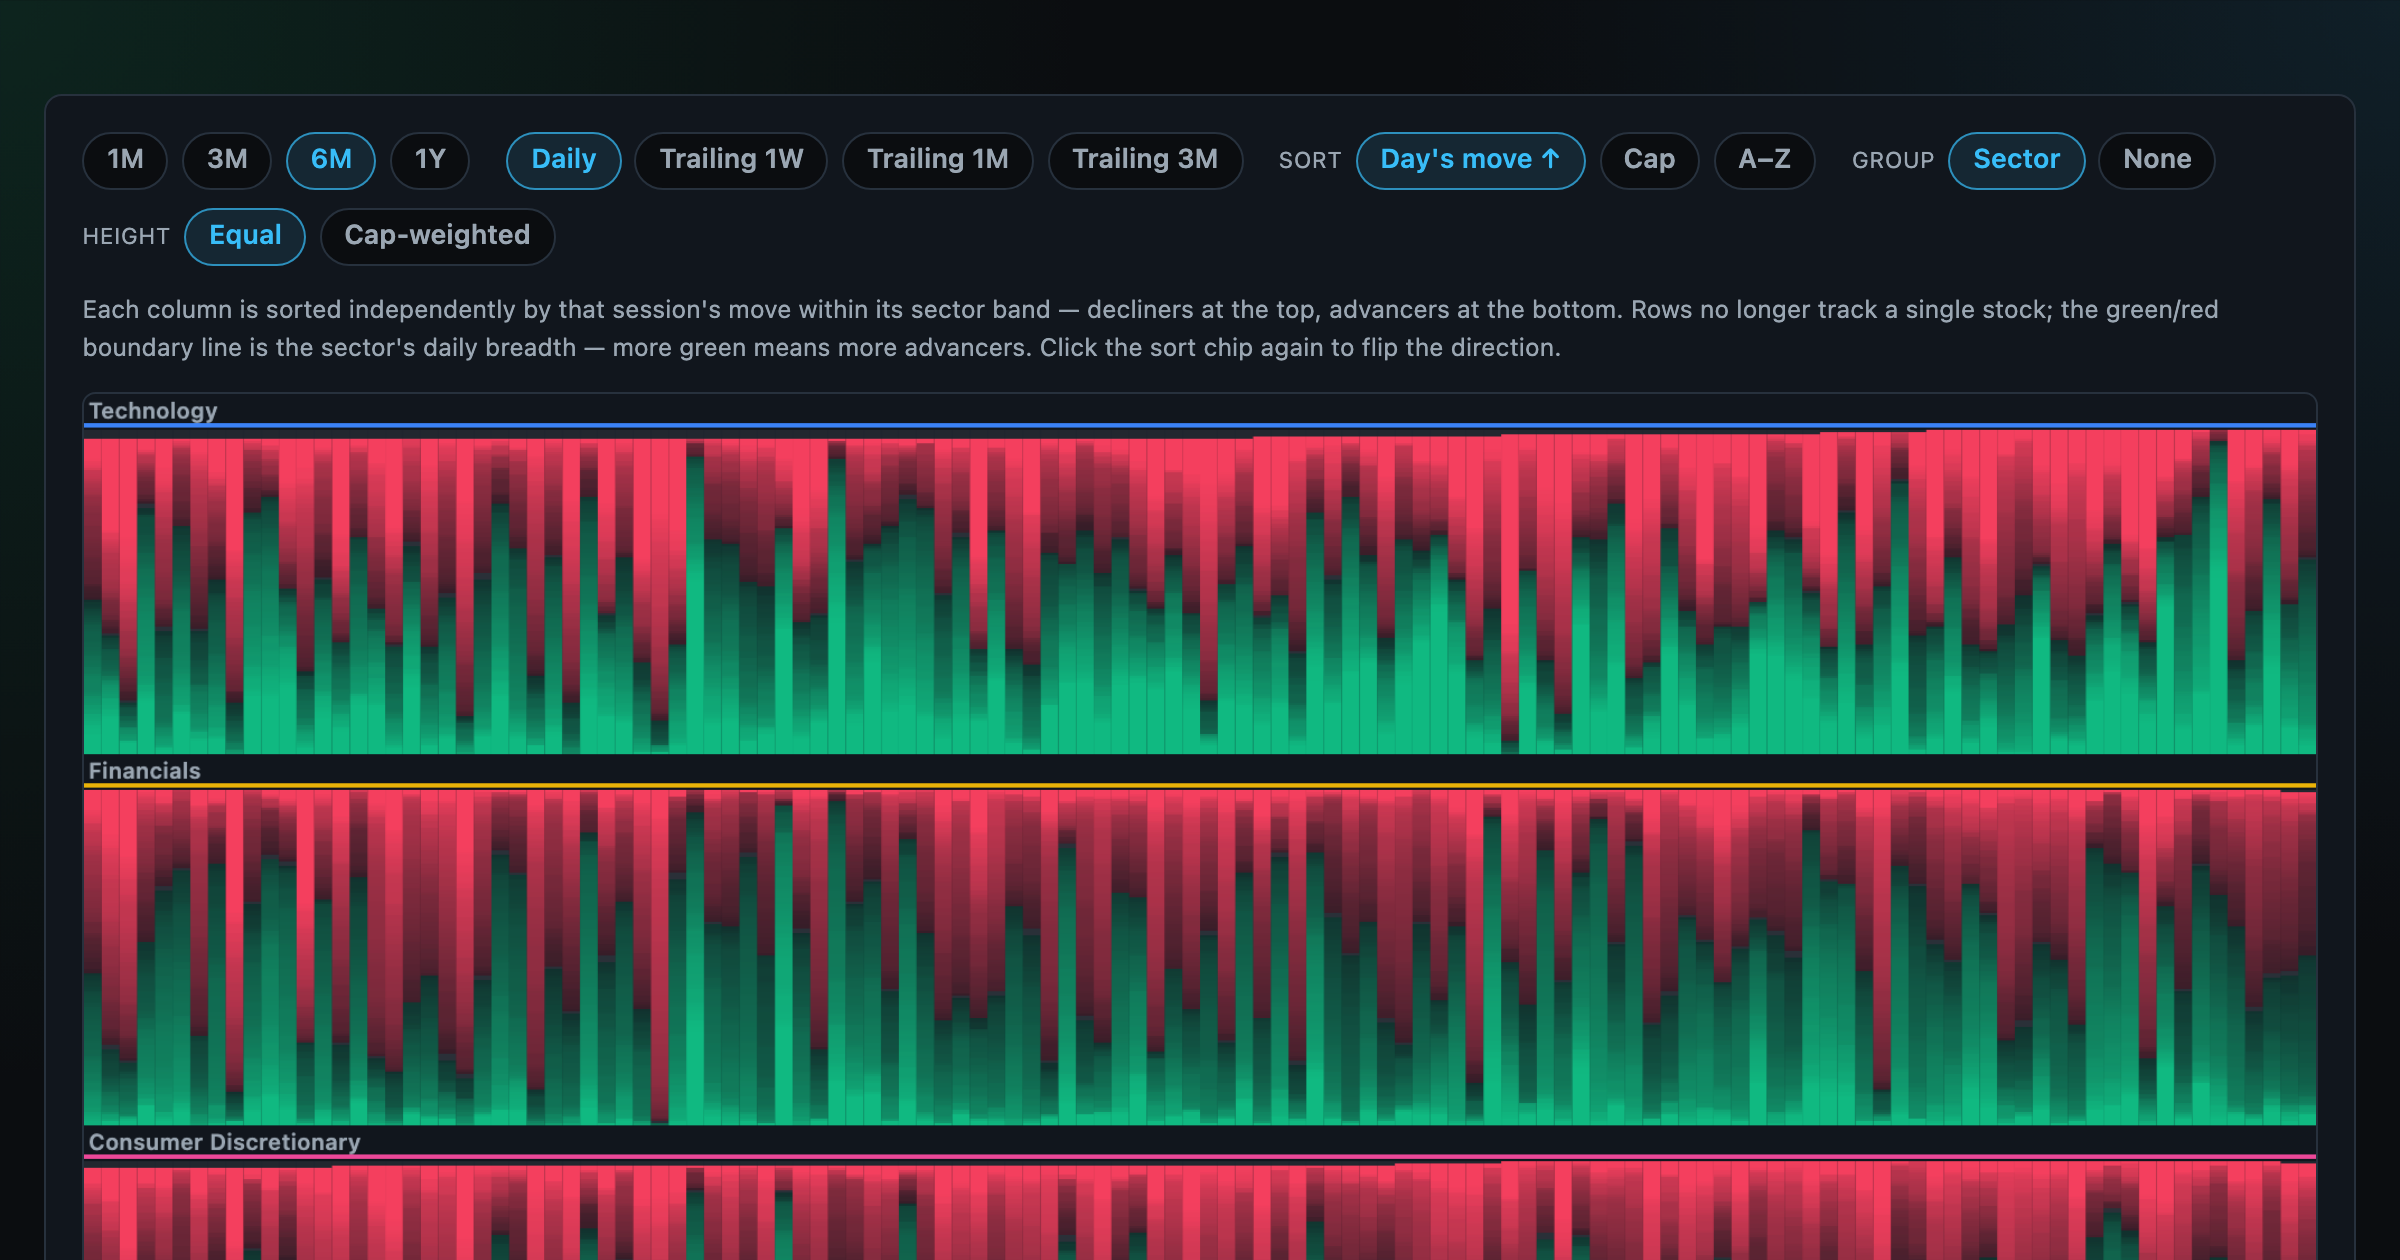
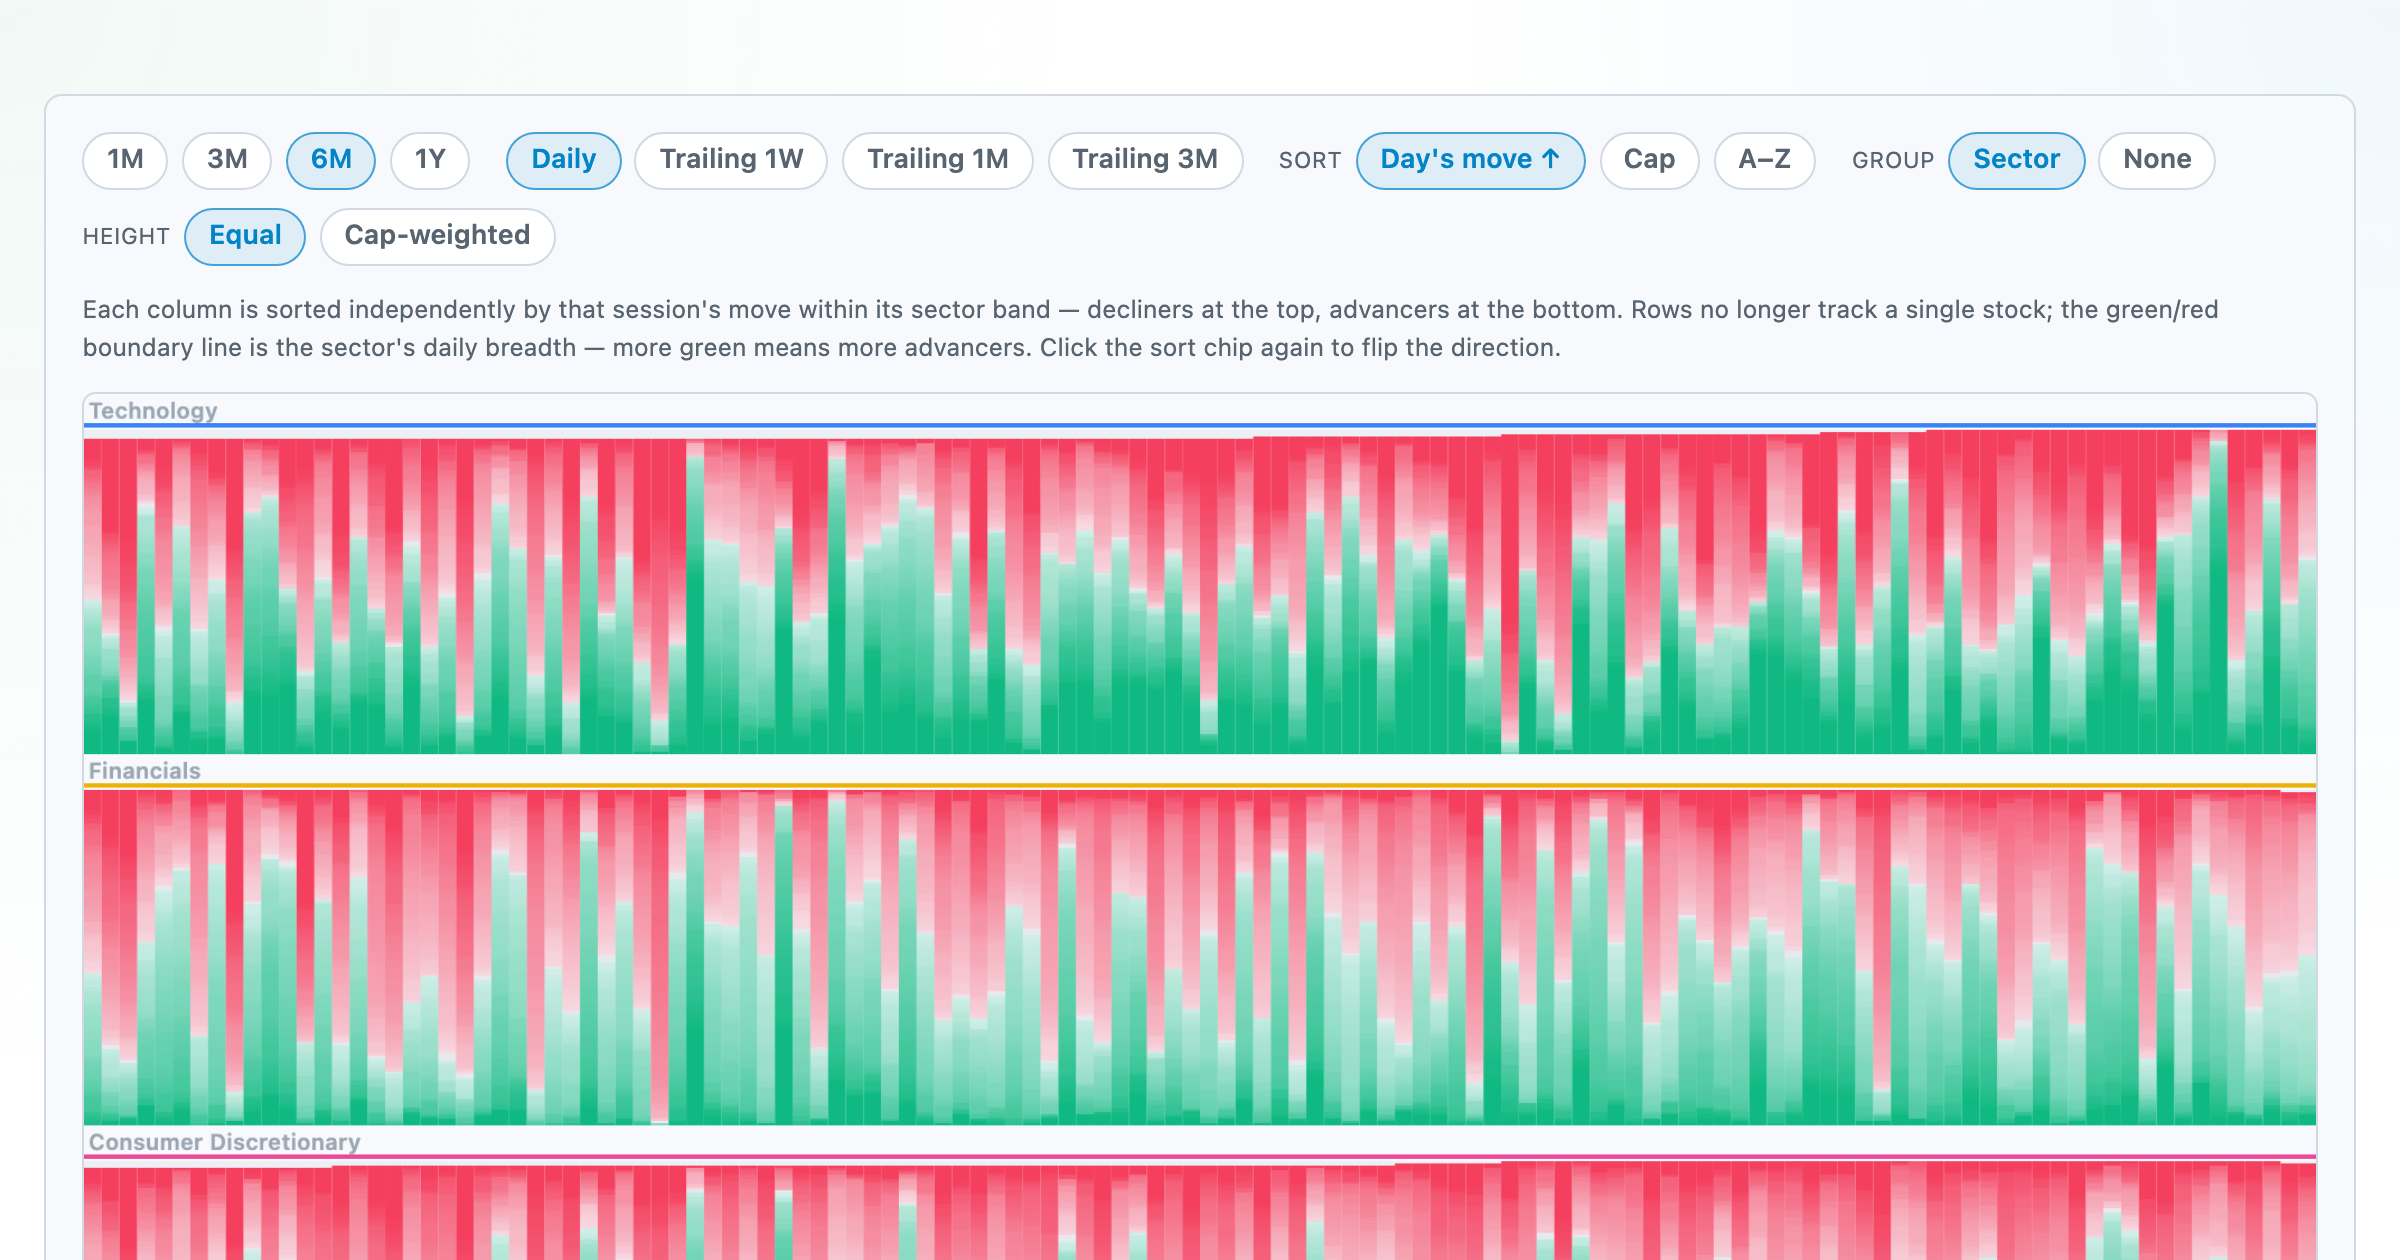
Every stock as a row, every day as a column — market selloffs are vertical stripes, sector routs are blocks.