
Breadth heatmap
Every one of our 953 tracked stocks as a row, every trading day as a column, coloured by return. Bad market days are vertical red stripes; sector trouble shows as red blocks; a stock in trouble is a horizontal band. Group rows by sector, switch rows to market-cap-proportional, or colour by trailing 1M/3M returns to see regimes instead of noise. Part of the market breadth overview.
Each column is sorted independently by that session's move within its sector band — decliners at the top, advancers at the bottom. Rows no longer track a single stock, so the tooltip reports the cell's rank rather than naming it — switch to Cap or A–Z to identify and click through to a stock. The green/red boundary line is the sector's daily breadth. Click the active sort chip again to flip the direction.

Methodology#
Universe: all actively tracked US stocks, dual share classes deduplicated, ordered by market cap within each group. Daily returns use dividend-adjusted closes; trailing modes compound those dailies over 5/21/63 sessions, and a session a stock did not trade compounds as 0% rather than nulling the window around it. Colour saturates at ±4% in this view, so typical moves stay distinguishable; the tooltip marks a saturated cell with "≥". Because the tooltip decodes the colour rather than reading a separate copy of the data, its figures carry the ramp's resolution — about 0.04 percentage points. Data is end-of-day. Not investment advice.
FAQ#
- How do I read this chart?
- Each row is one stock, each column one trading session, and the cell color is that stock's return — green up, red down, brighter = bigger move. A vertical red stripe means nearly everything fell that day (a market-wide event); a red rectangle confined to one sector band means the trouble was sector-specific; a persistent horizontal red band is a single stock in a downtrend.
- What do the trailing 1W / 1M / 3M modes show?
- Instead of a single day's move, each cell shows the compounded return over the trailing 5, 21 or 63 sessions ending that day. Trailing windows smooth daily noise and reveal regime stretches — a market where most rows glow red in trailing-1M mode has broad, persistent weakness even if individual days look mixed.
- Why is the chart an image?
- Because that is what it is. At roughly 236,000 cells the grid is a raster, so the server encodes it as a PNG — one pixel per cell — and your browser scales it. The picture is finished before any JavaScript runs, and nothing has to download the underlying returns. The tooltip reads each cell's return back out of the pixel you are pointing at, so the number quoted and the colour shown can never disagree.
More visualizations
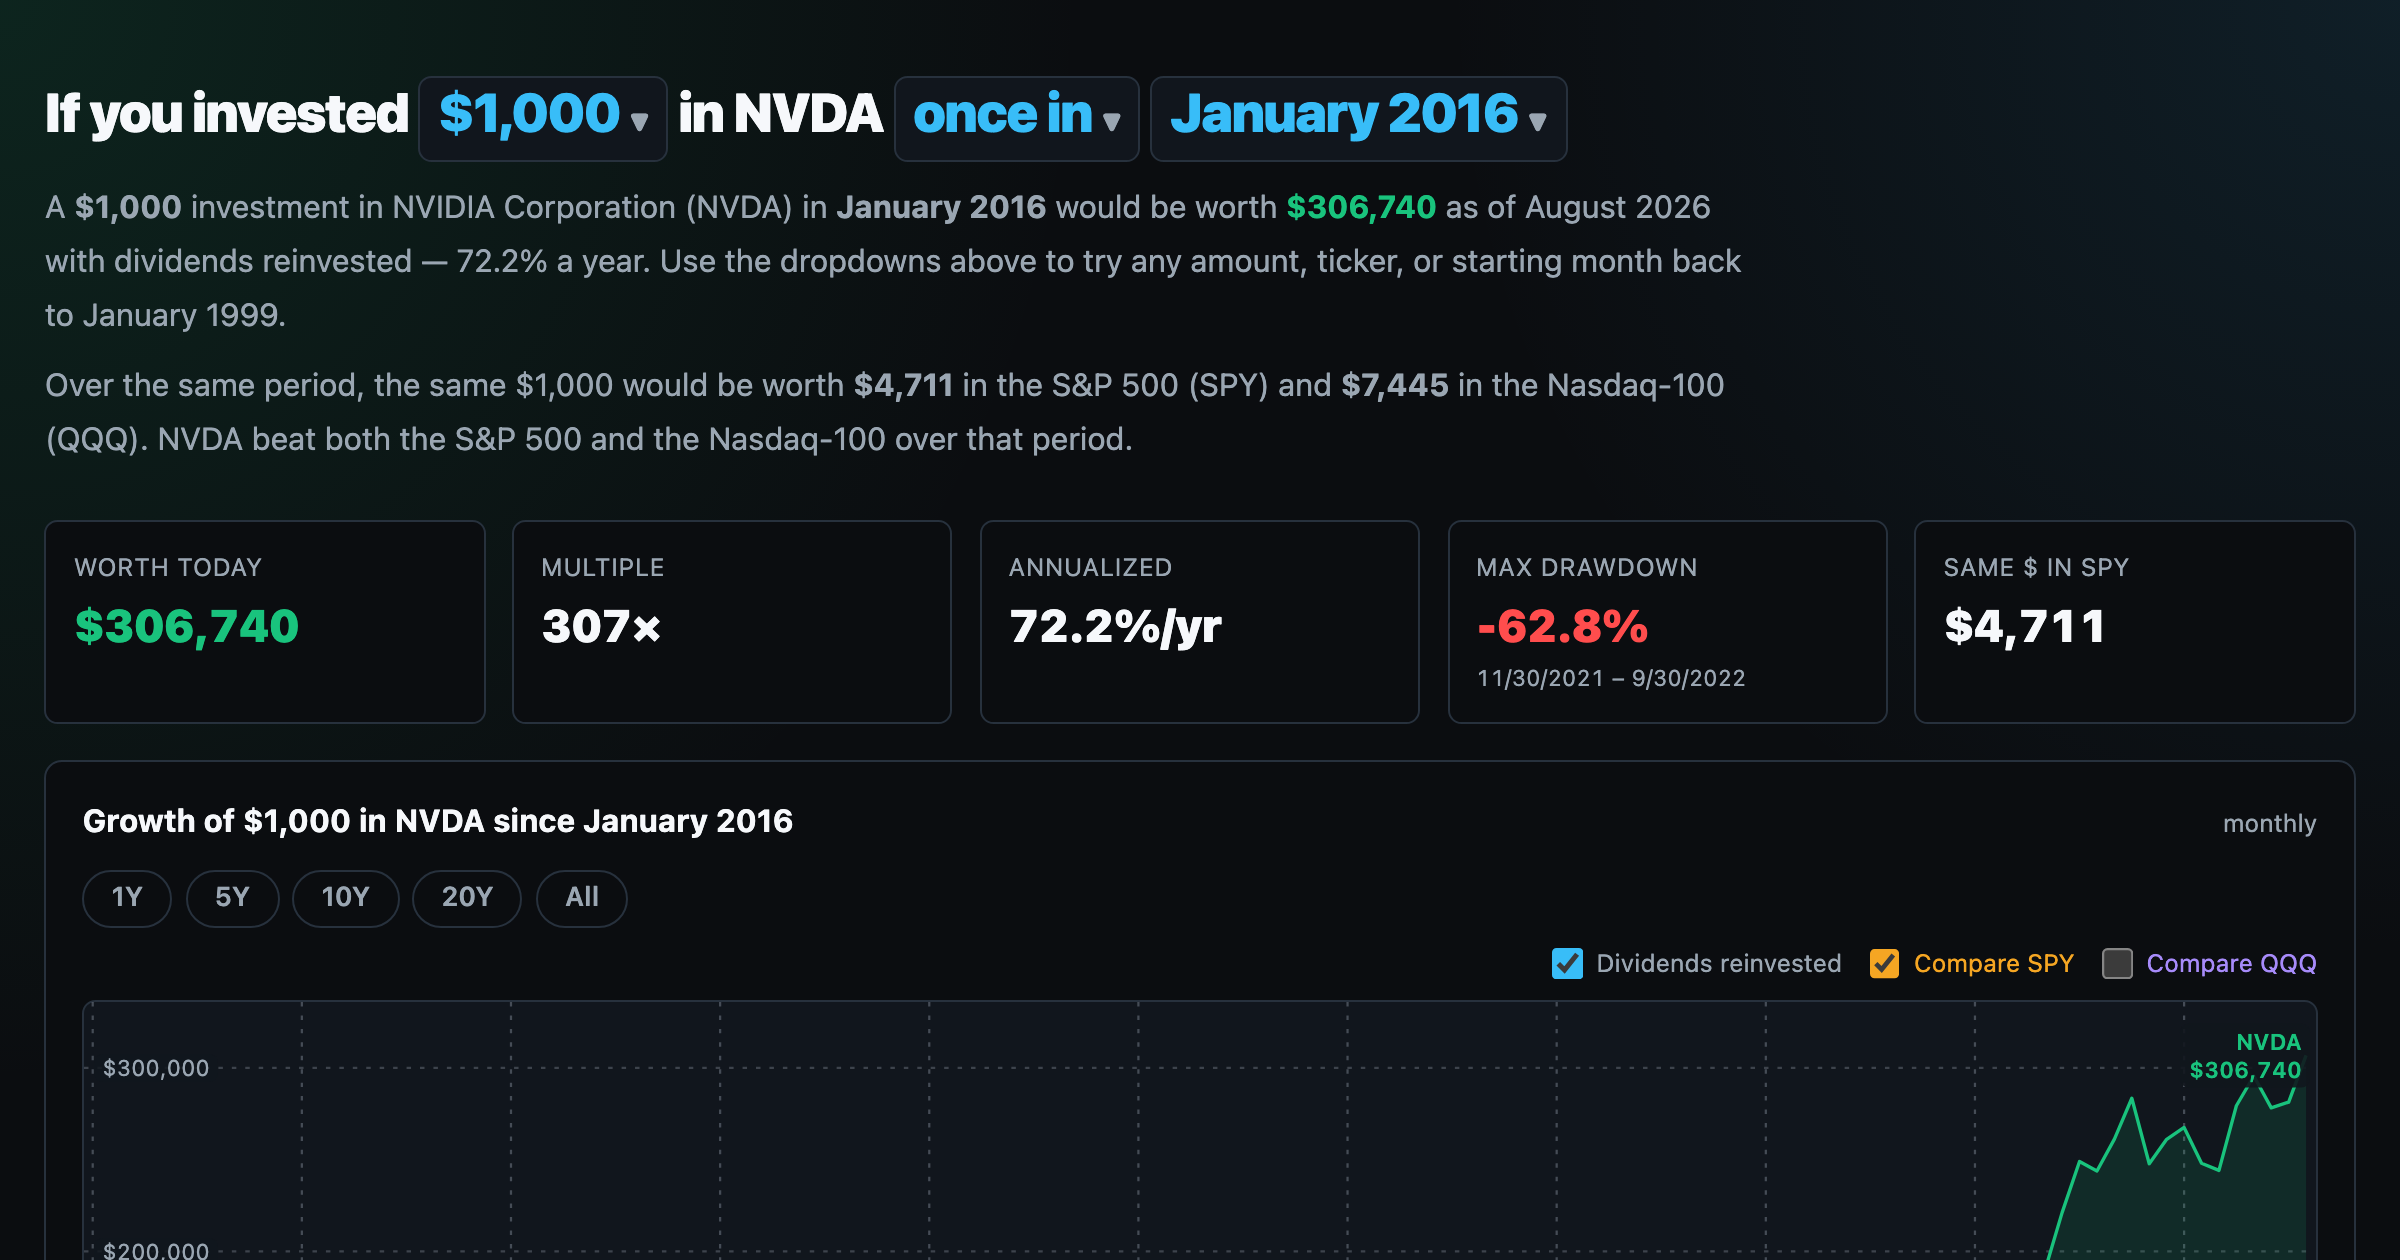
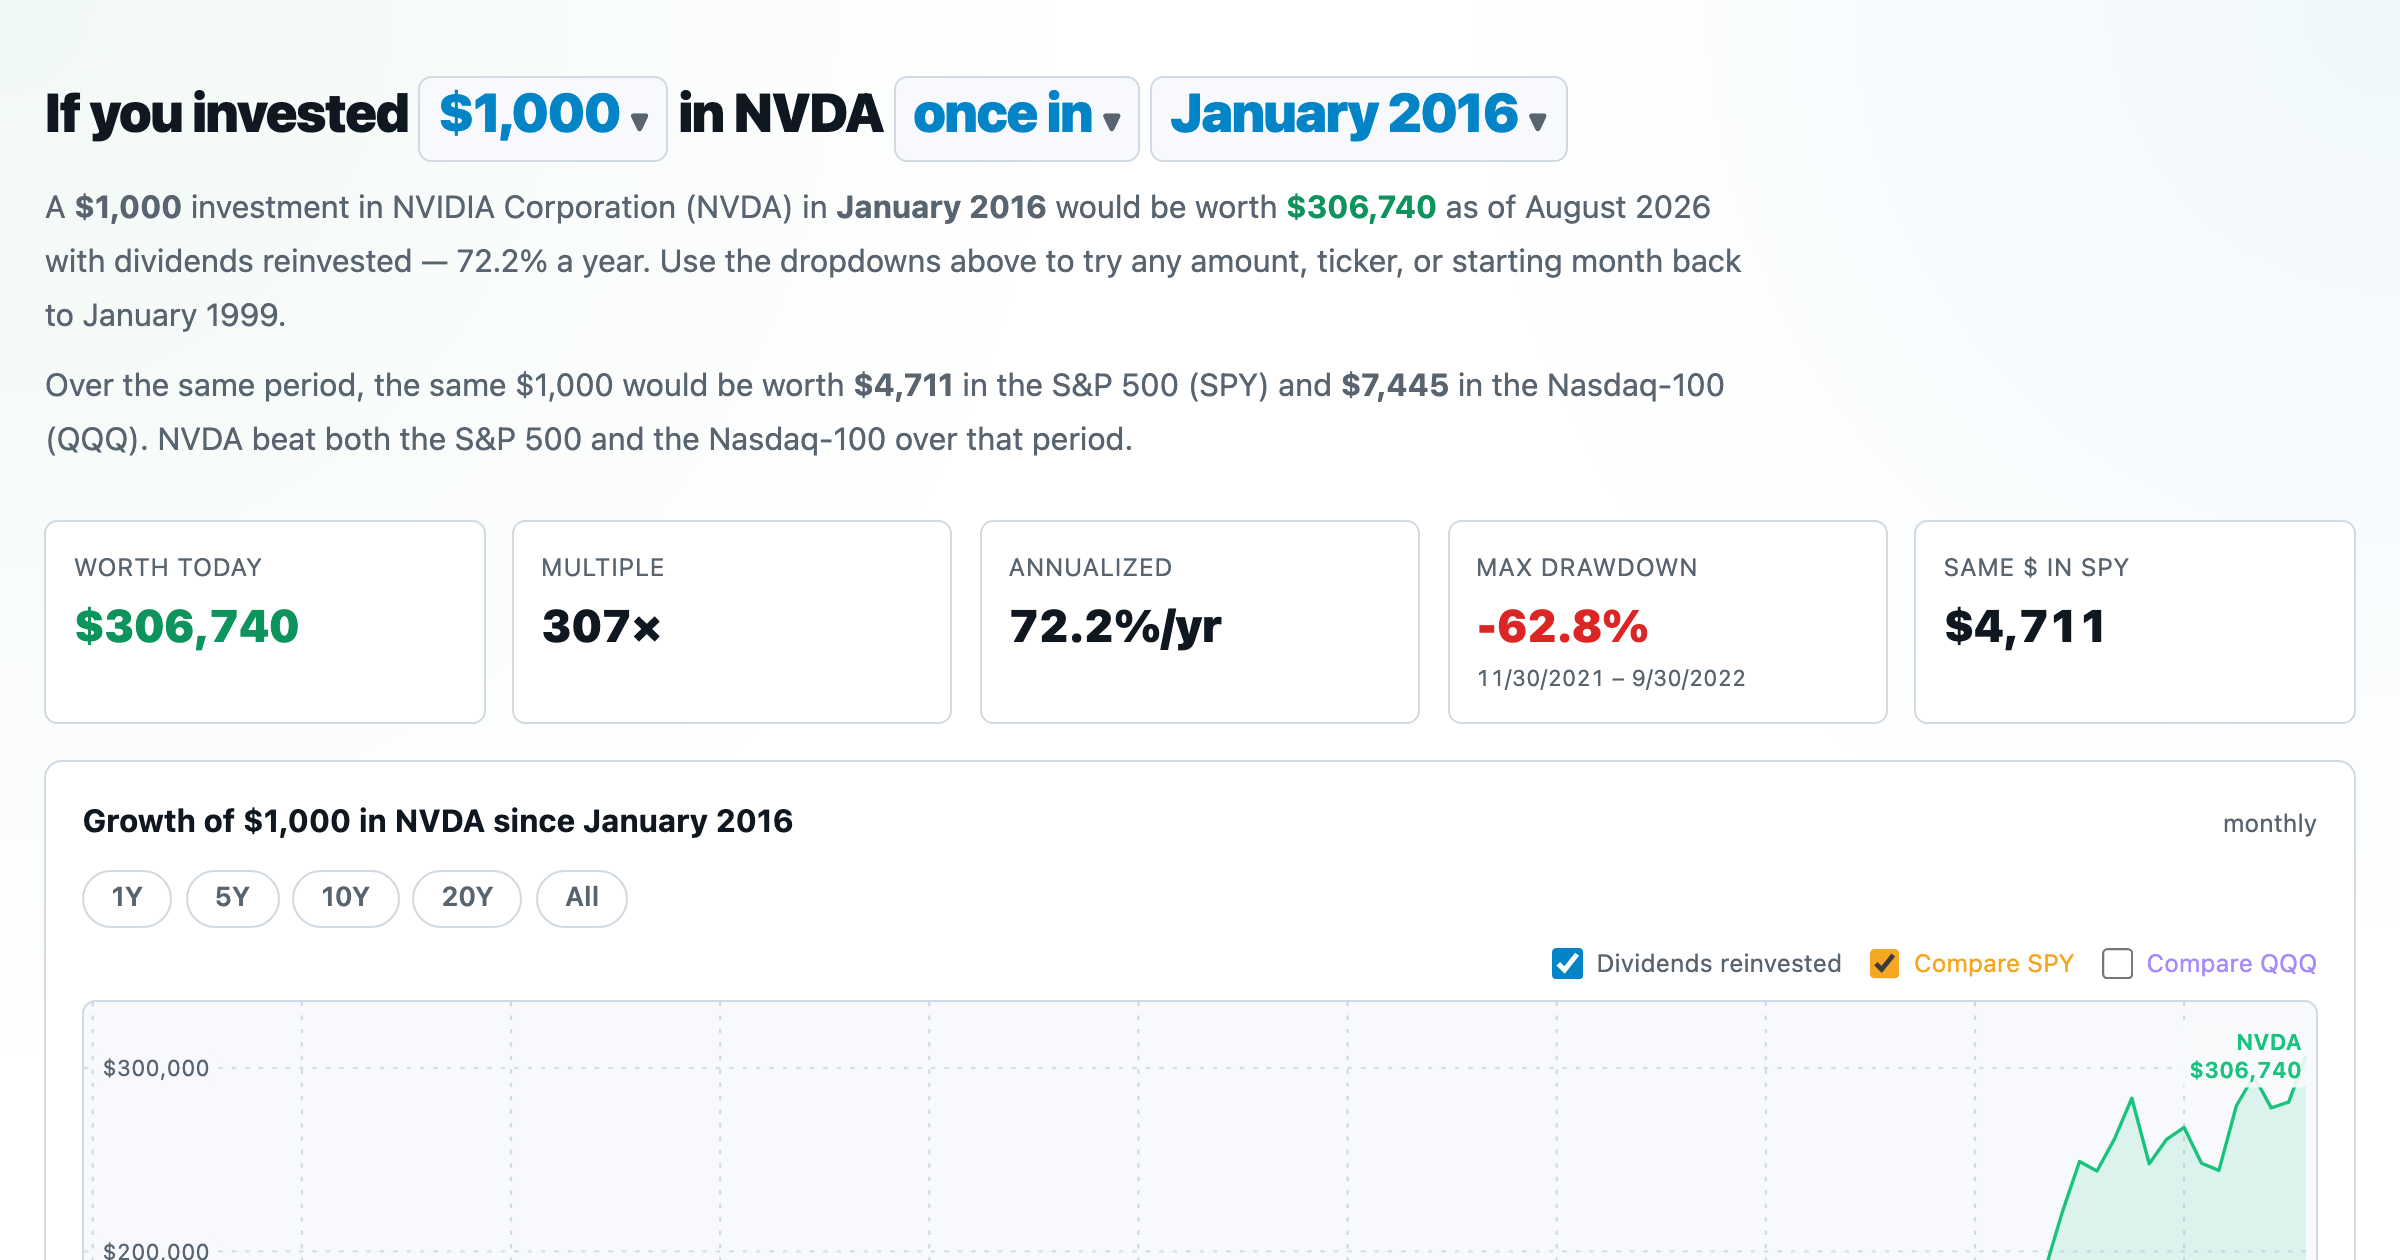
What $1,000 in any stock or ETF would be worth today.
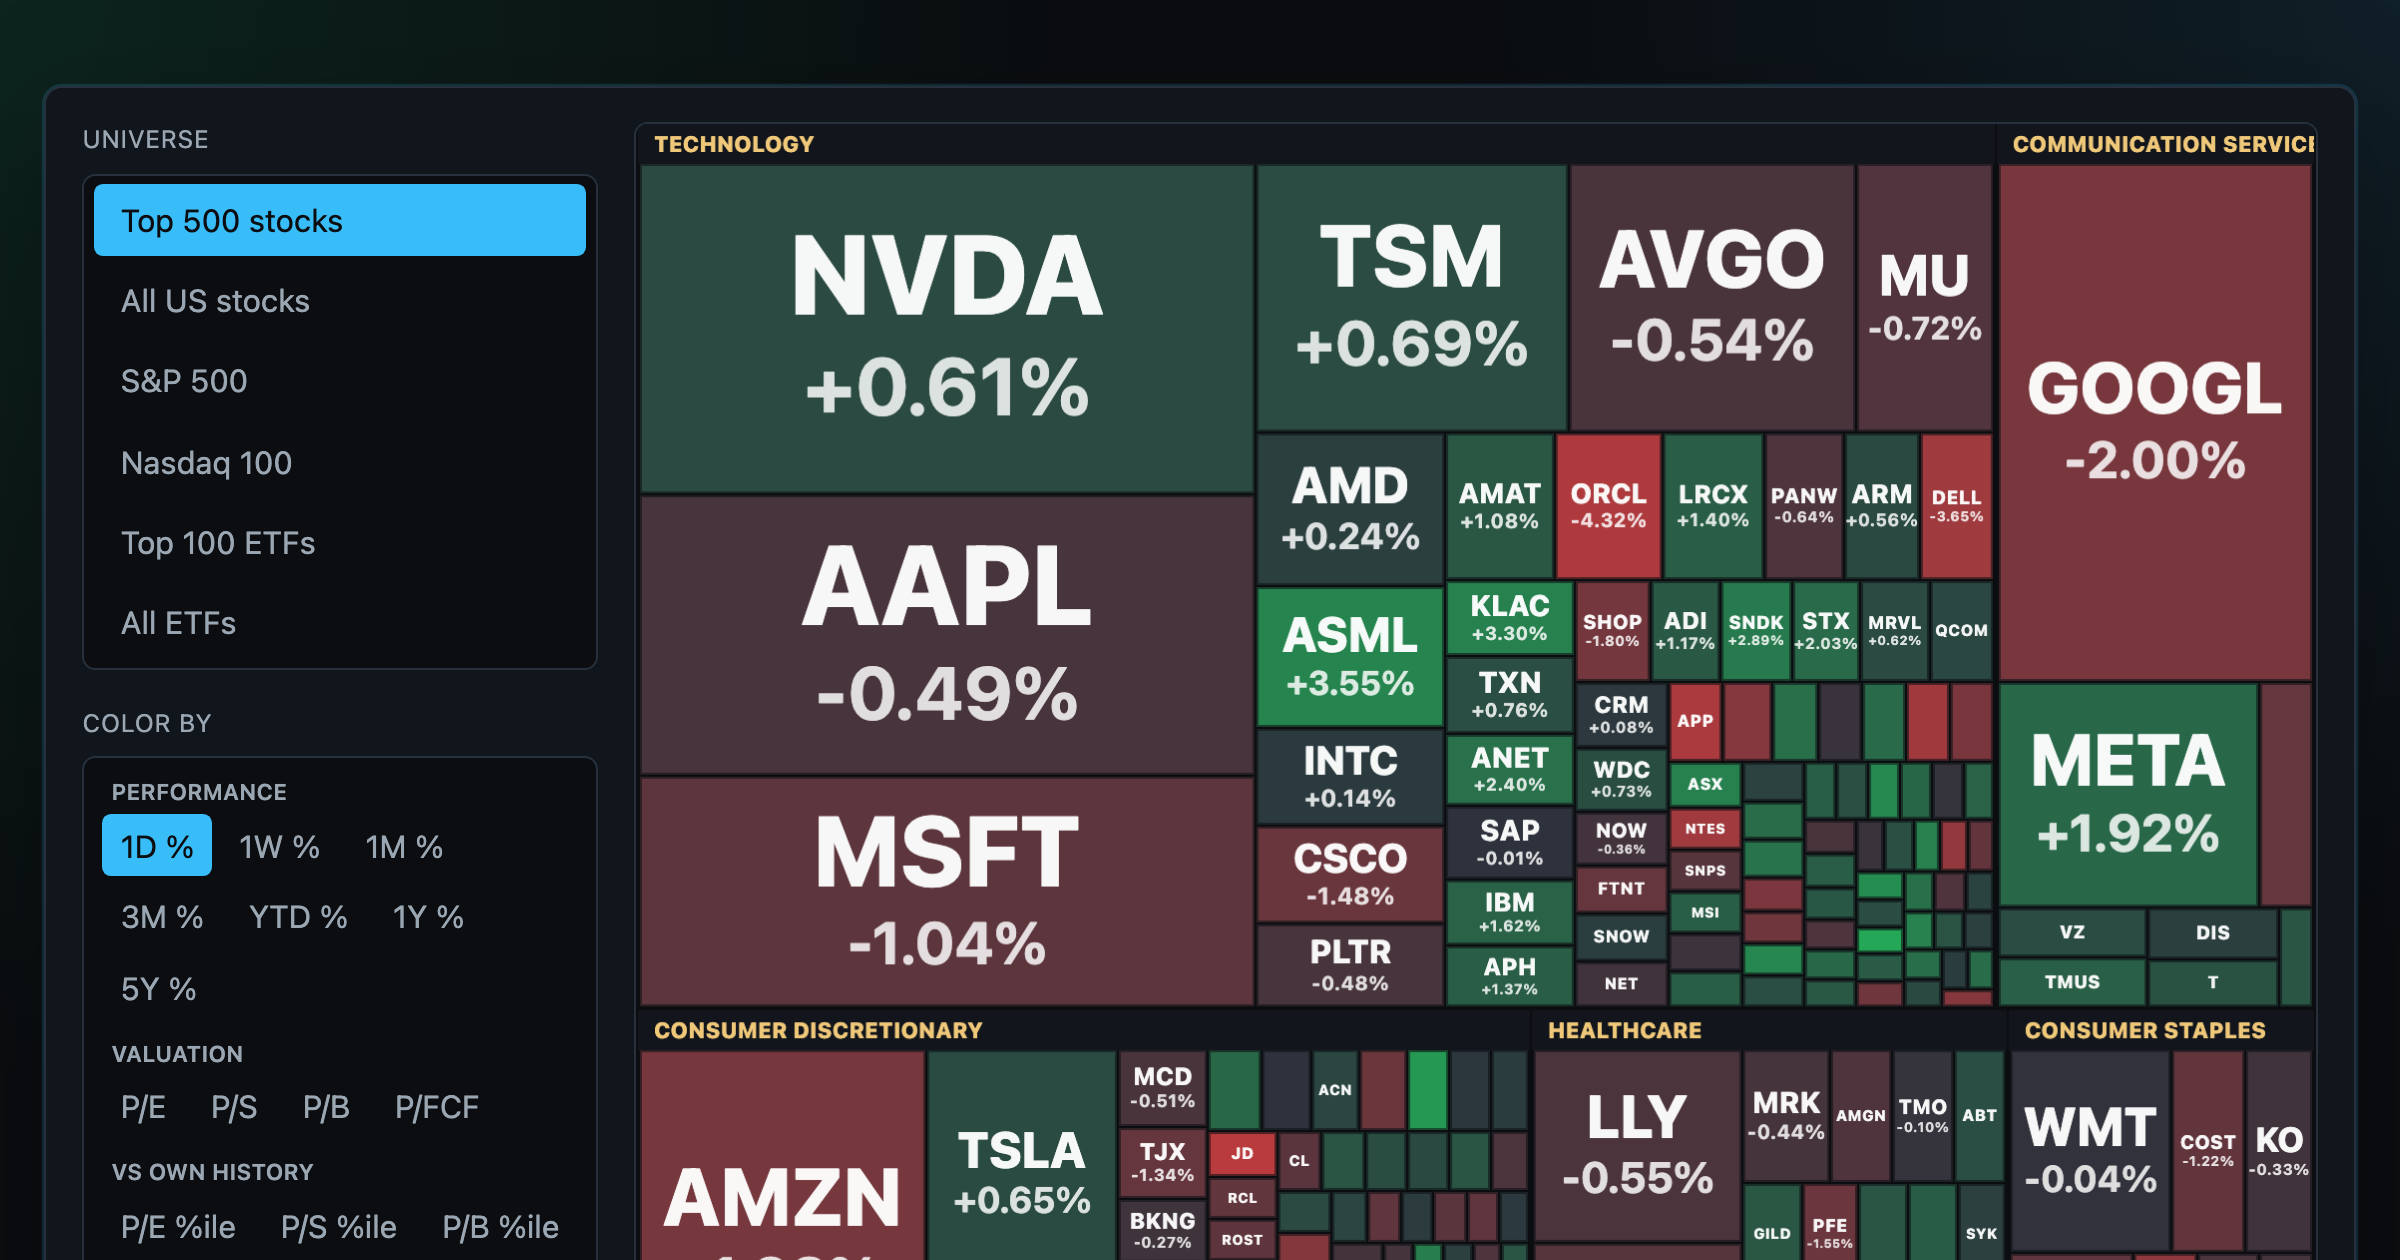
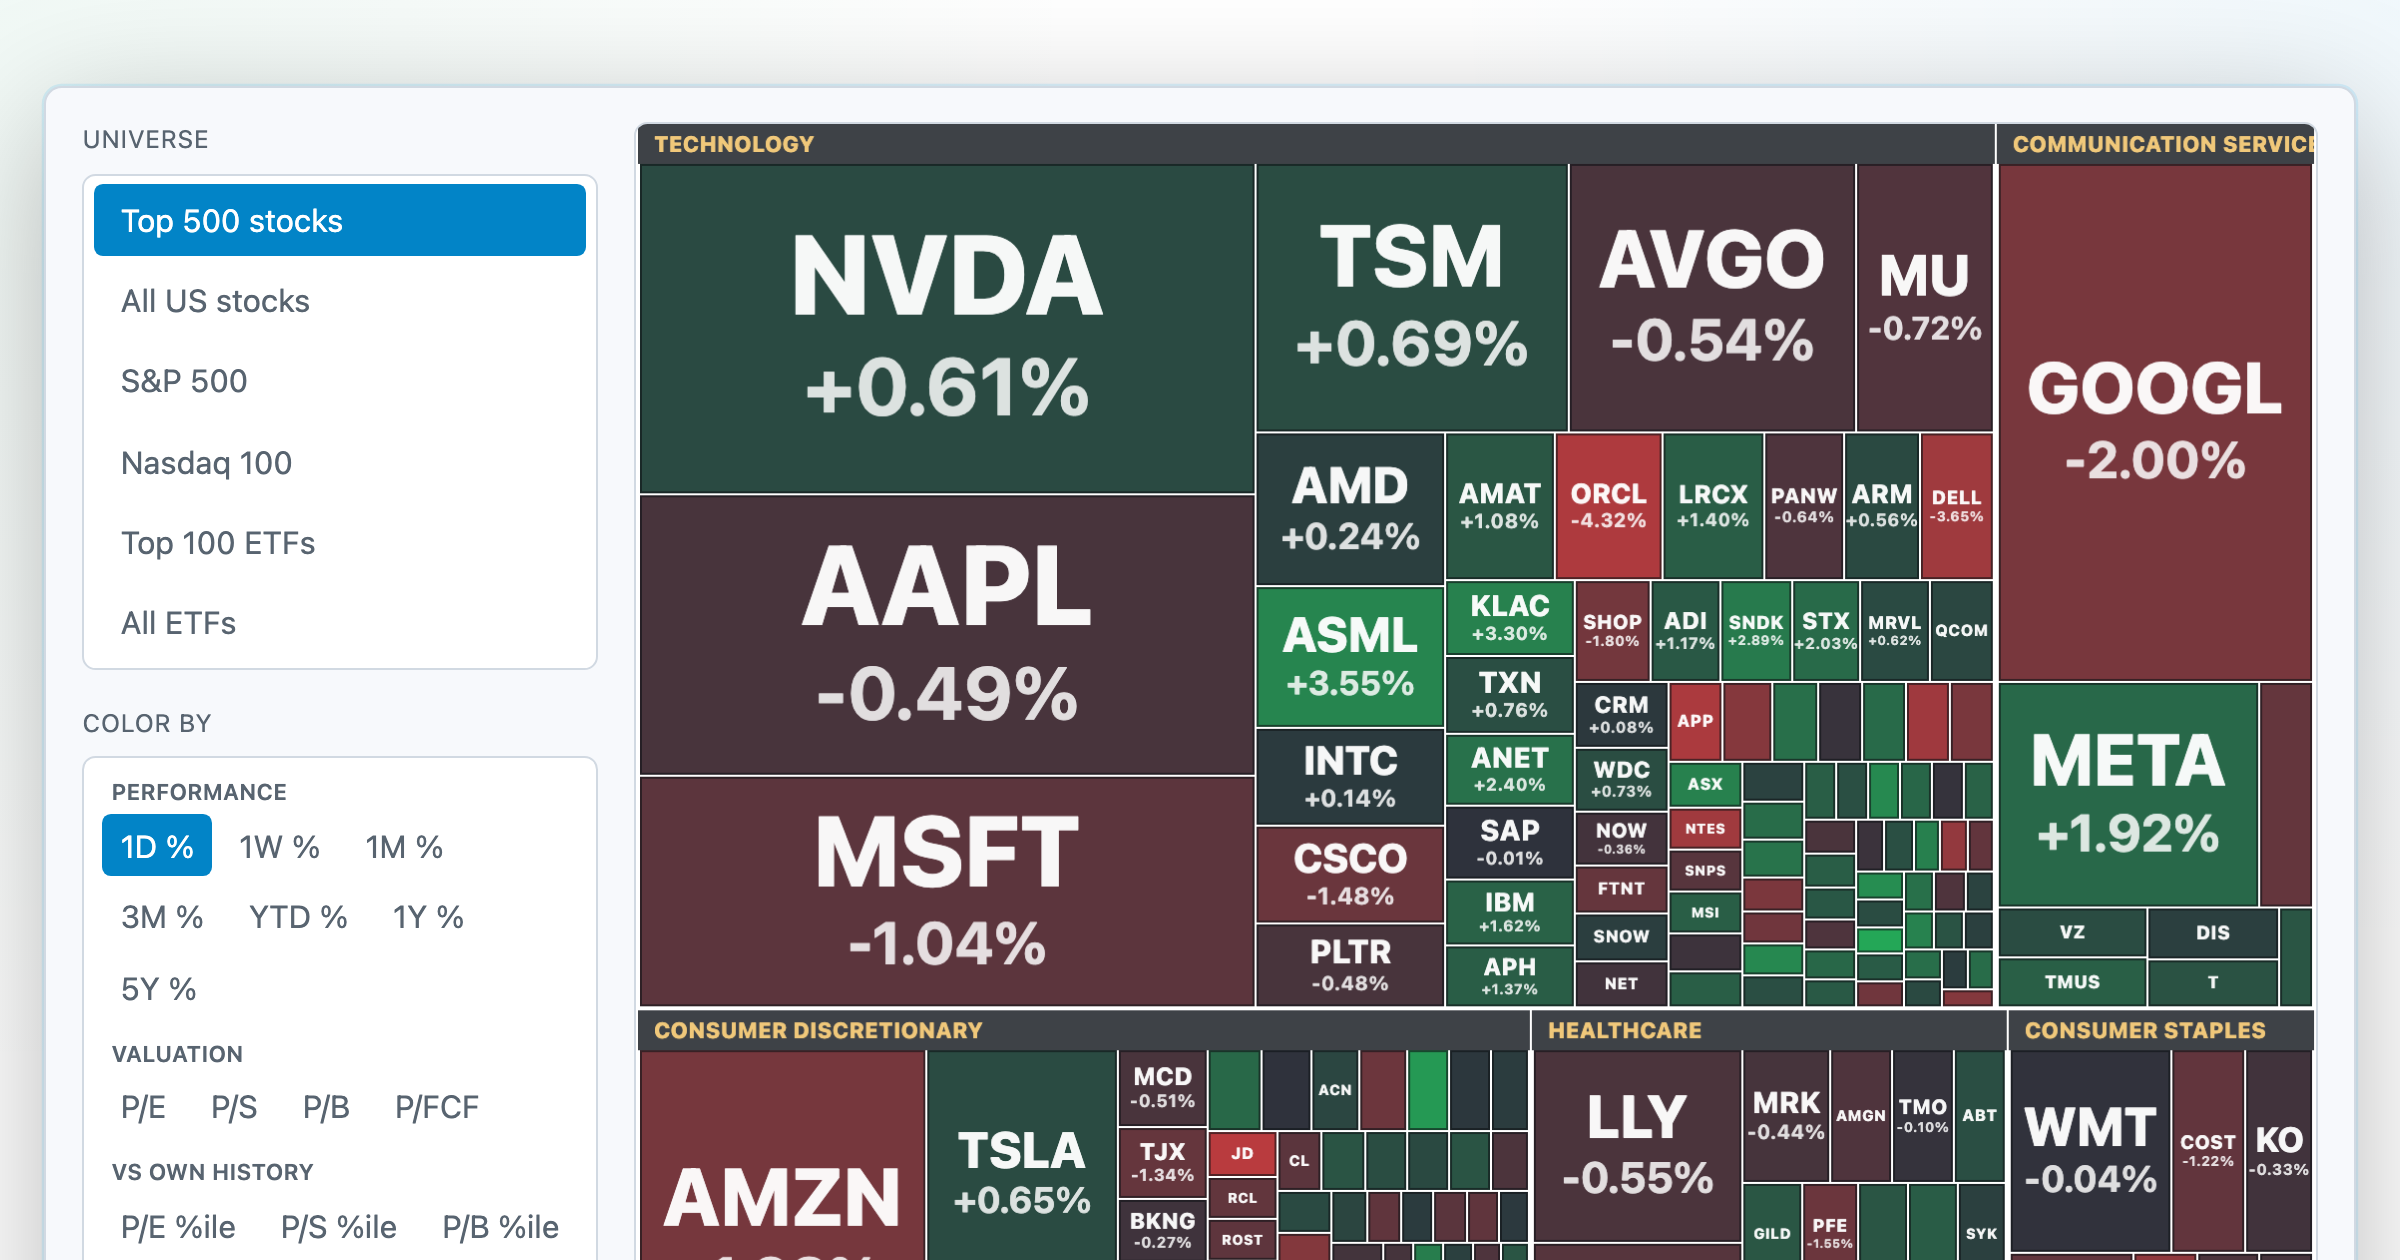
Every S&P 500 company sized by market cap — color by return or valuation.
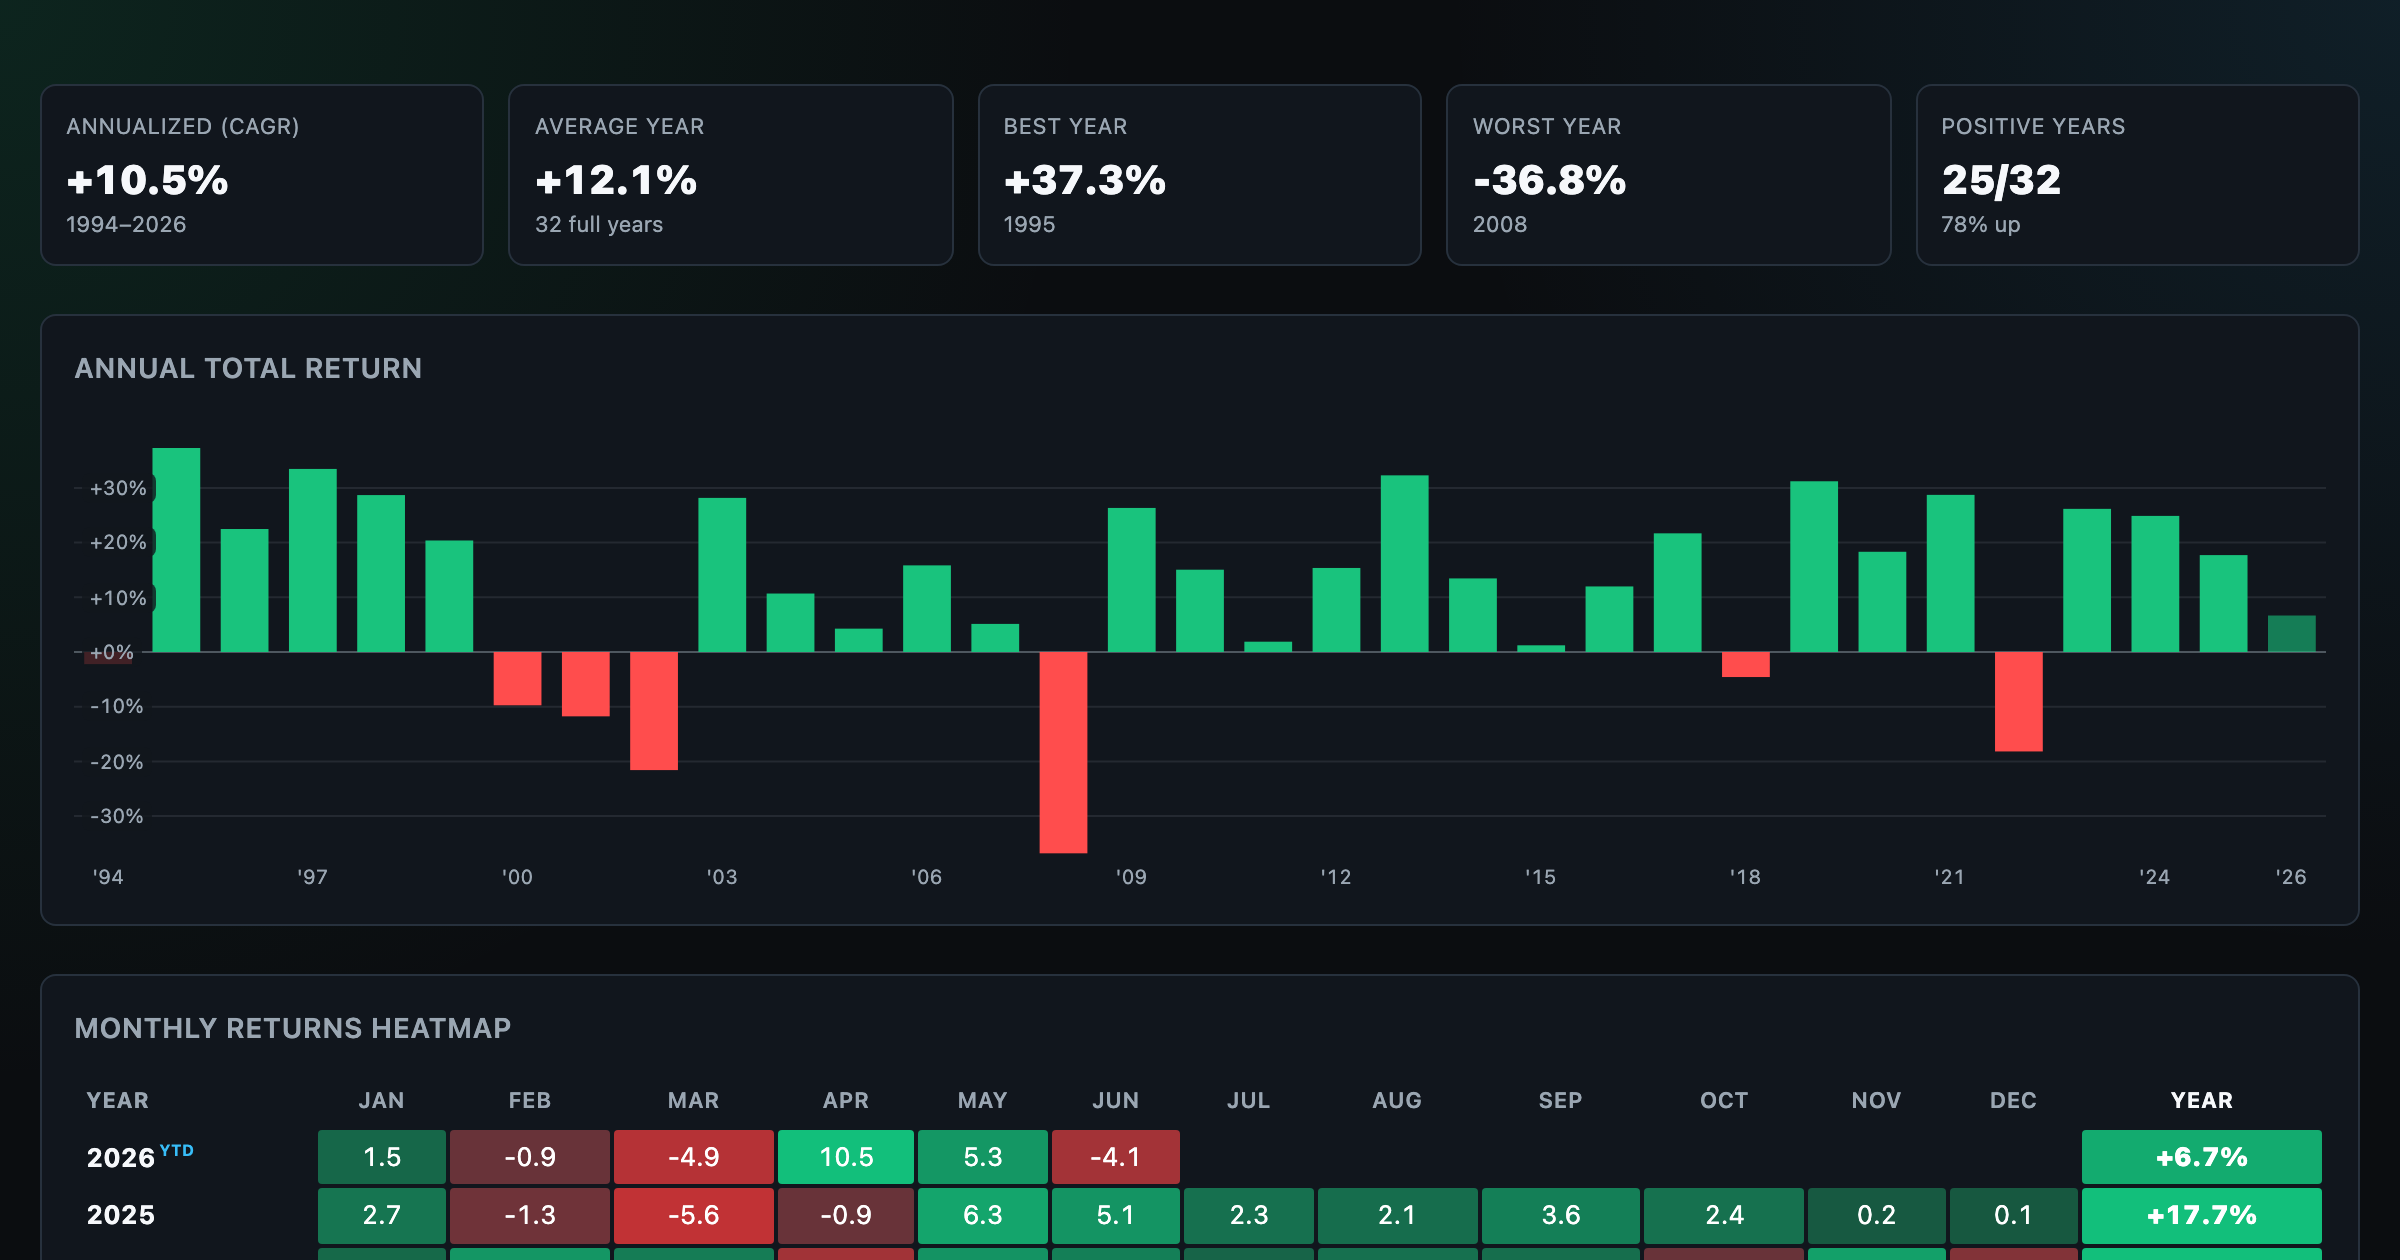
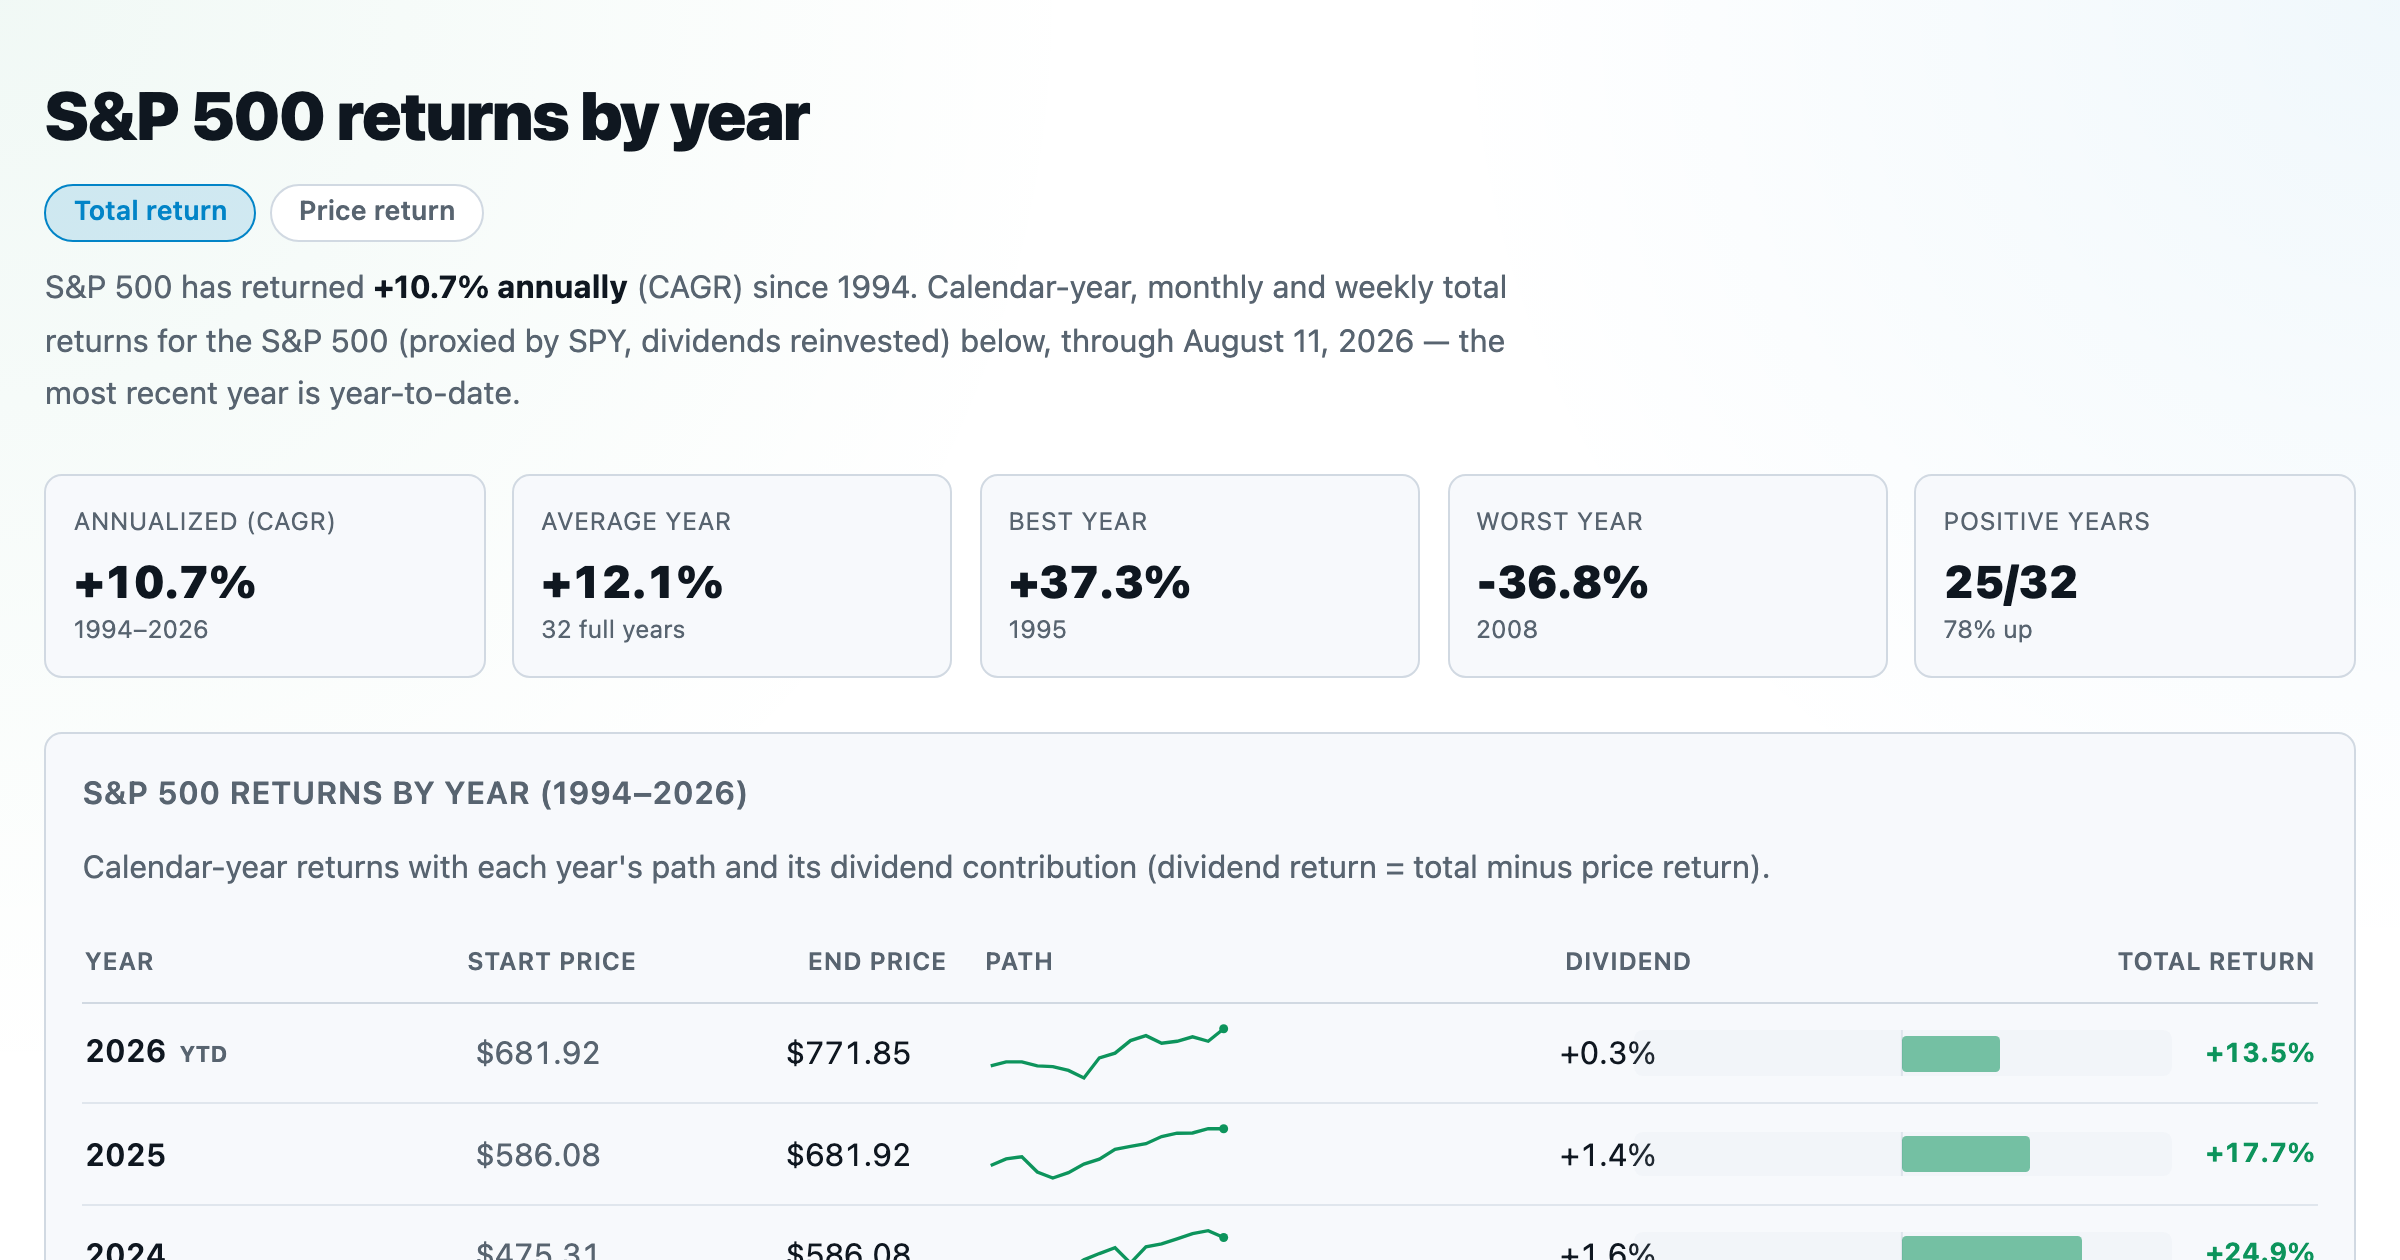
S&P 500 returns by year, month, week and trailing period — total or price return.
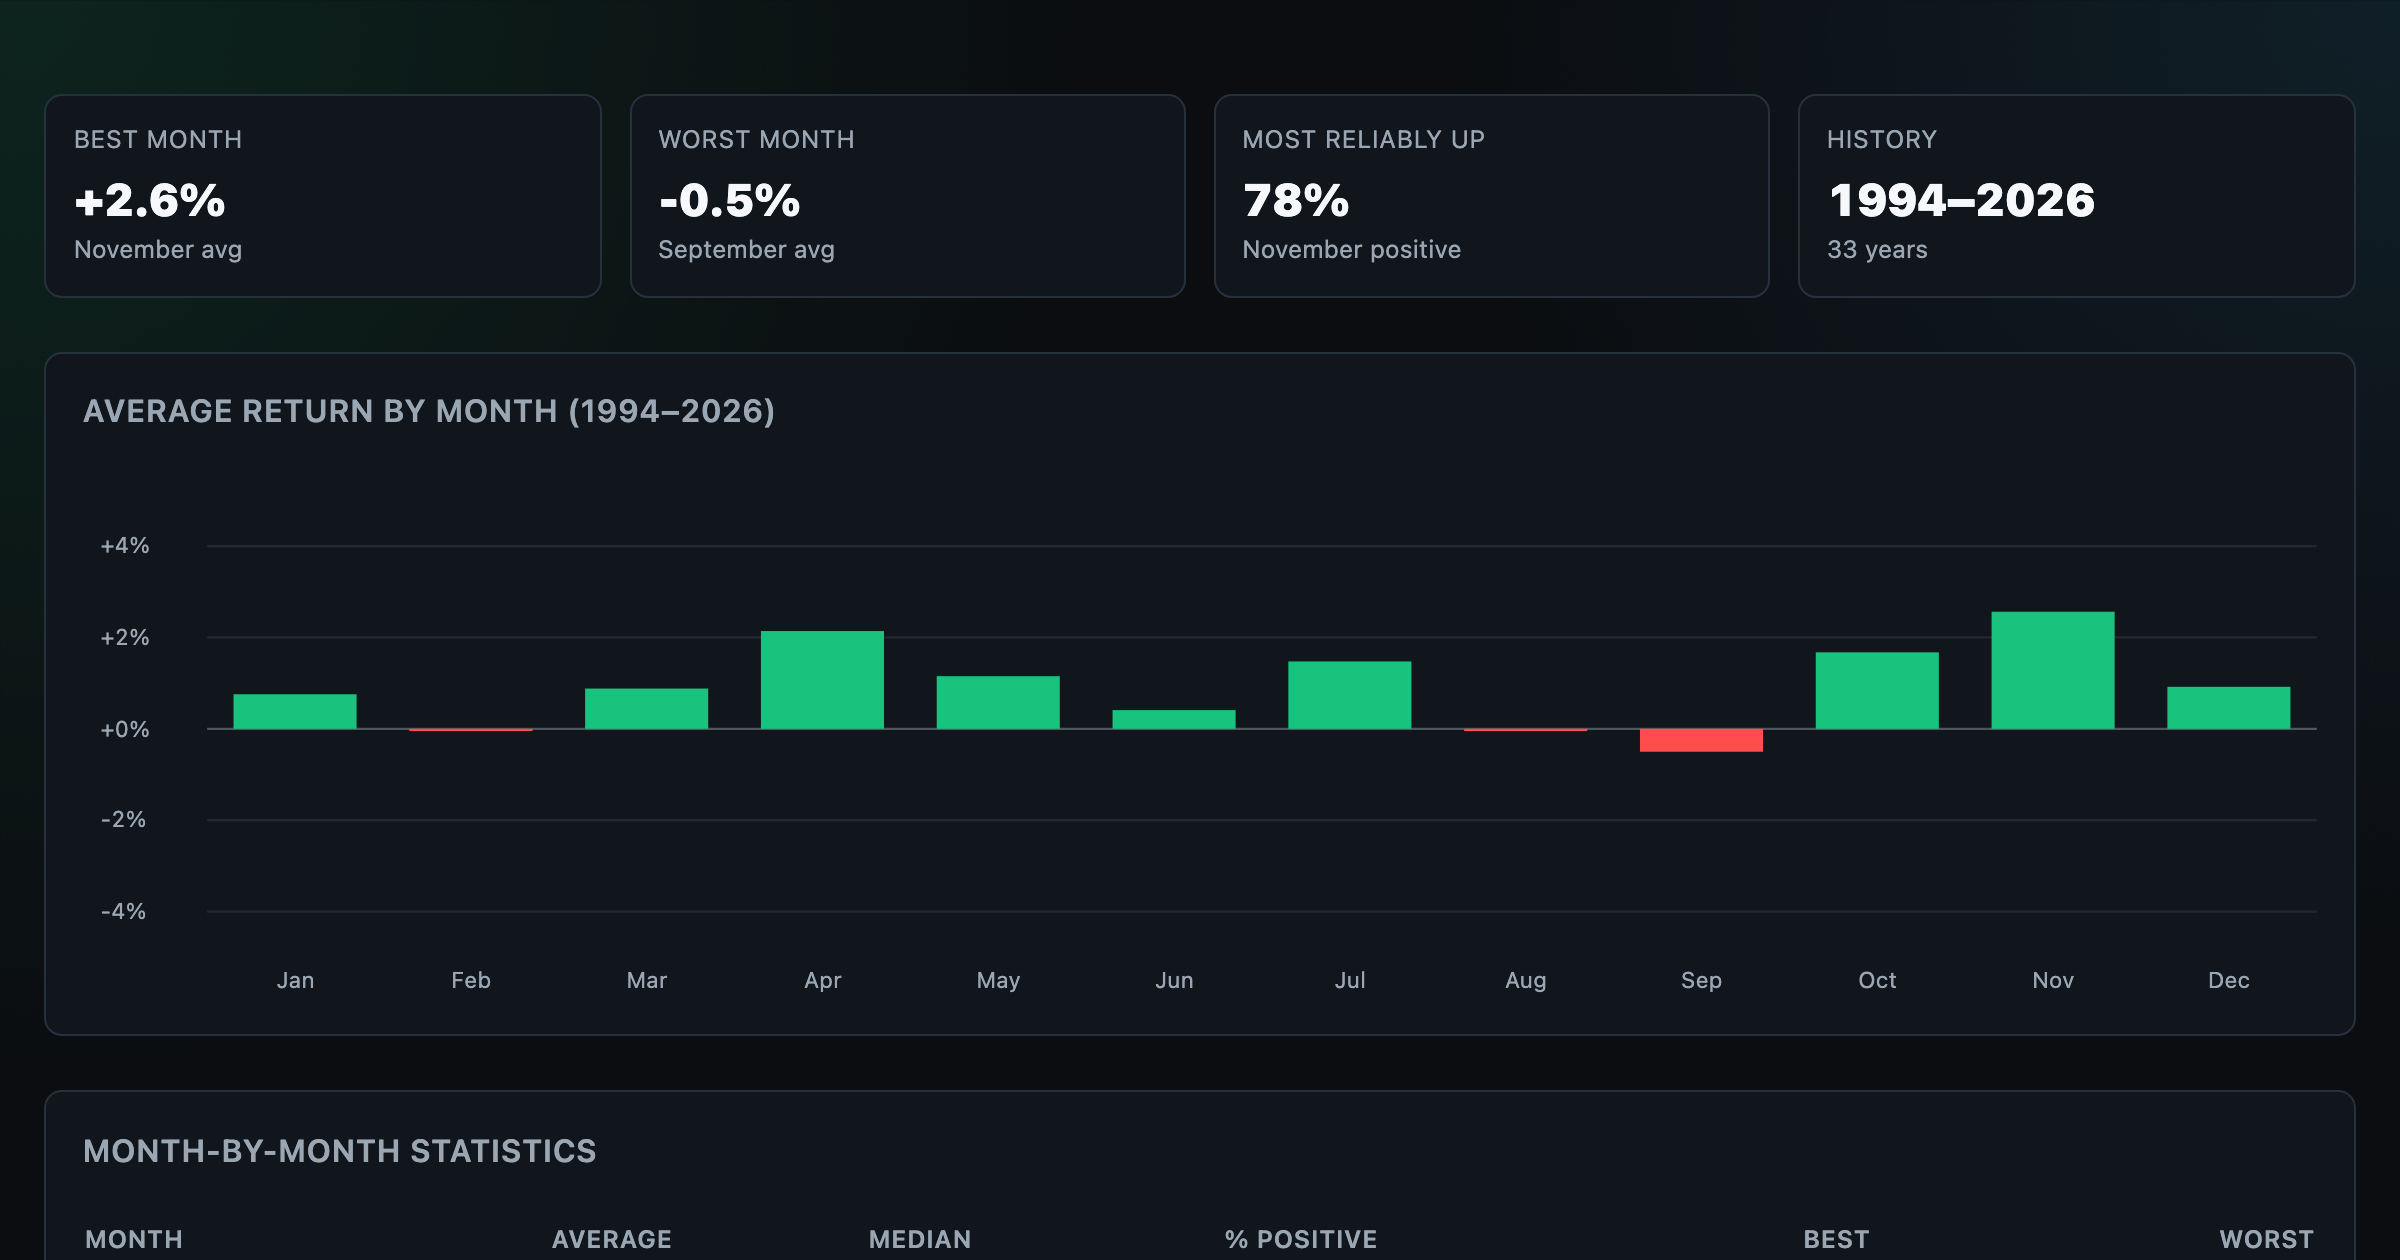
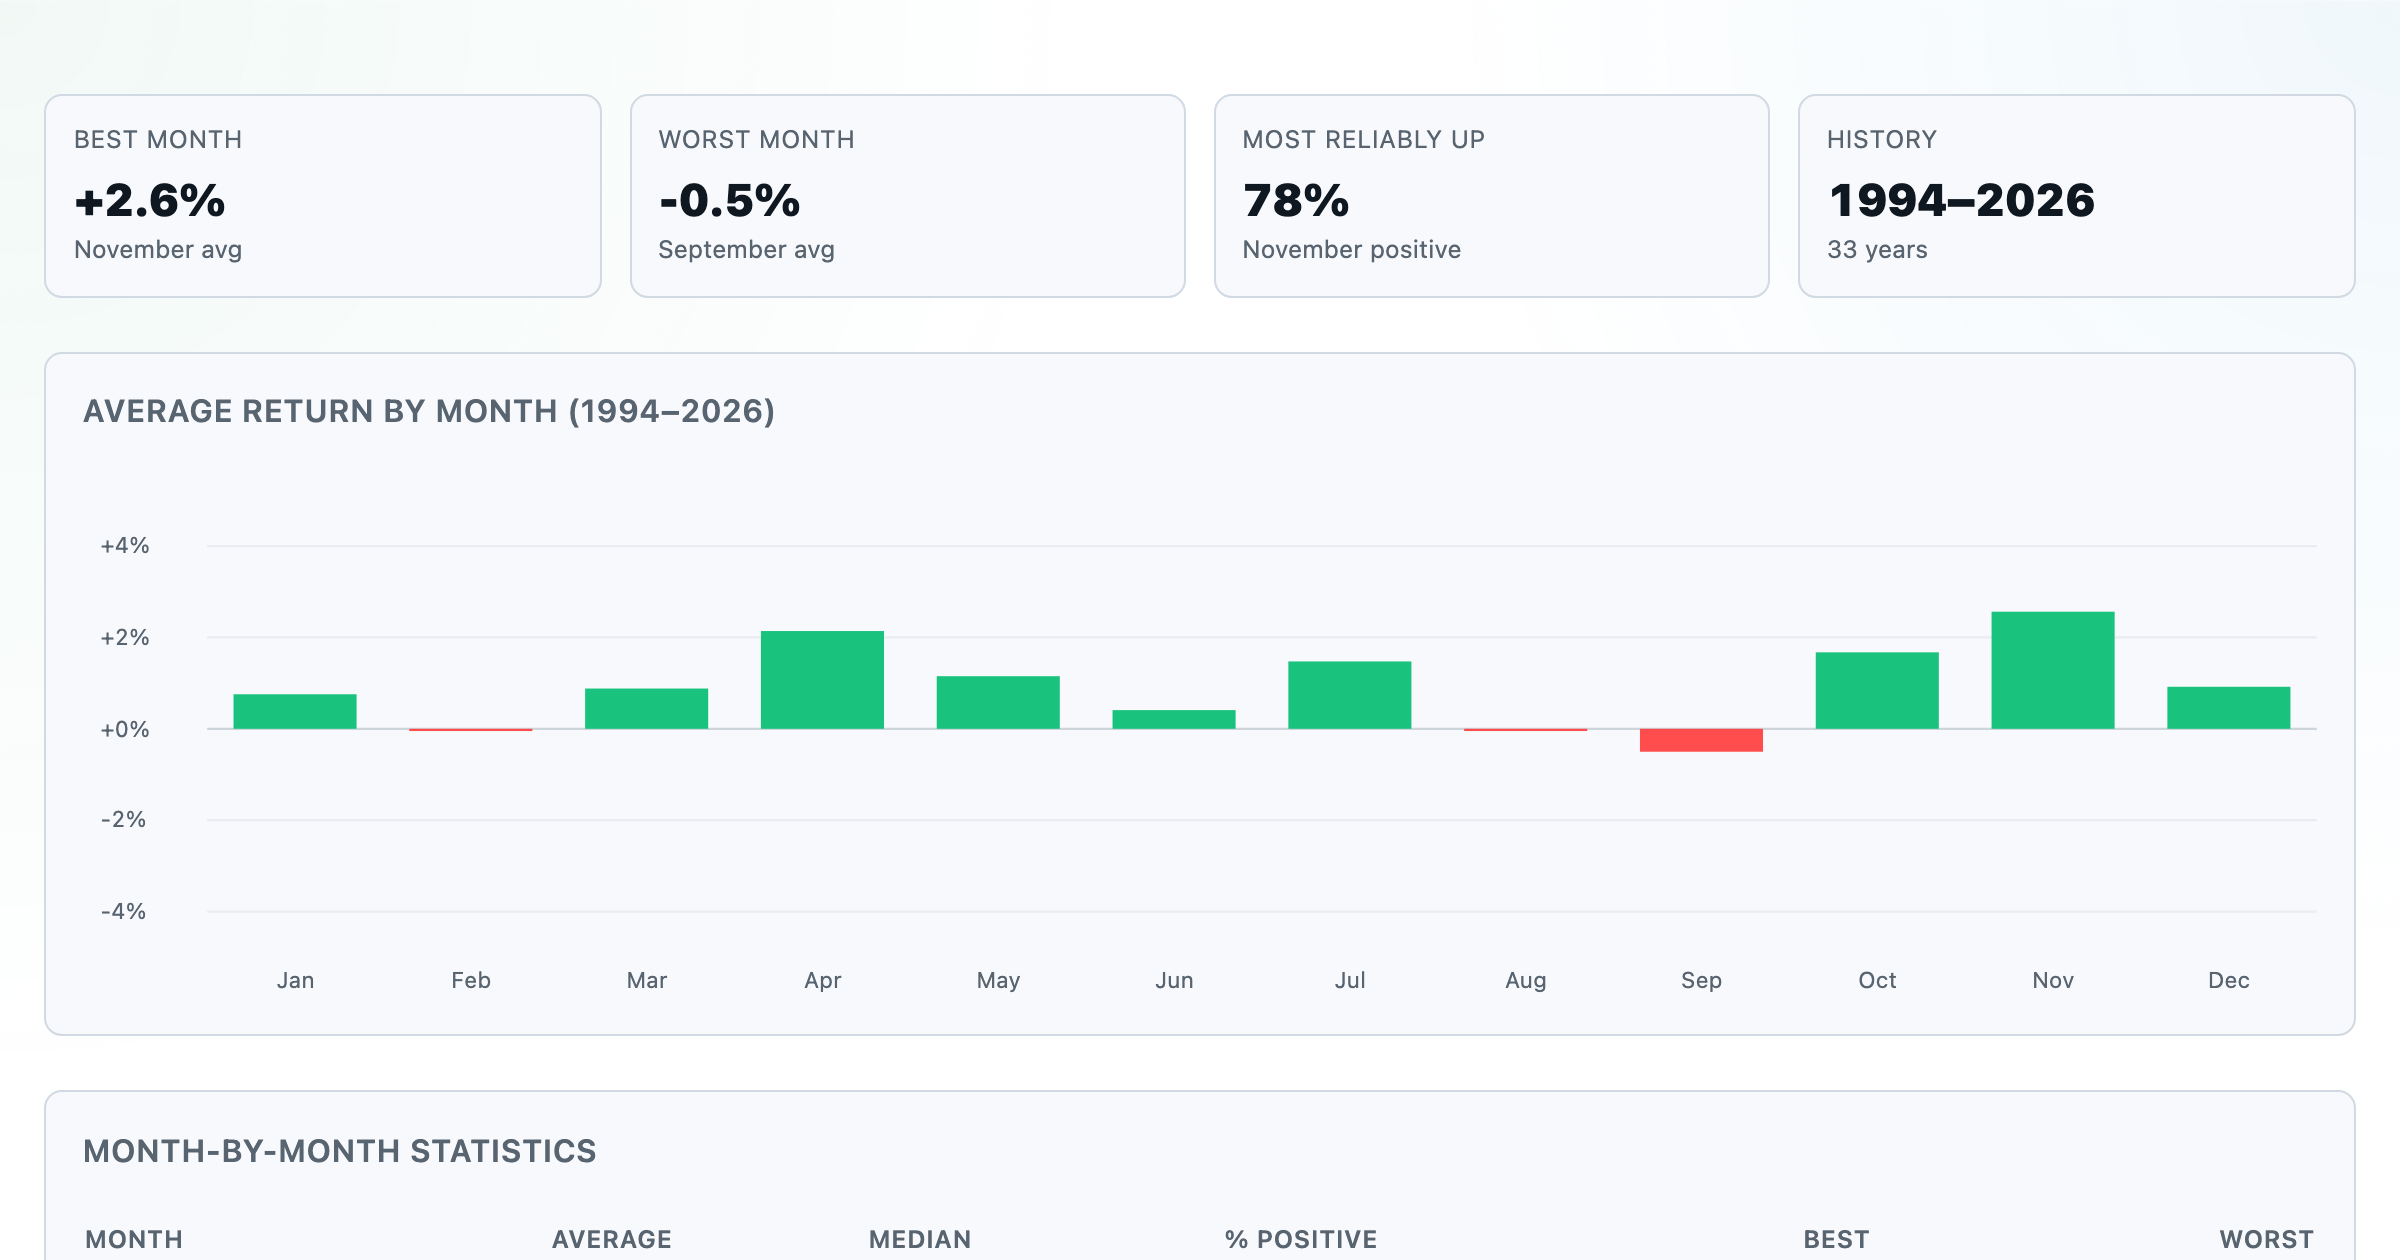
Which month is best for stocks? Average return of every calendar month, for any ticker.
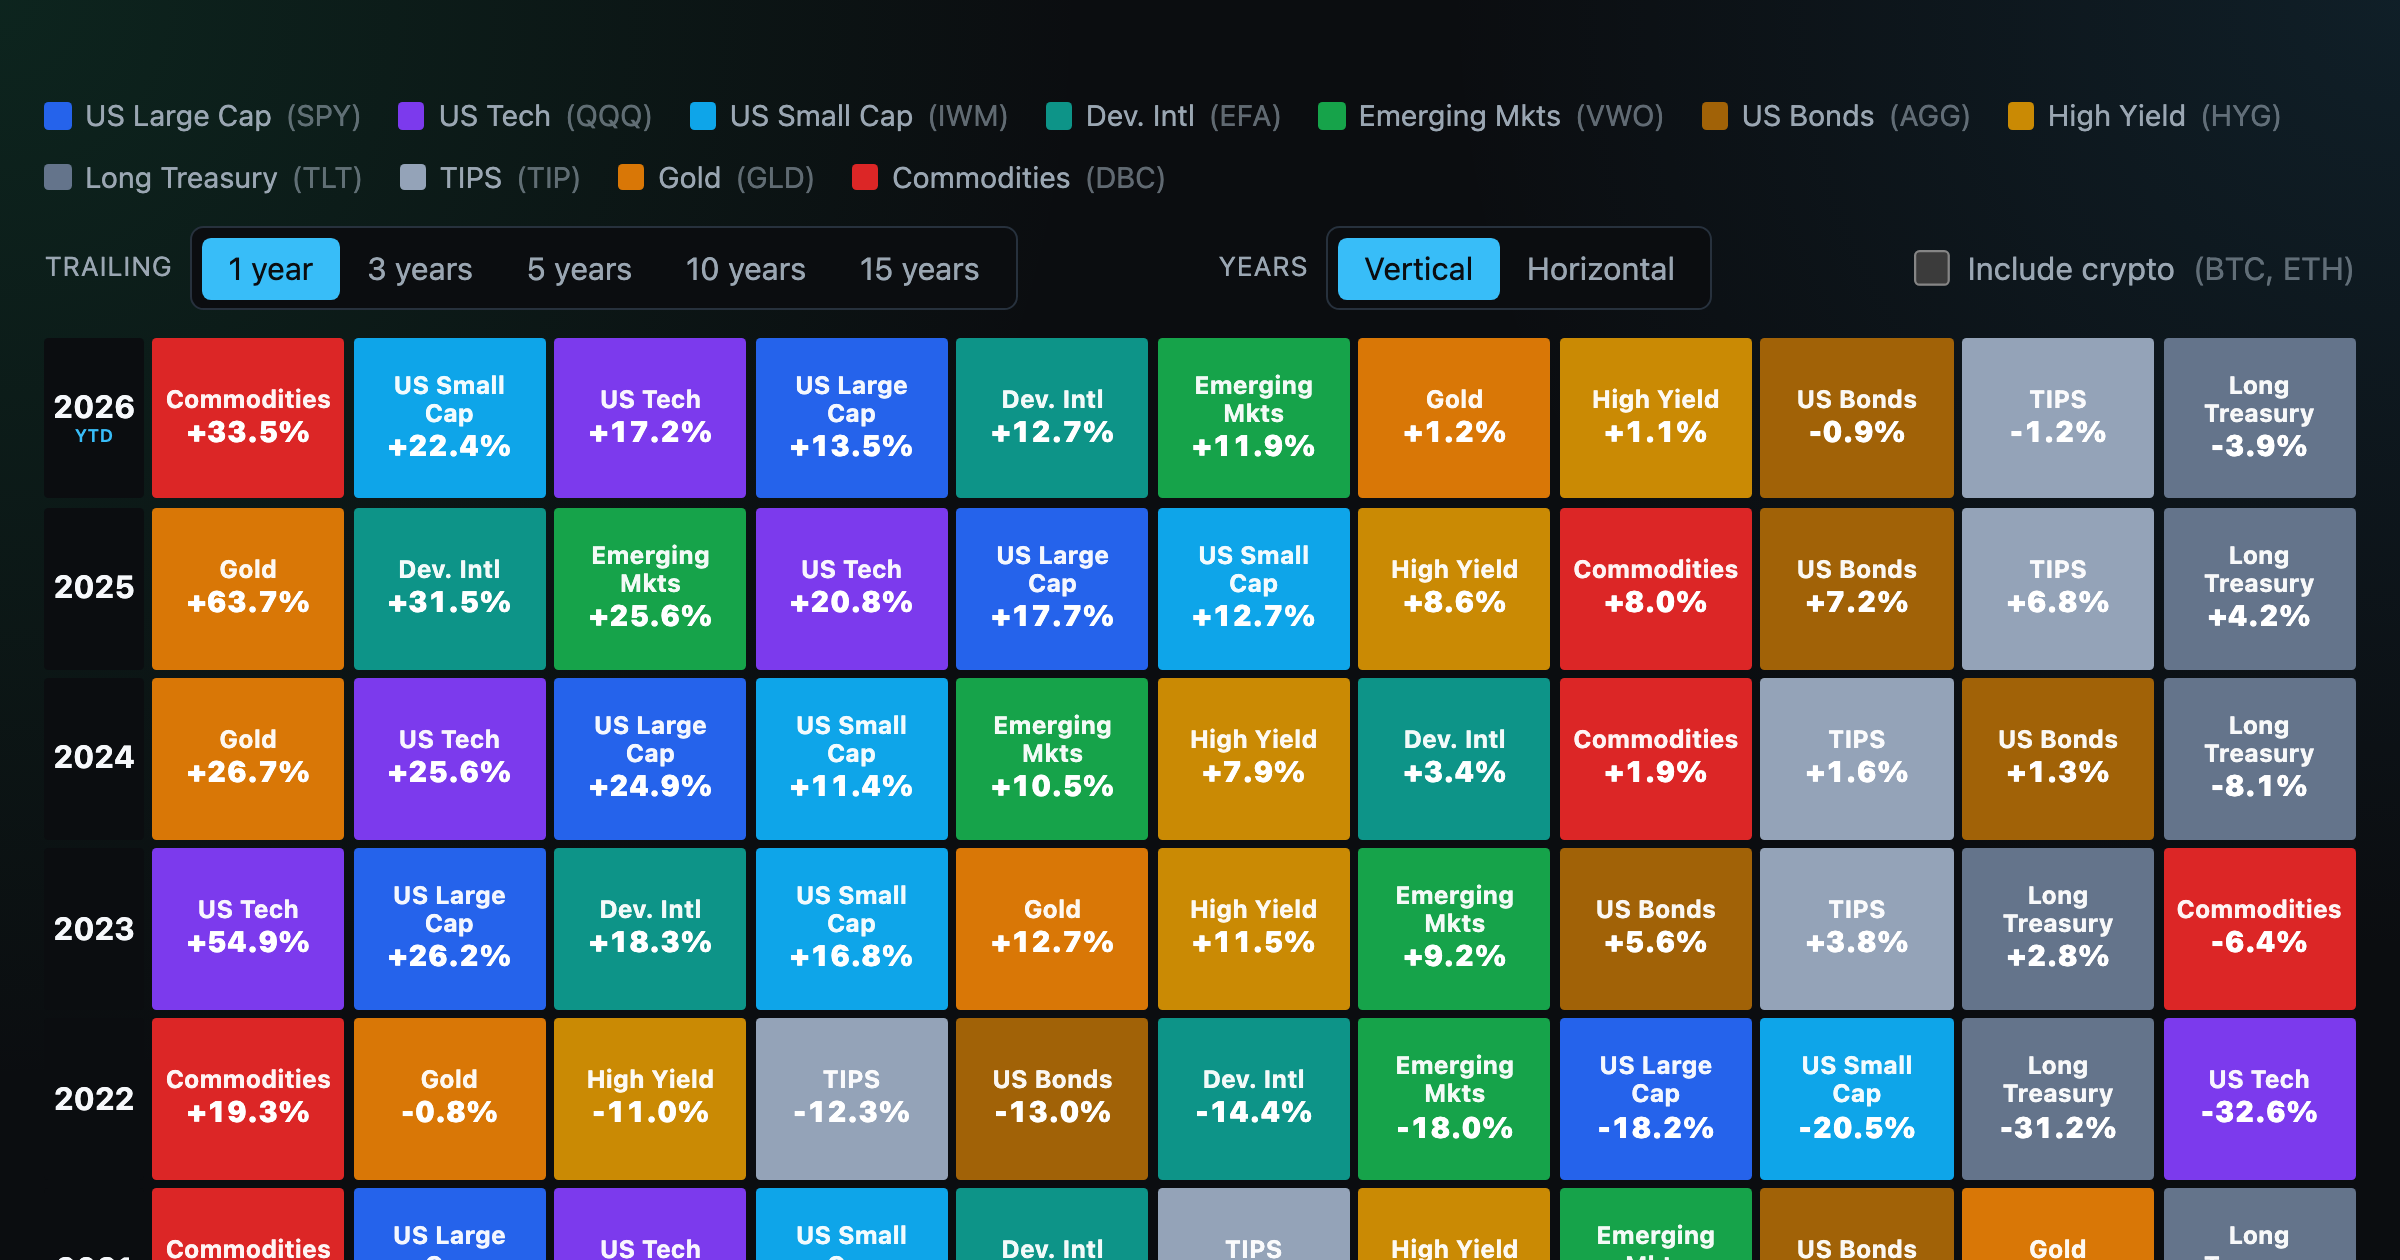
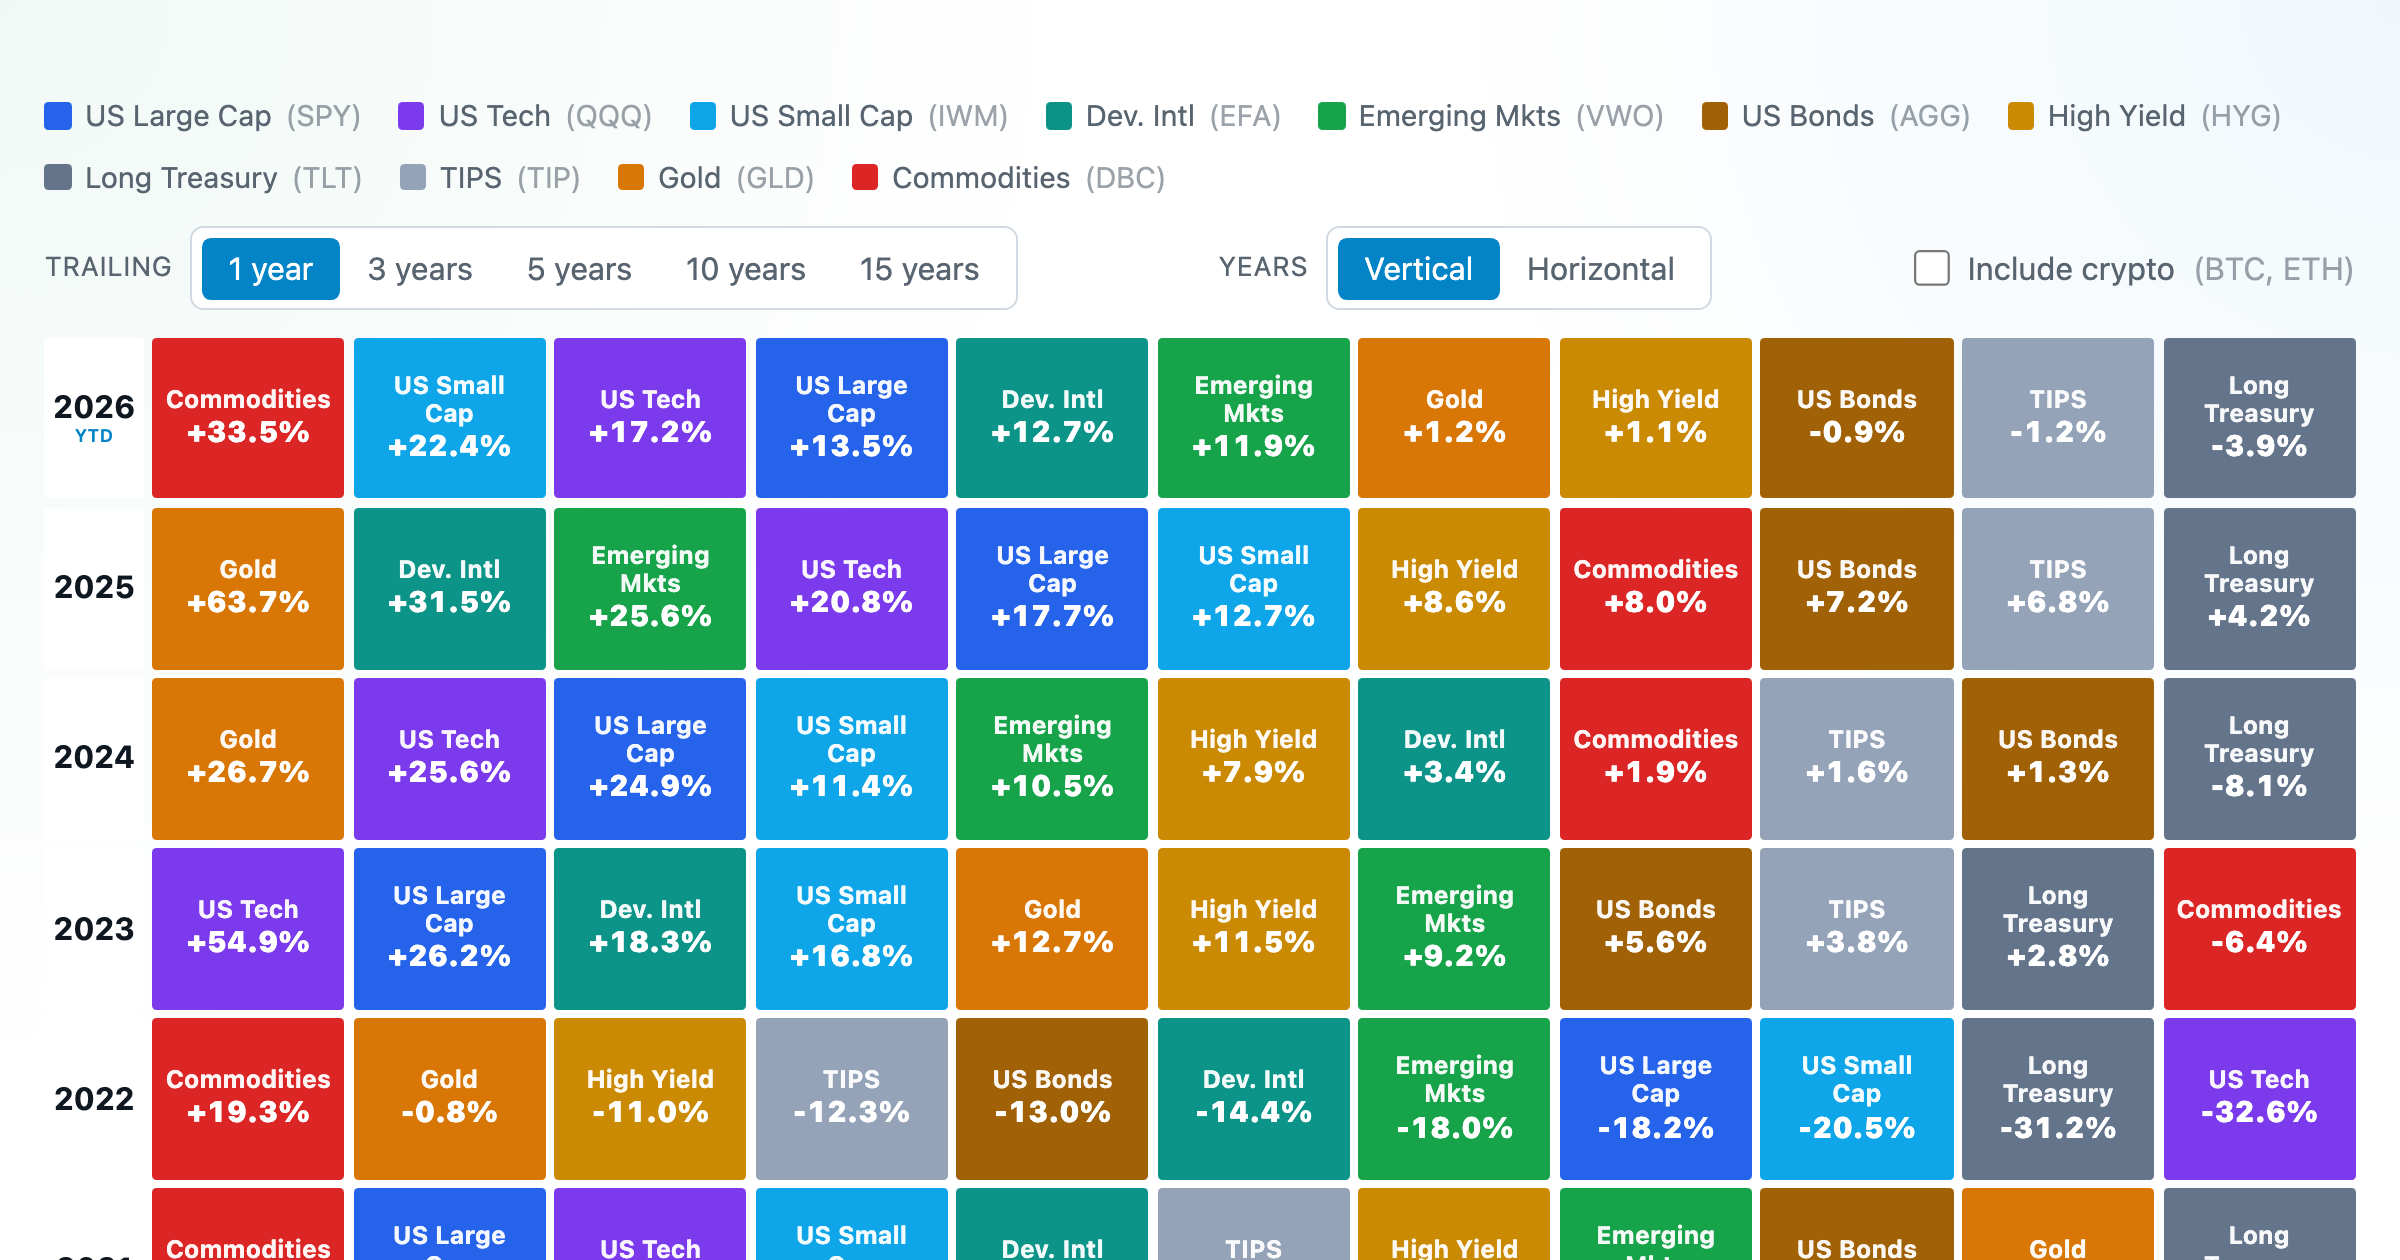
Asset-class returns ranked year by year — the Callan chart / asset allocation quilt.
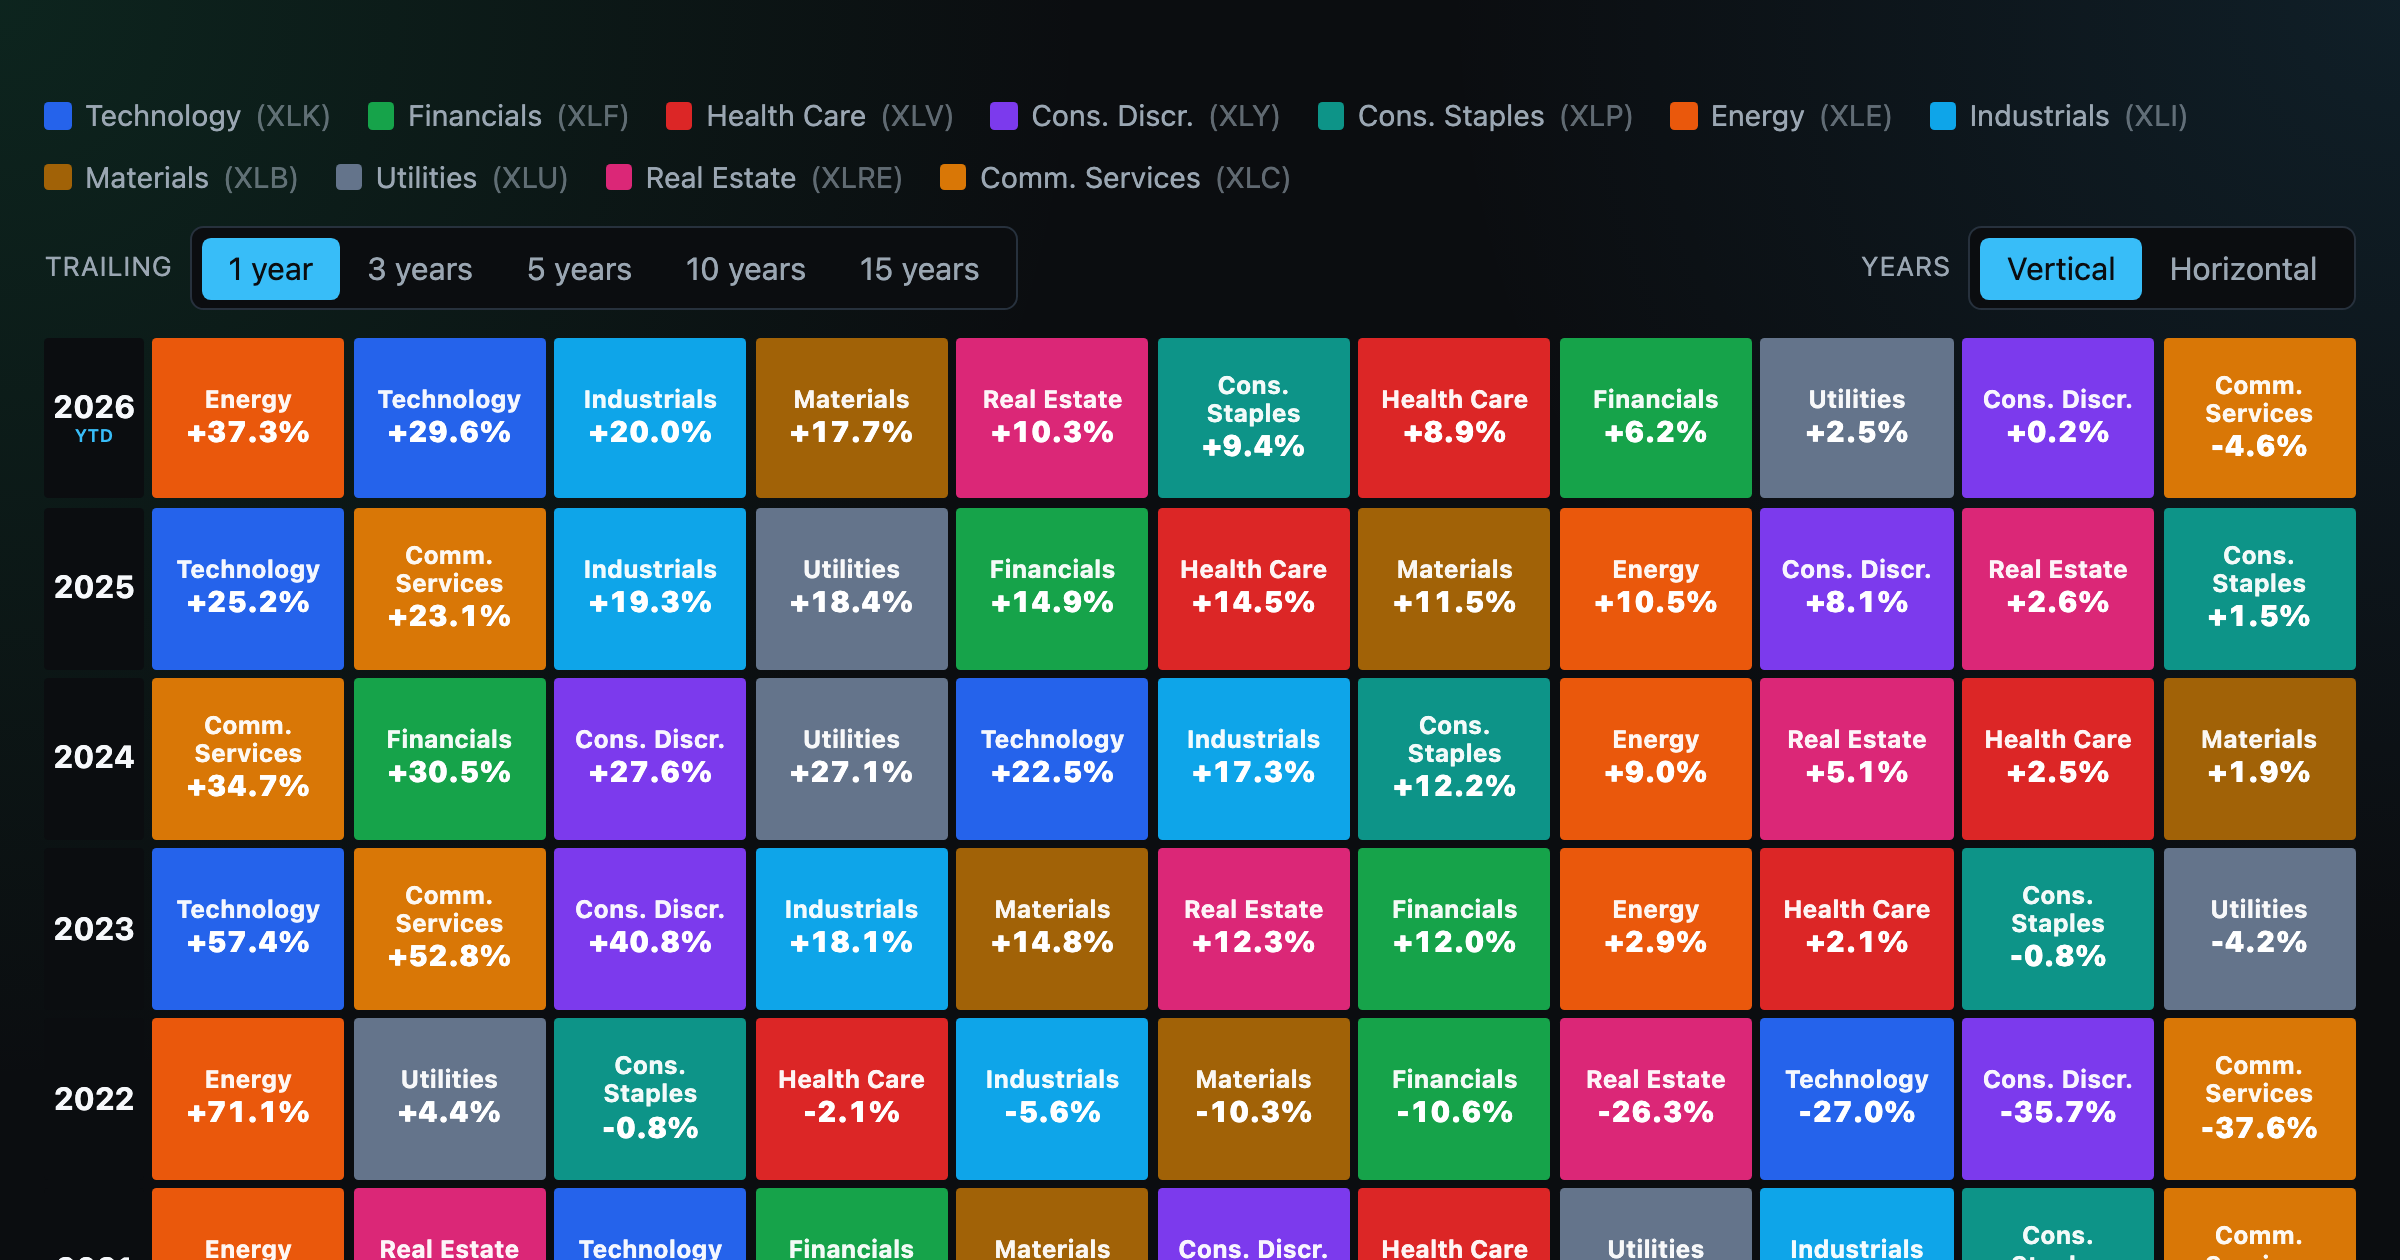
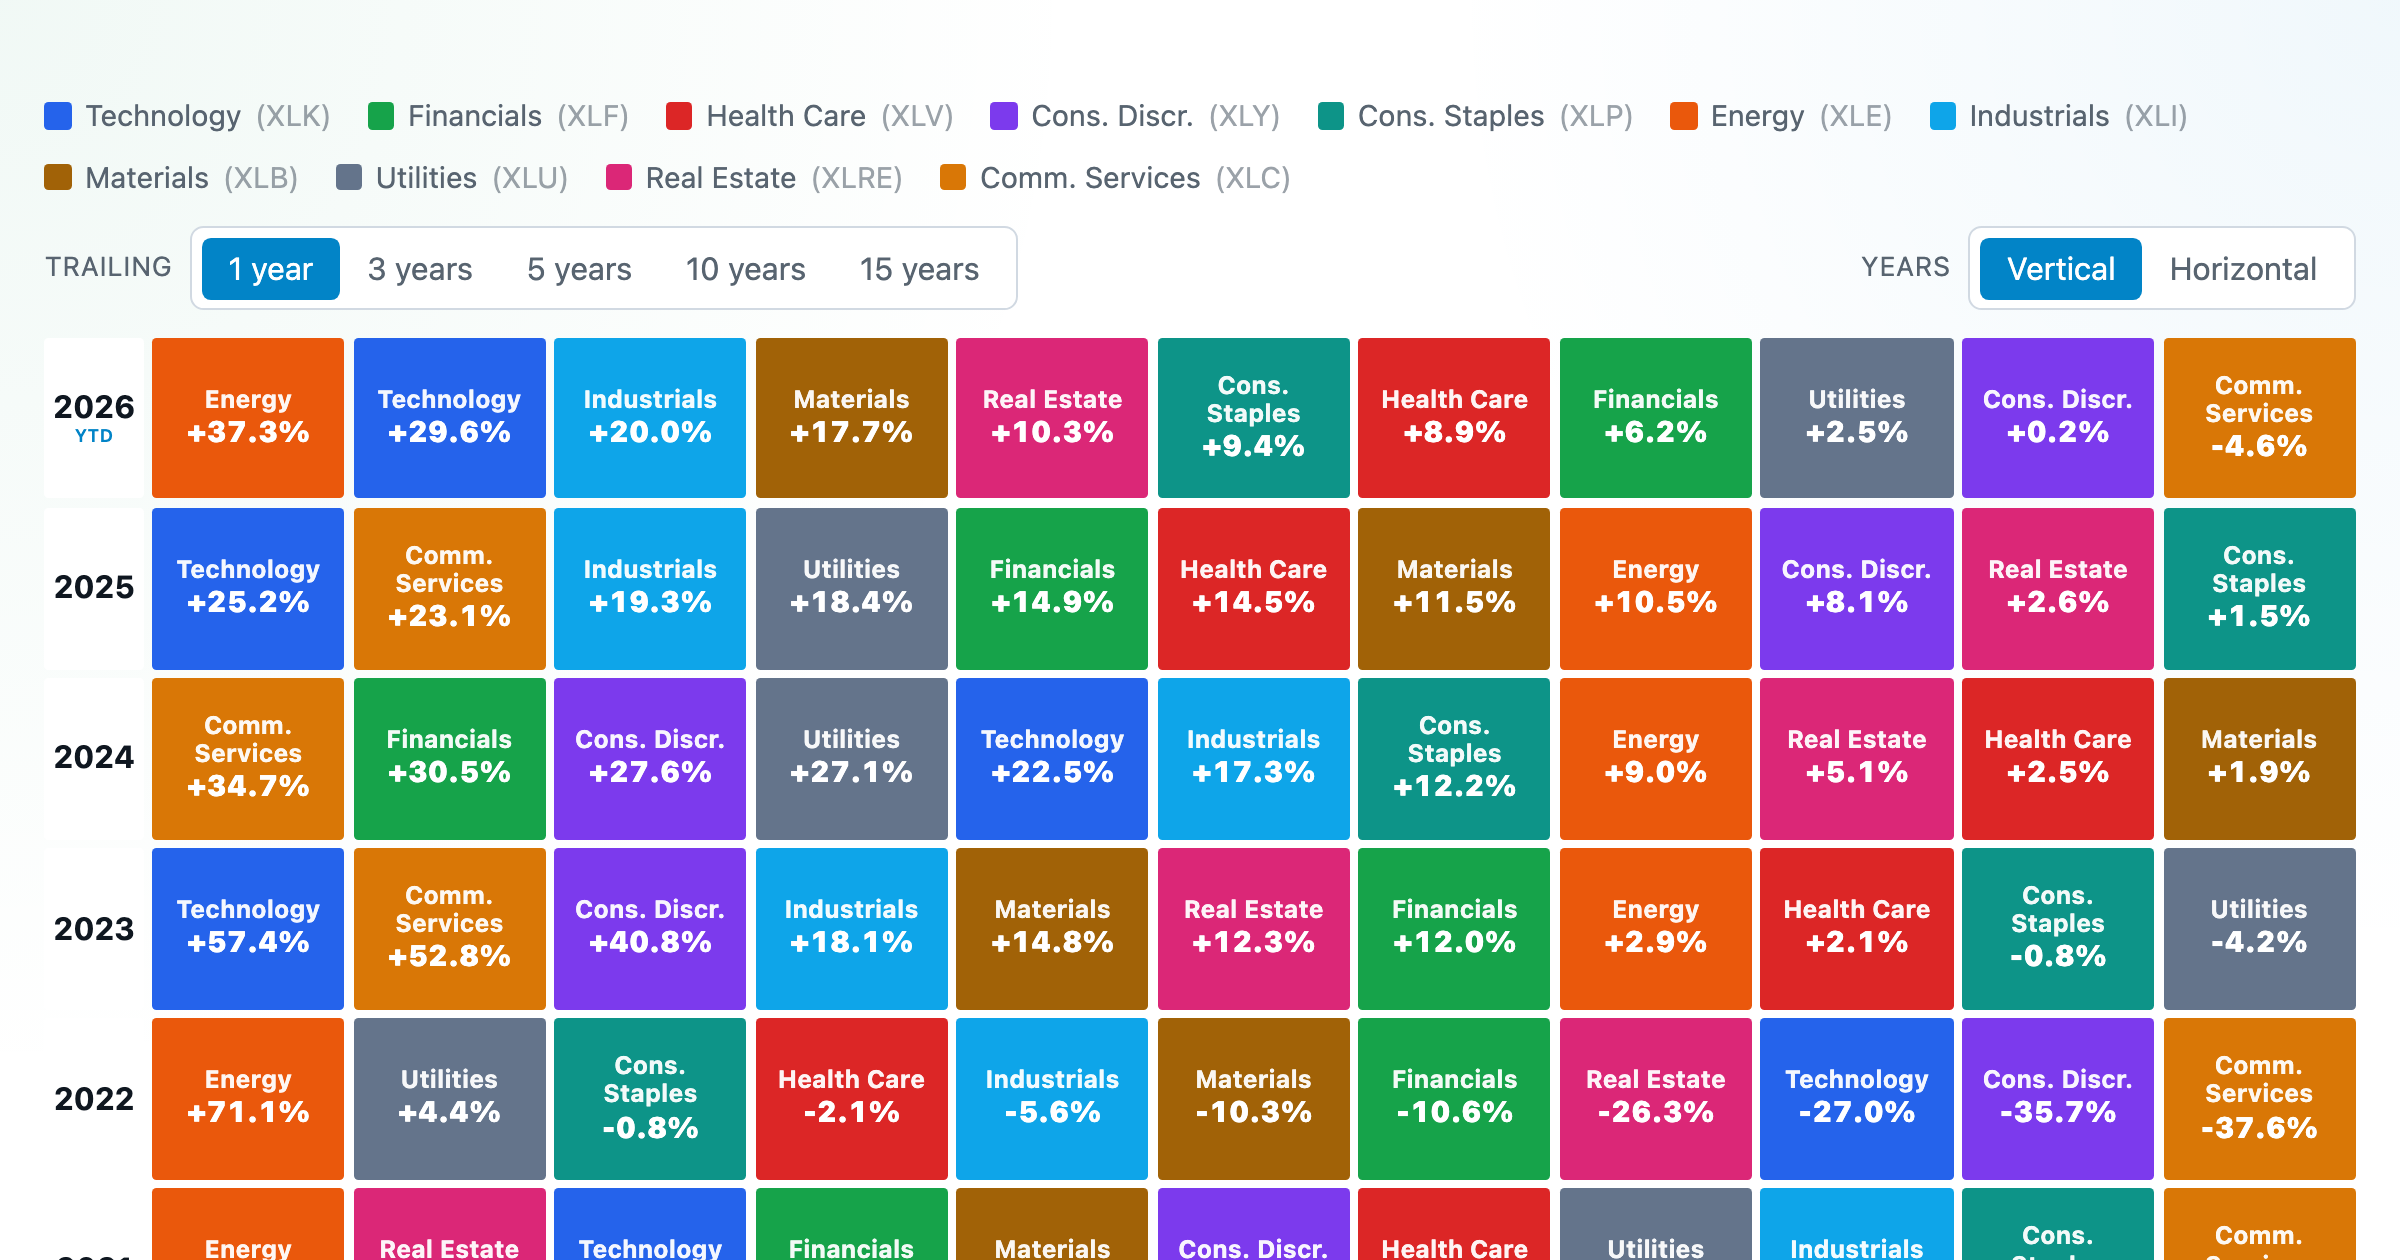
The 11 S&P 500 sectors ranked year by year — a sector quilt chart, back to 1999.
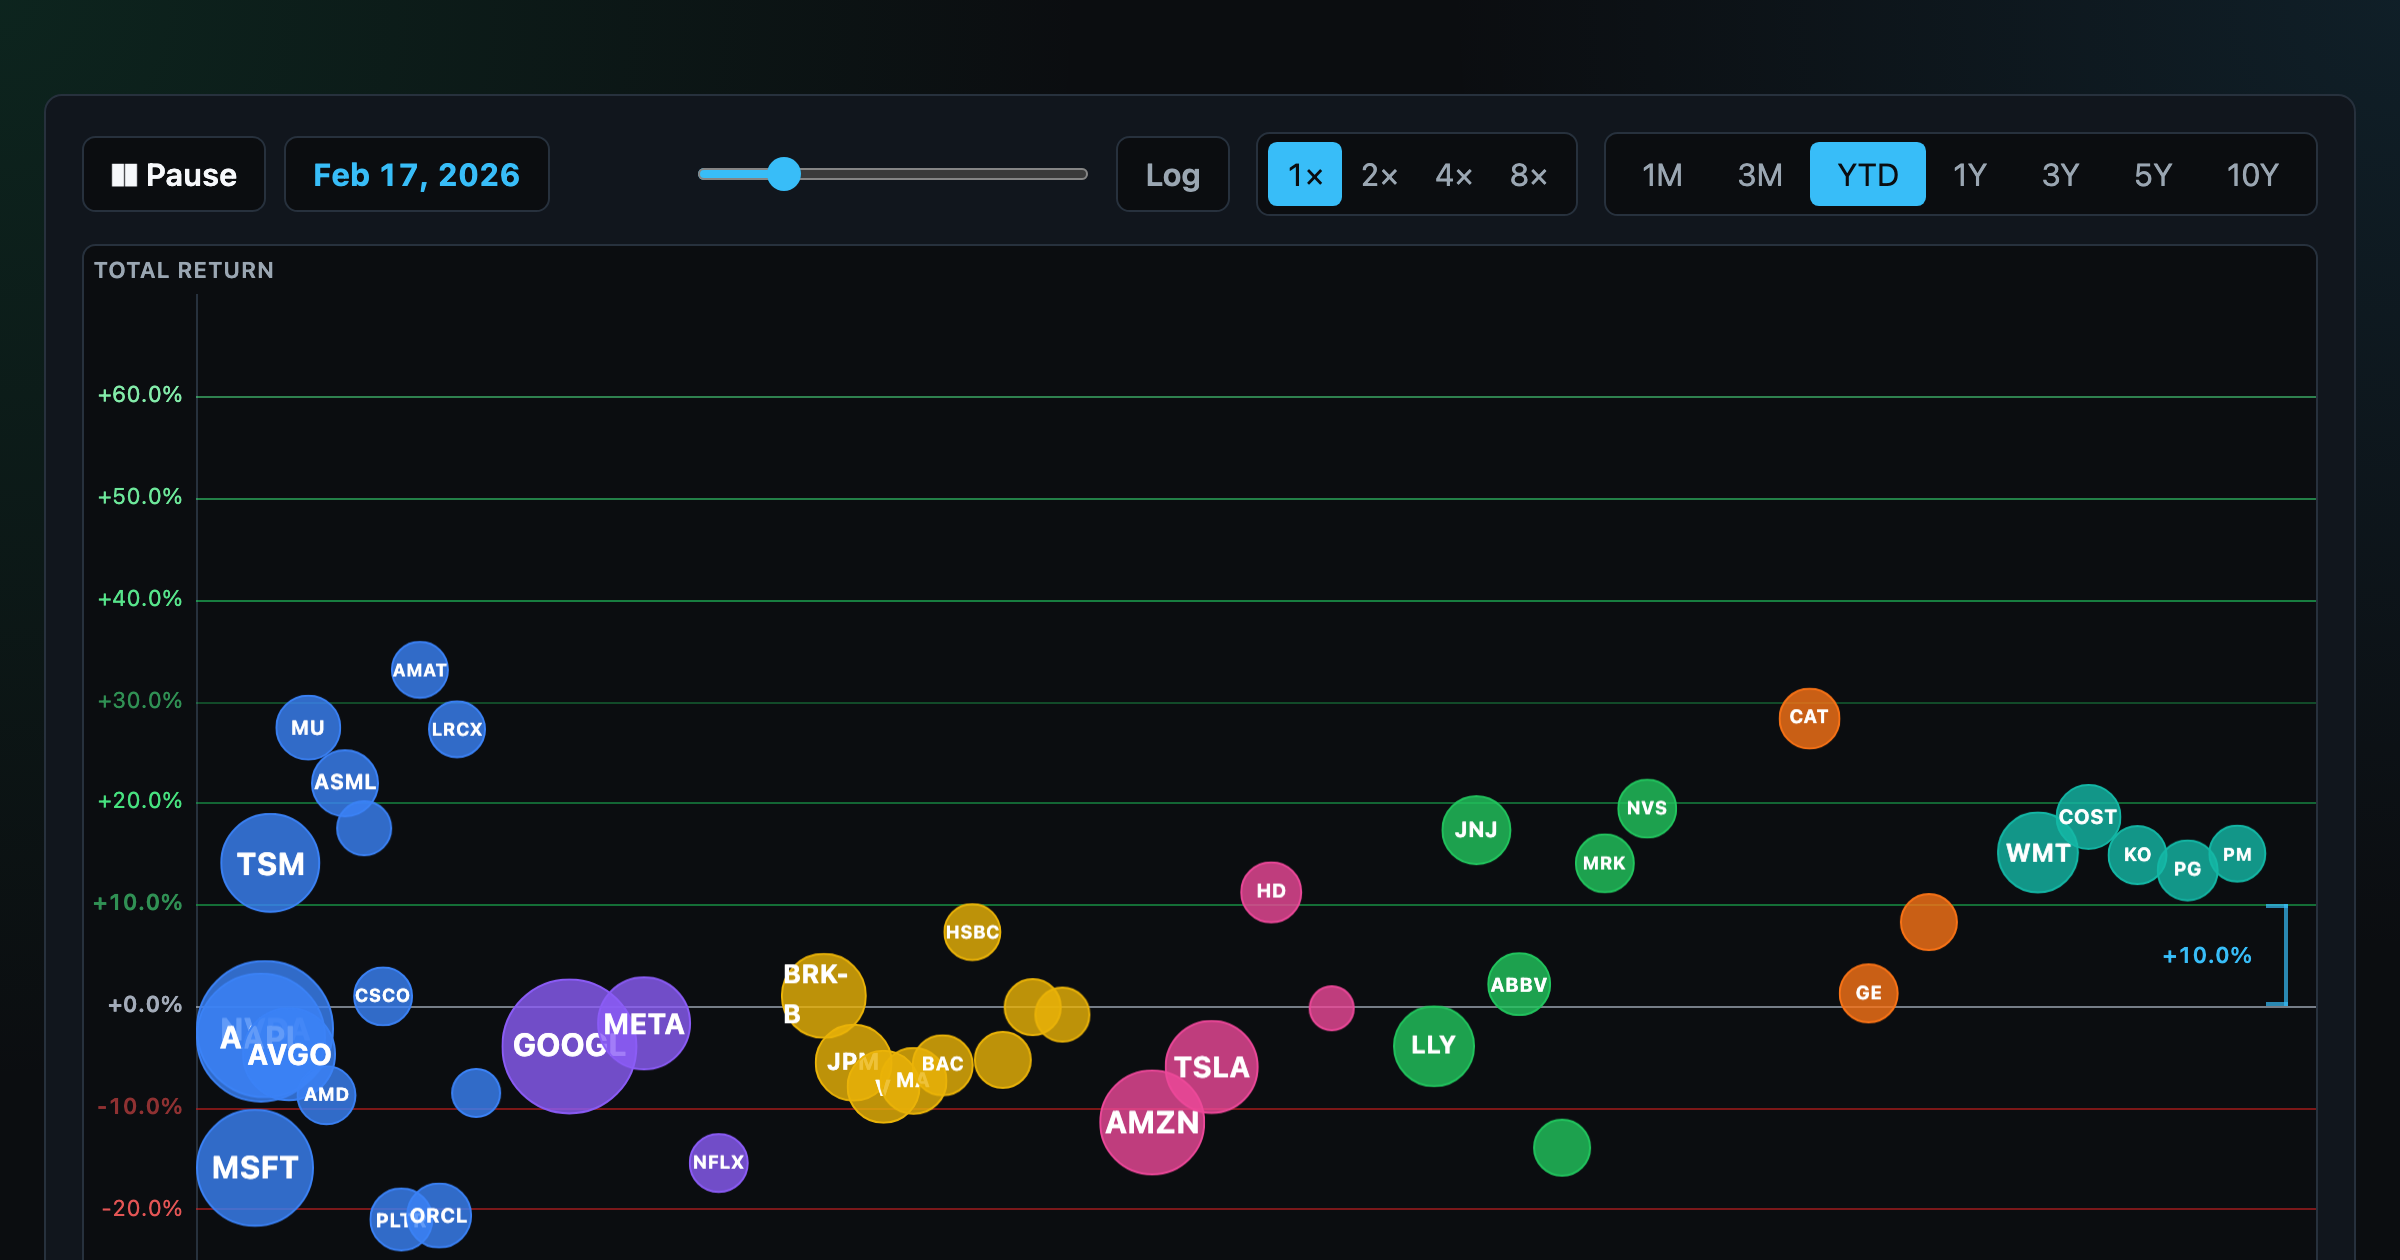
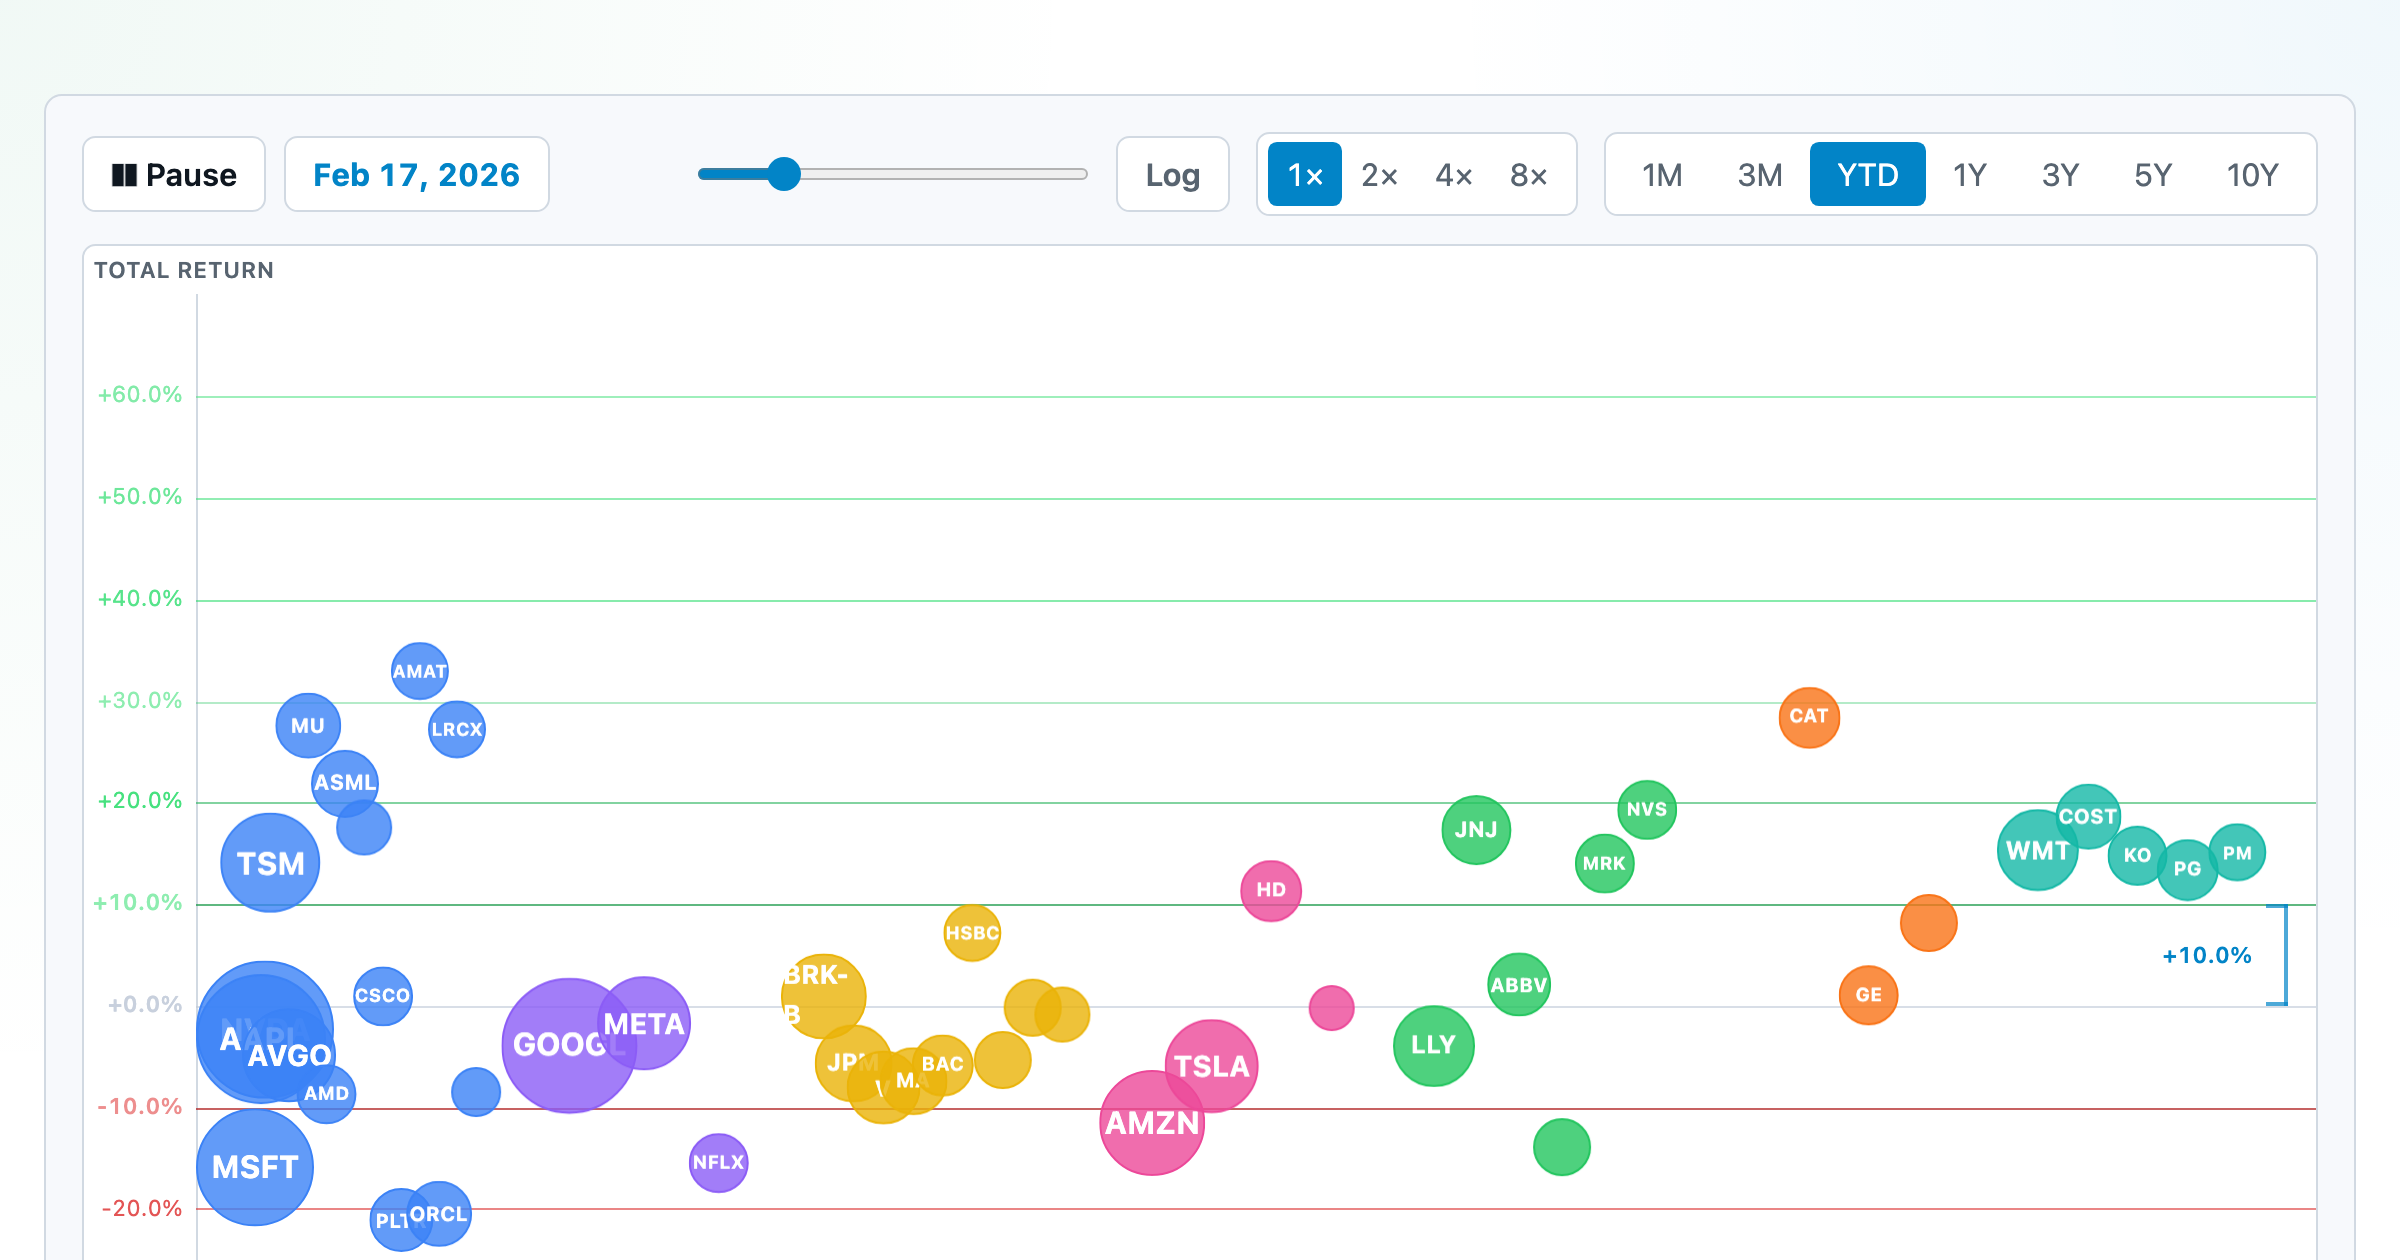
The biggest US companies as animated bubbles, rising and falling with their total return over time.
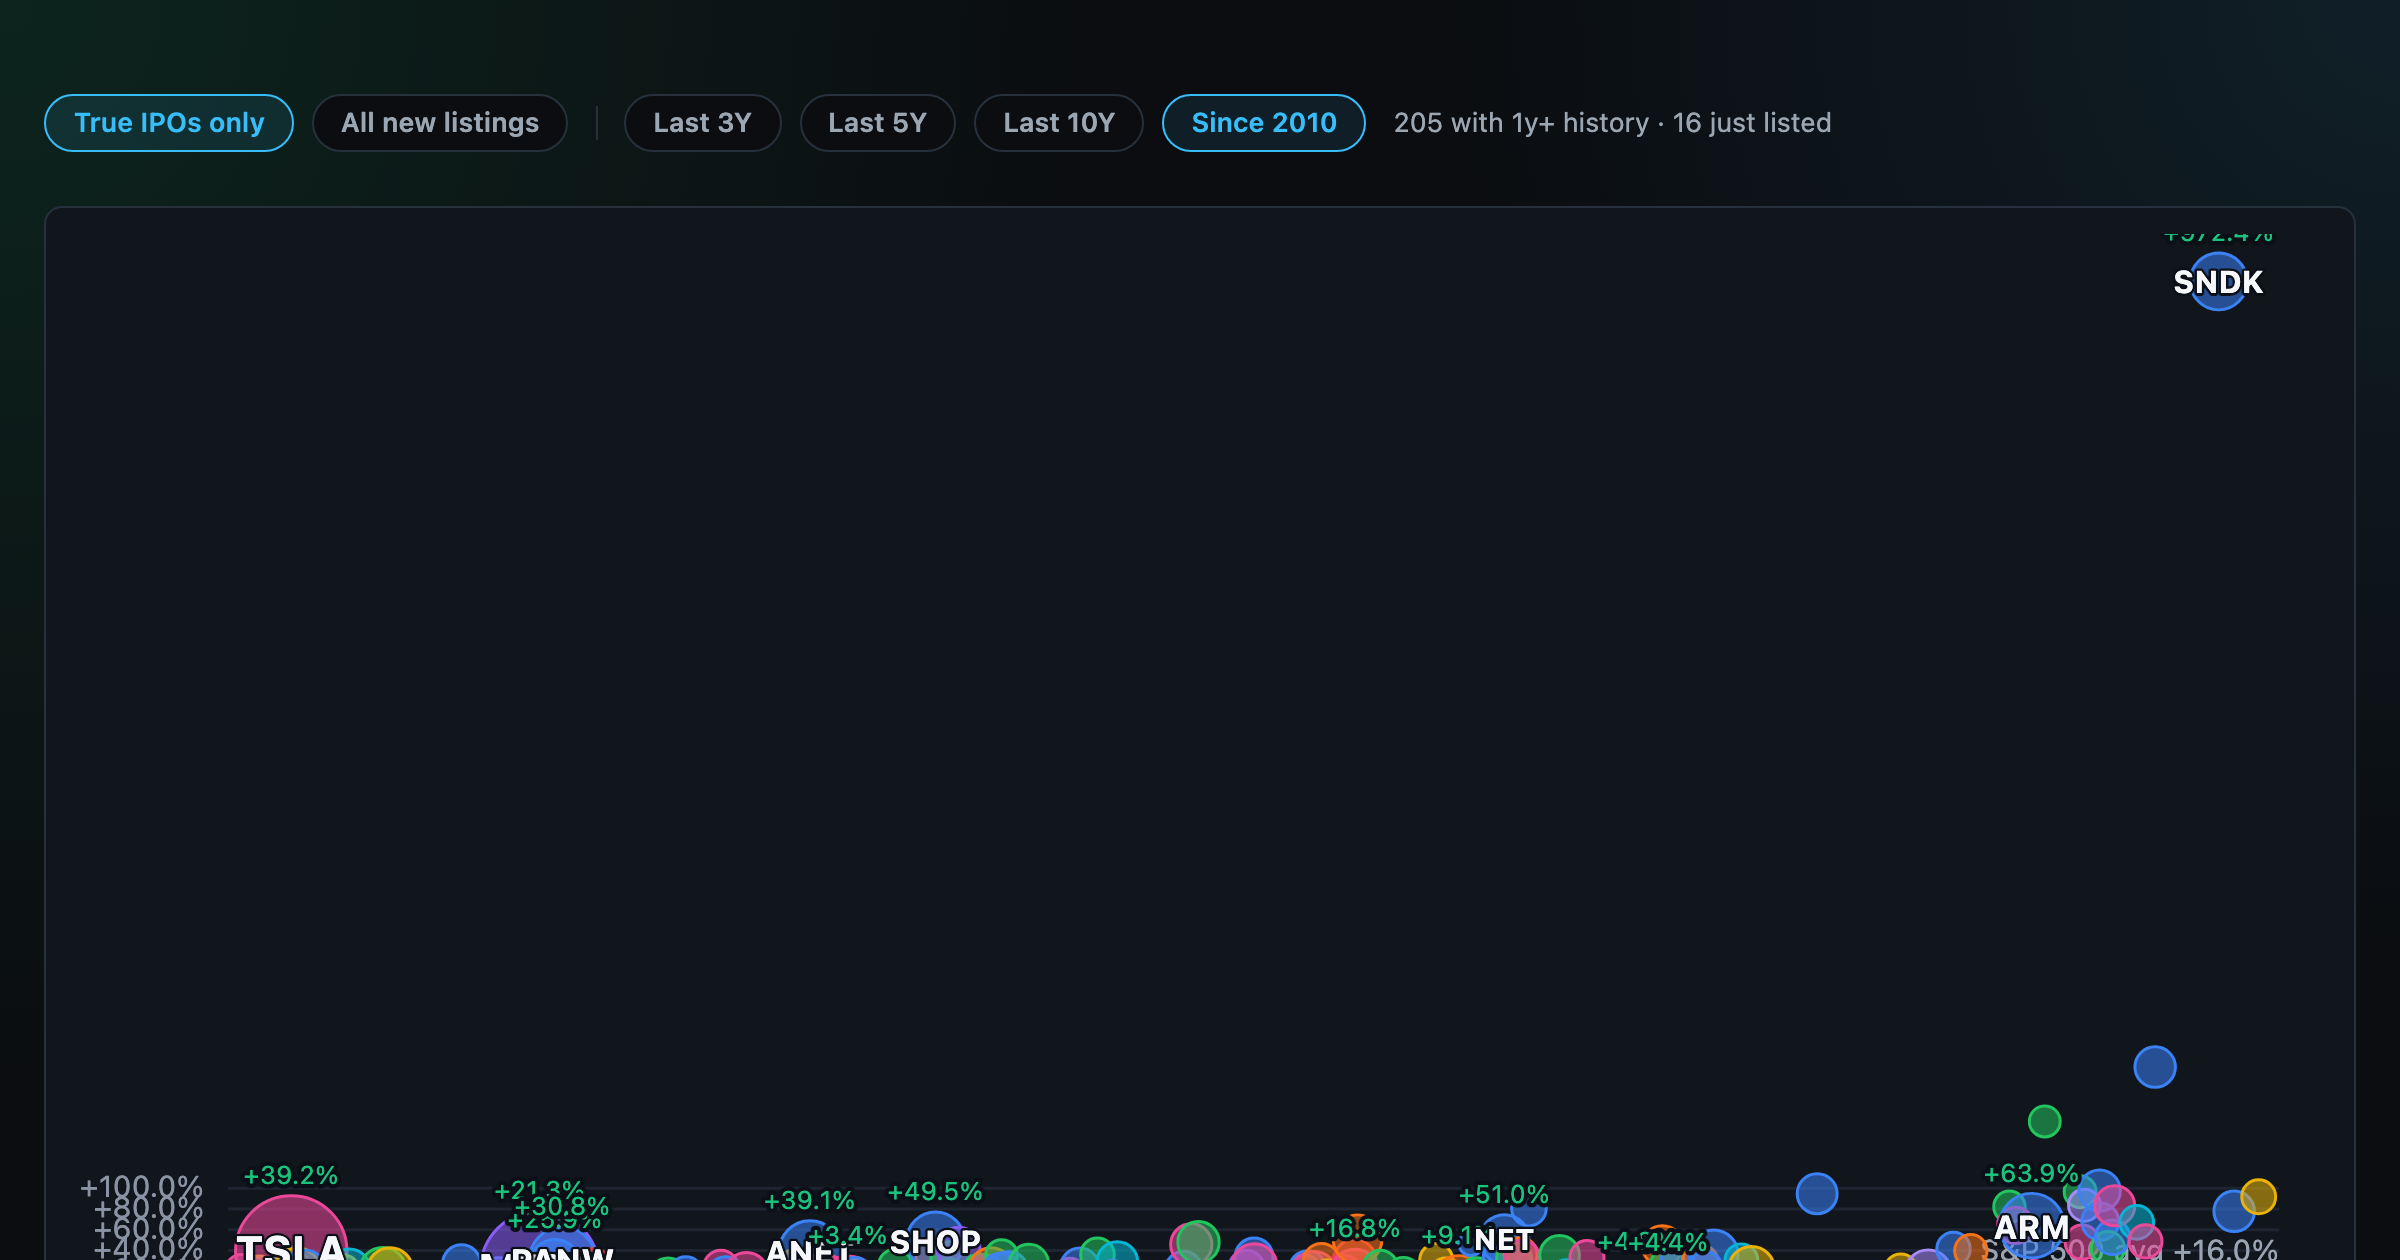
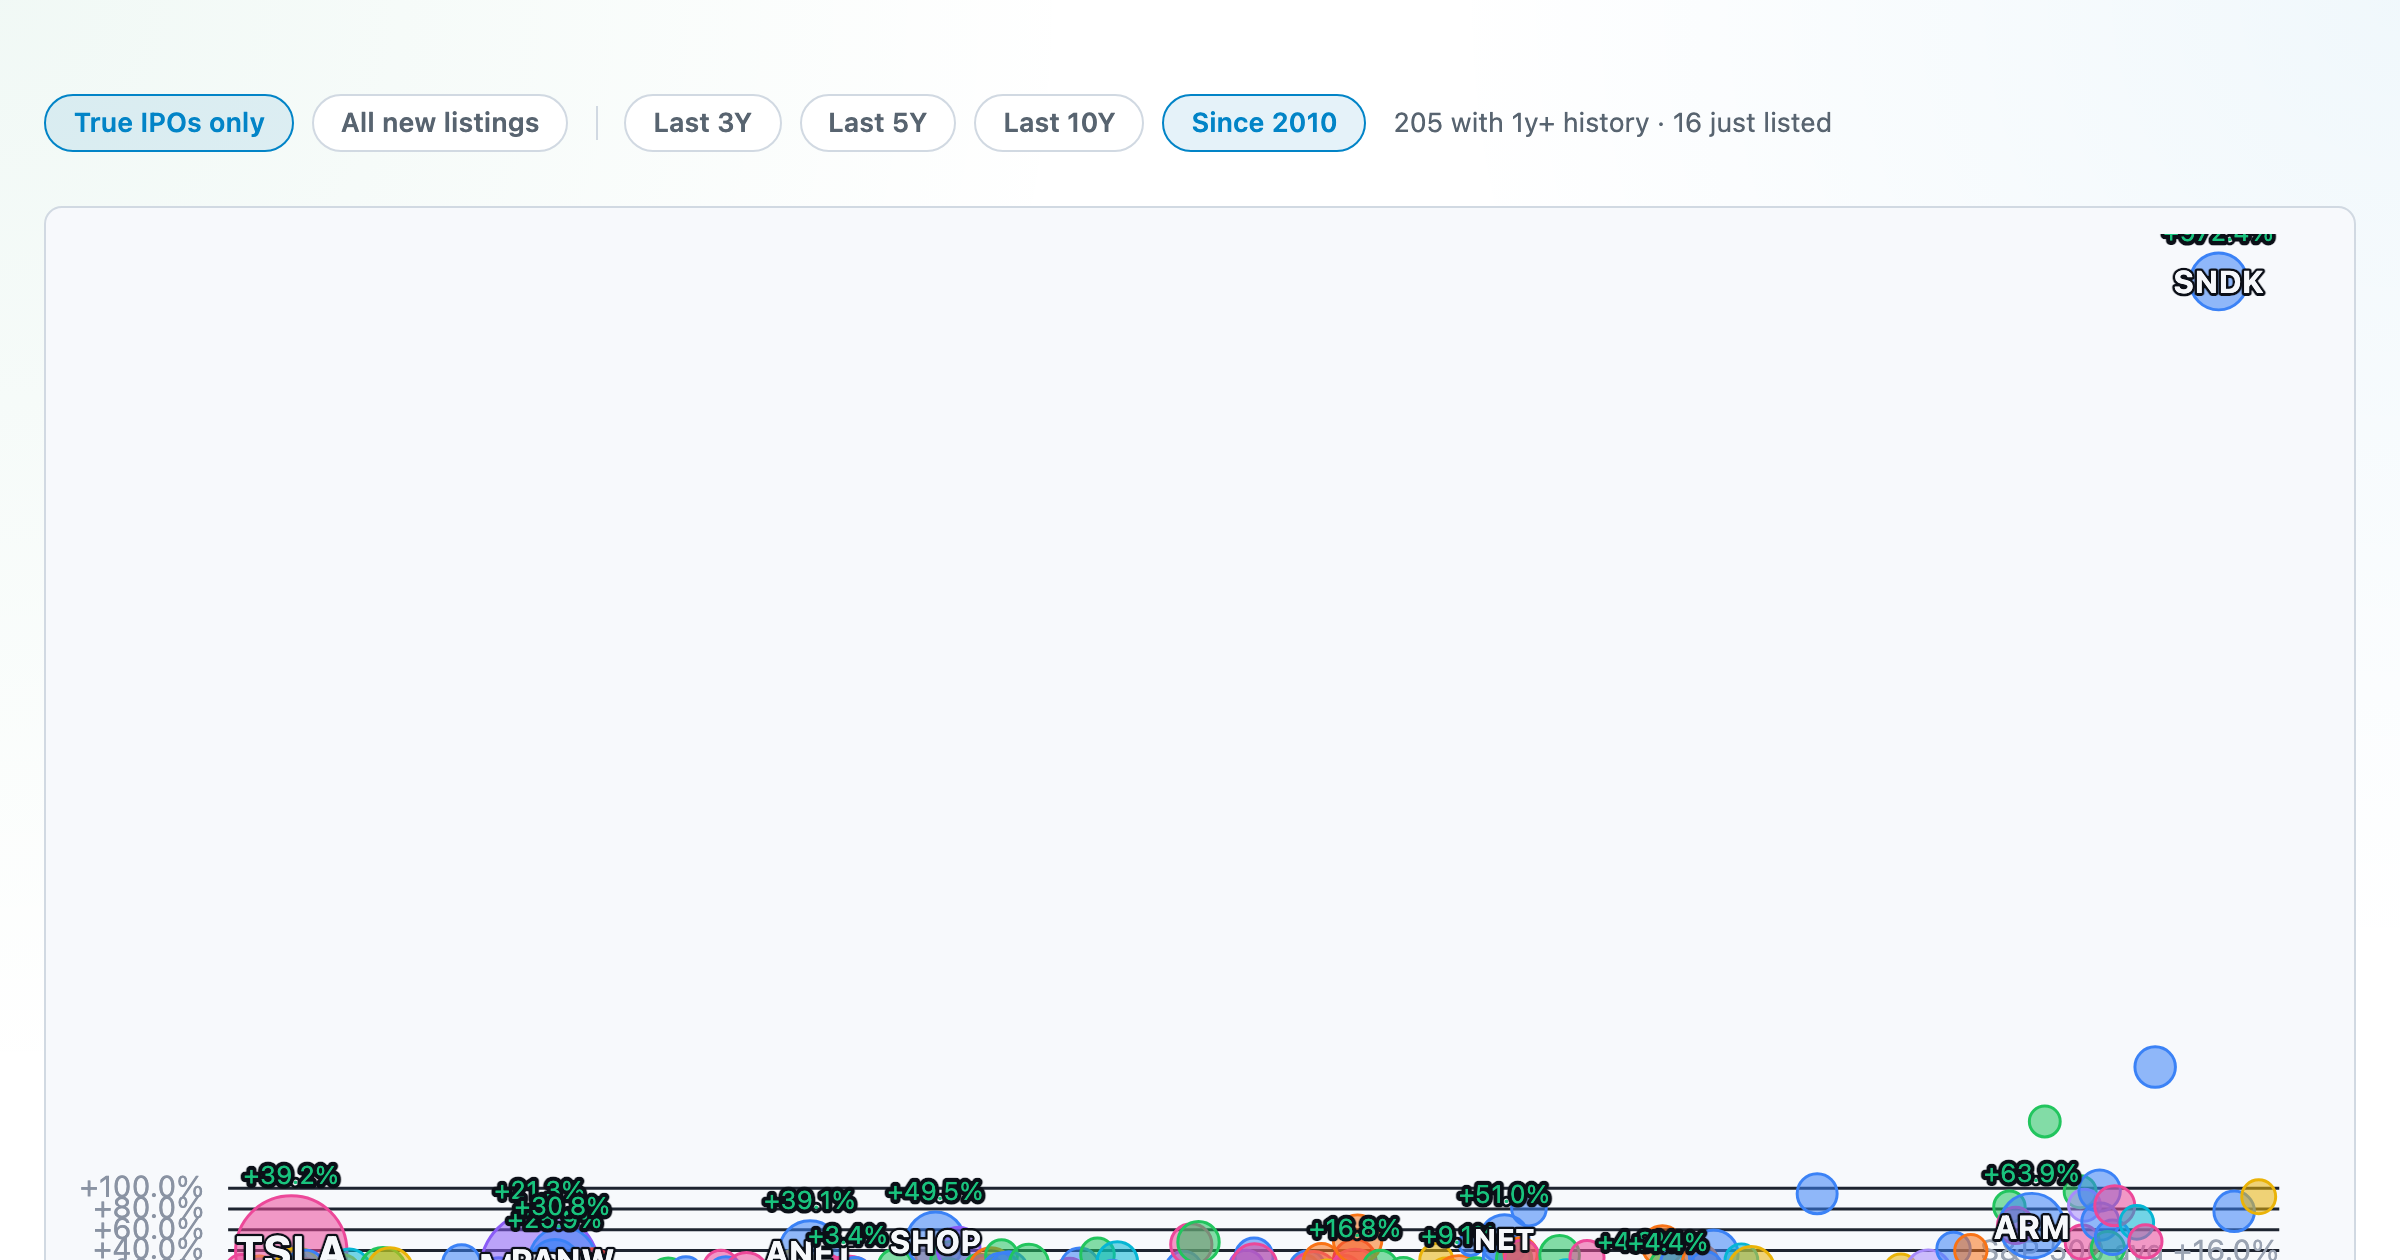
How recent stock-market debuts have performed since listing — annualized, vs the S&P 500, by IPO vs spin-off.
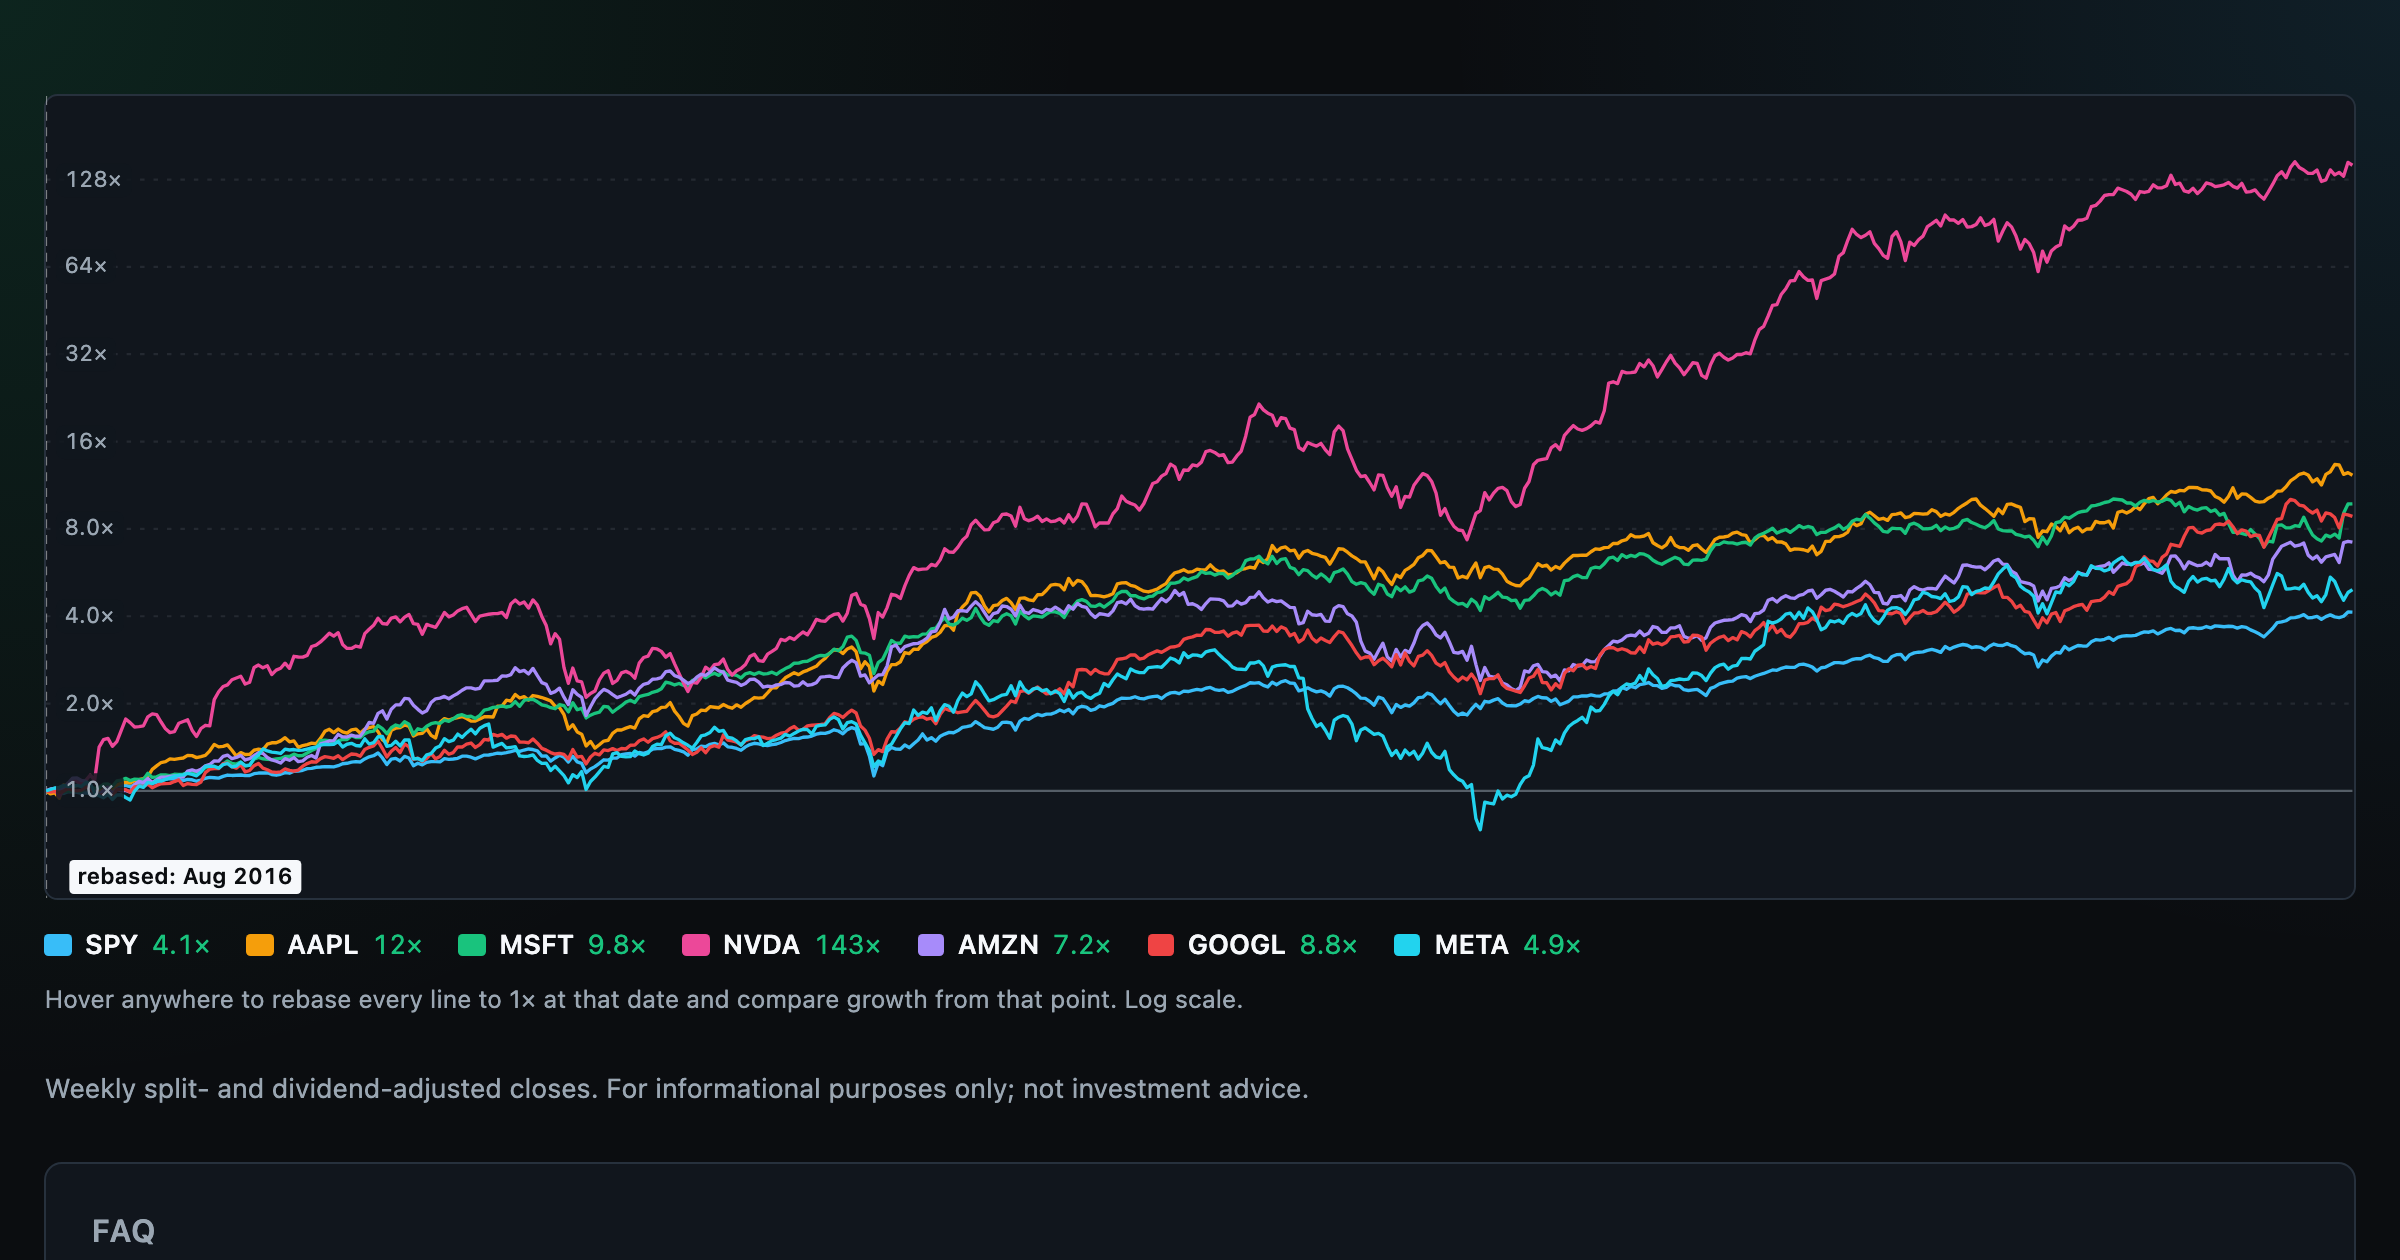
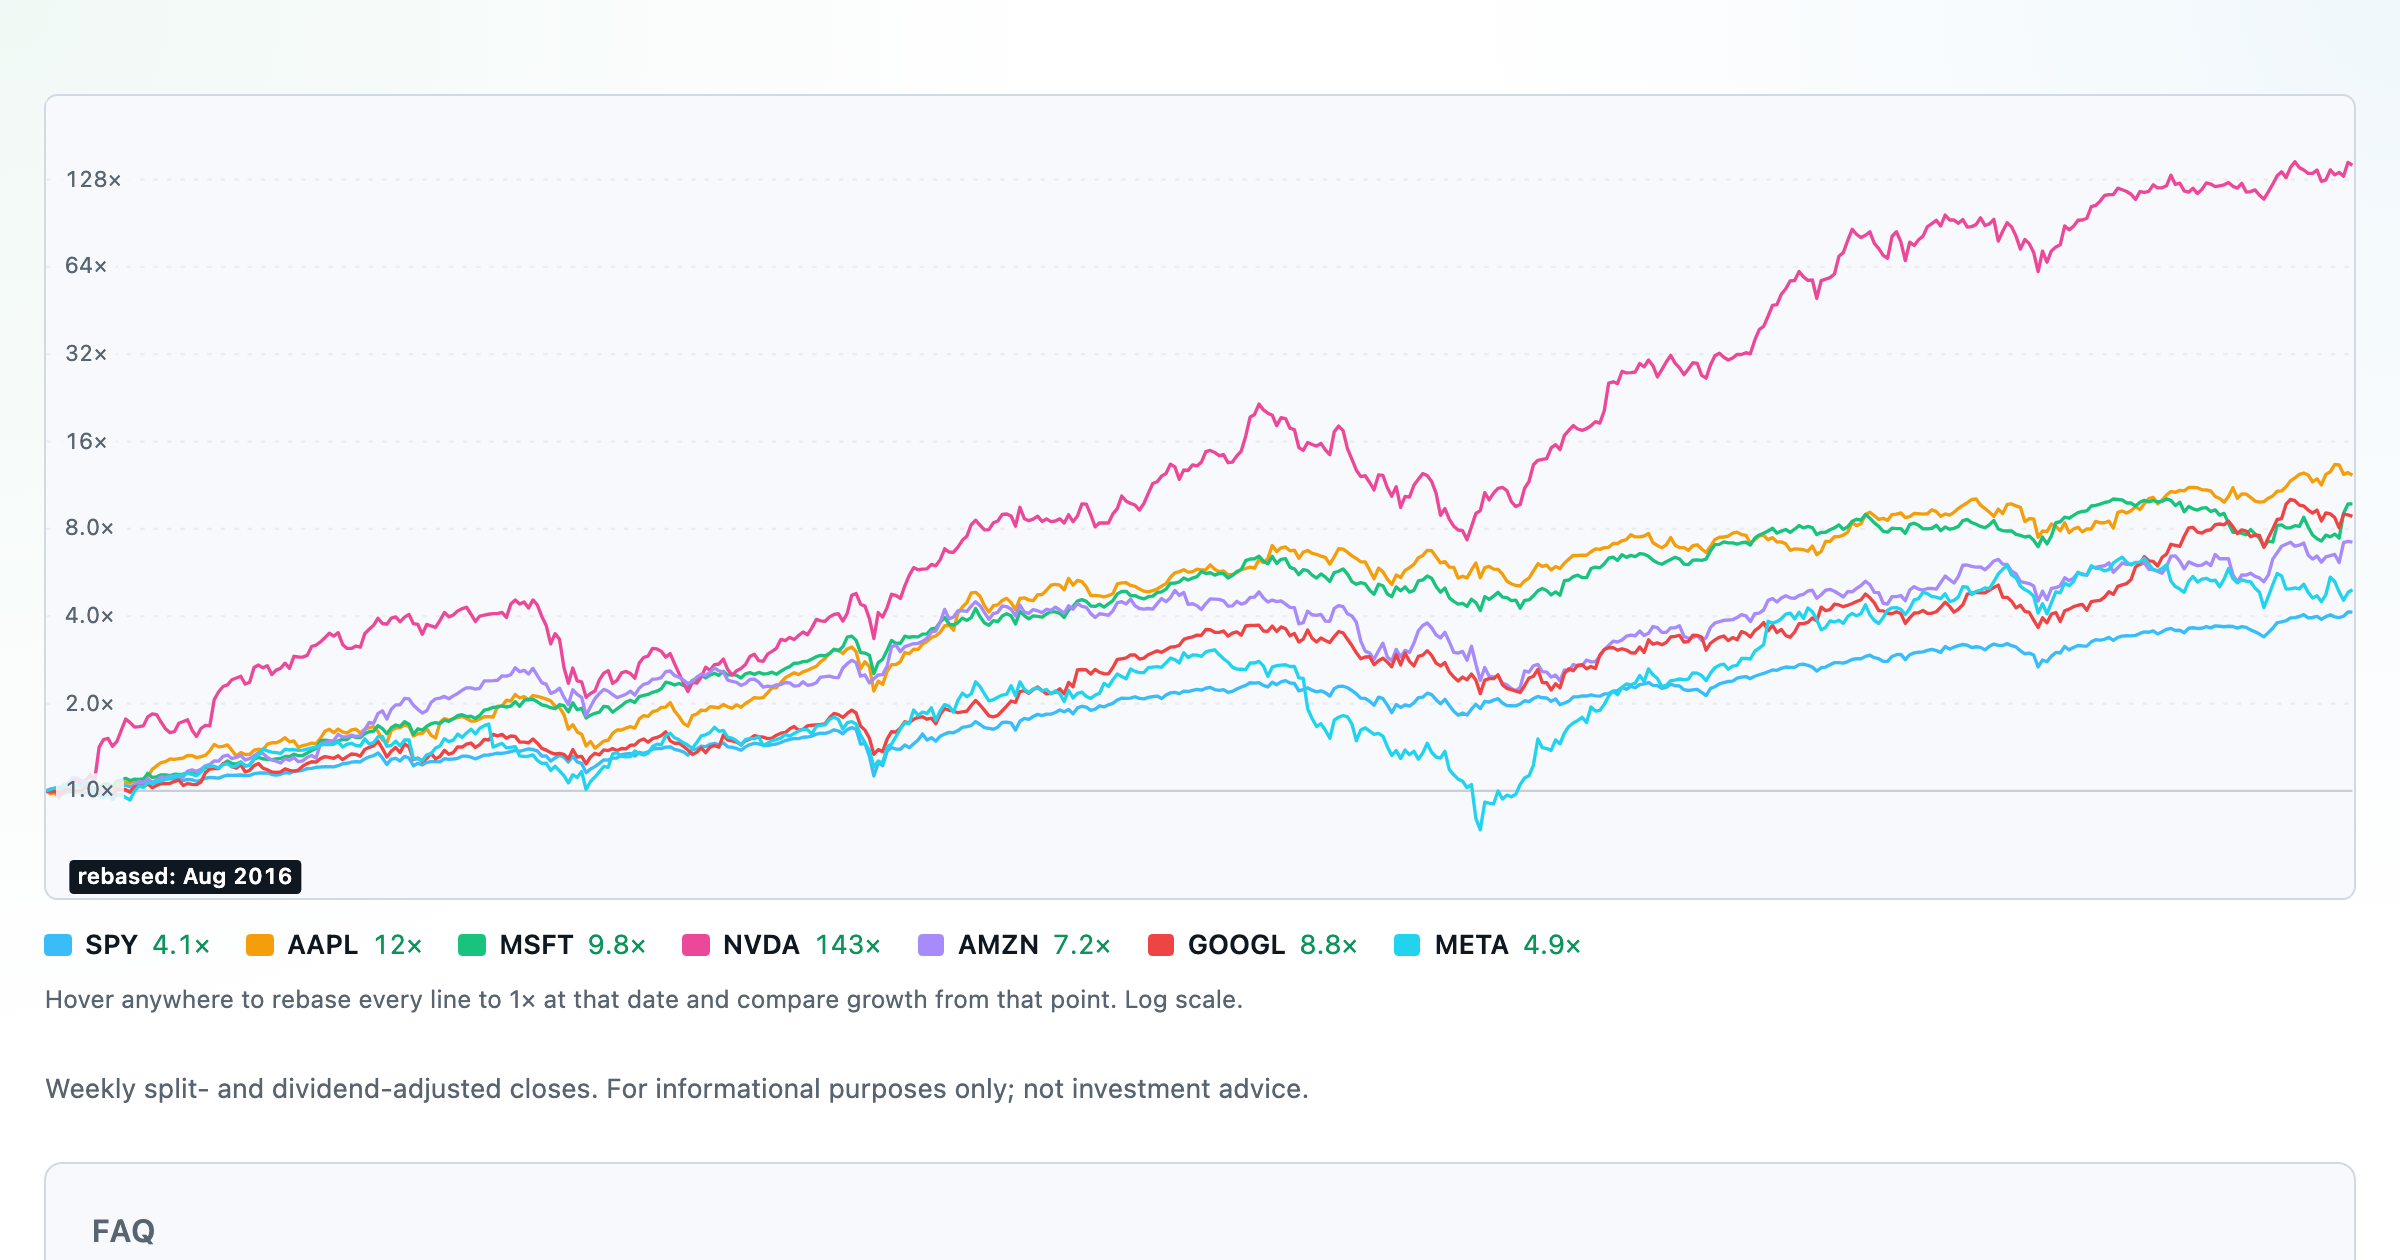
Compare megacaps vs the S&P 500, rebased to 1× at any date you hover.
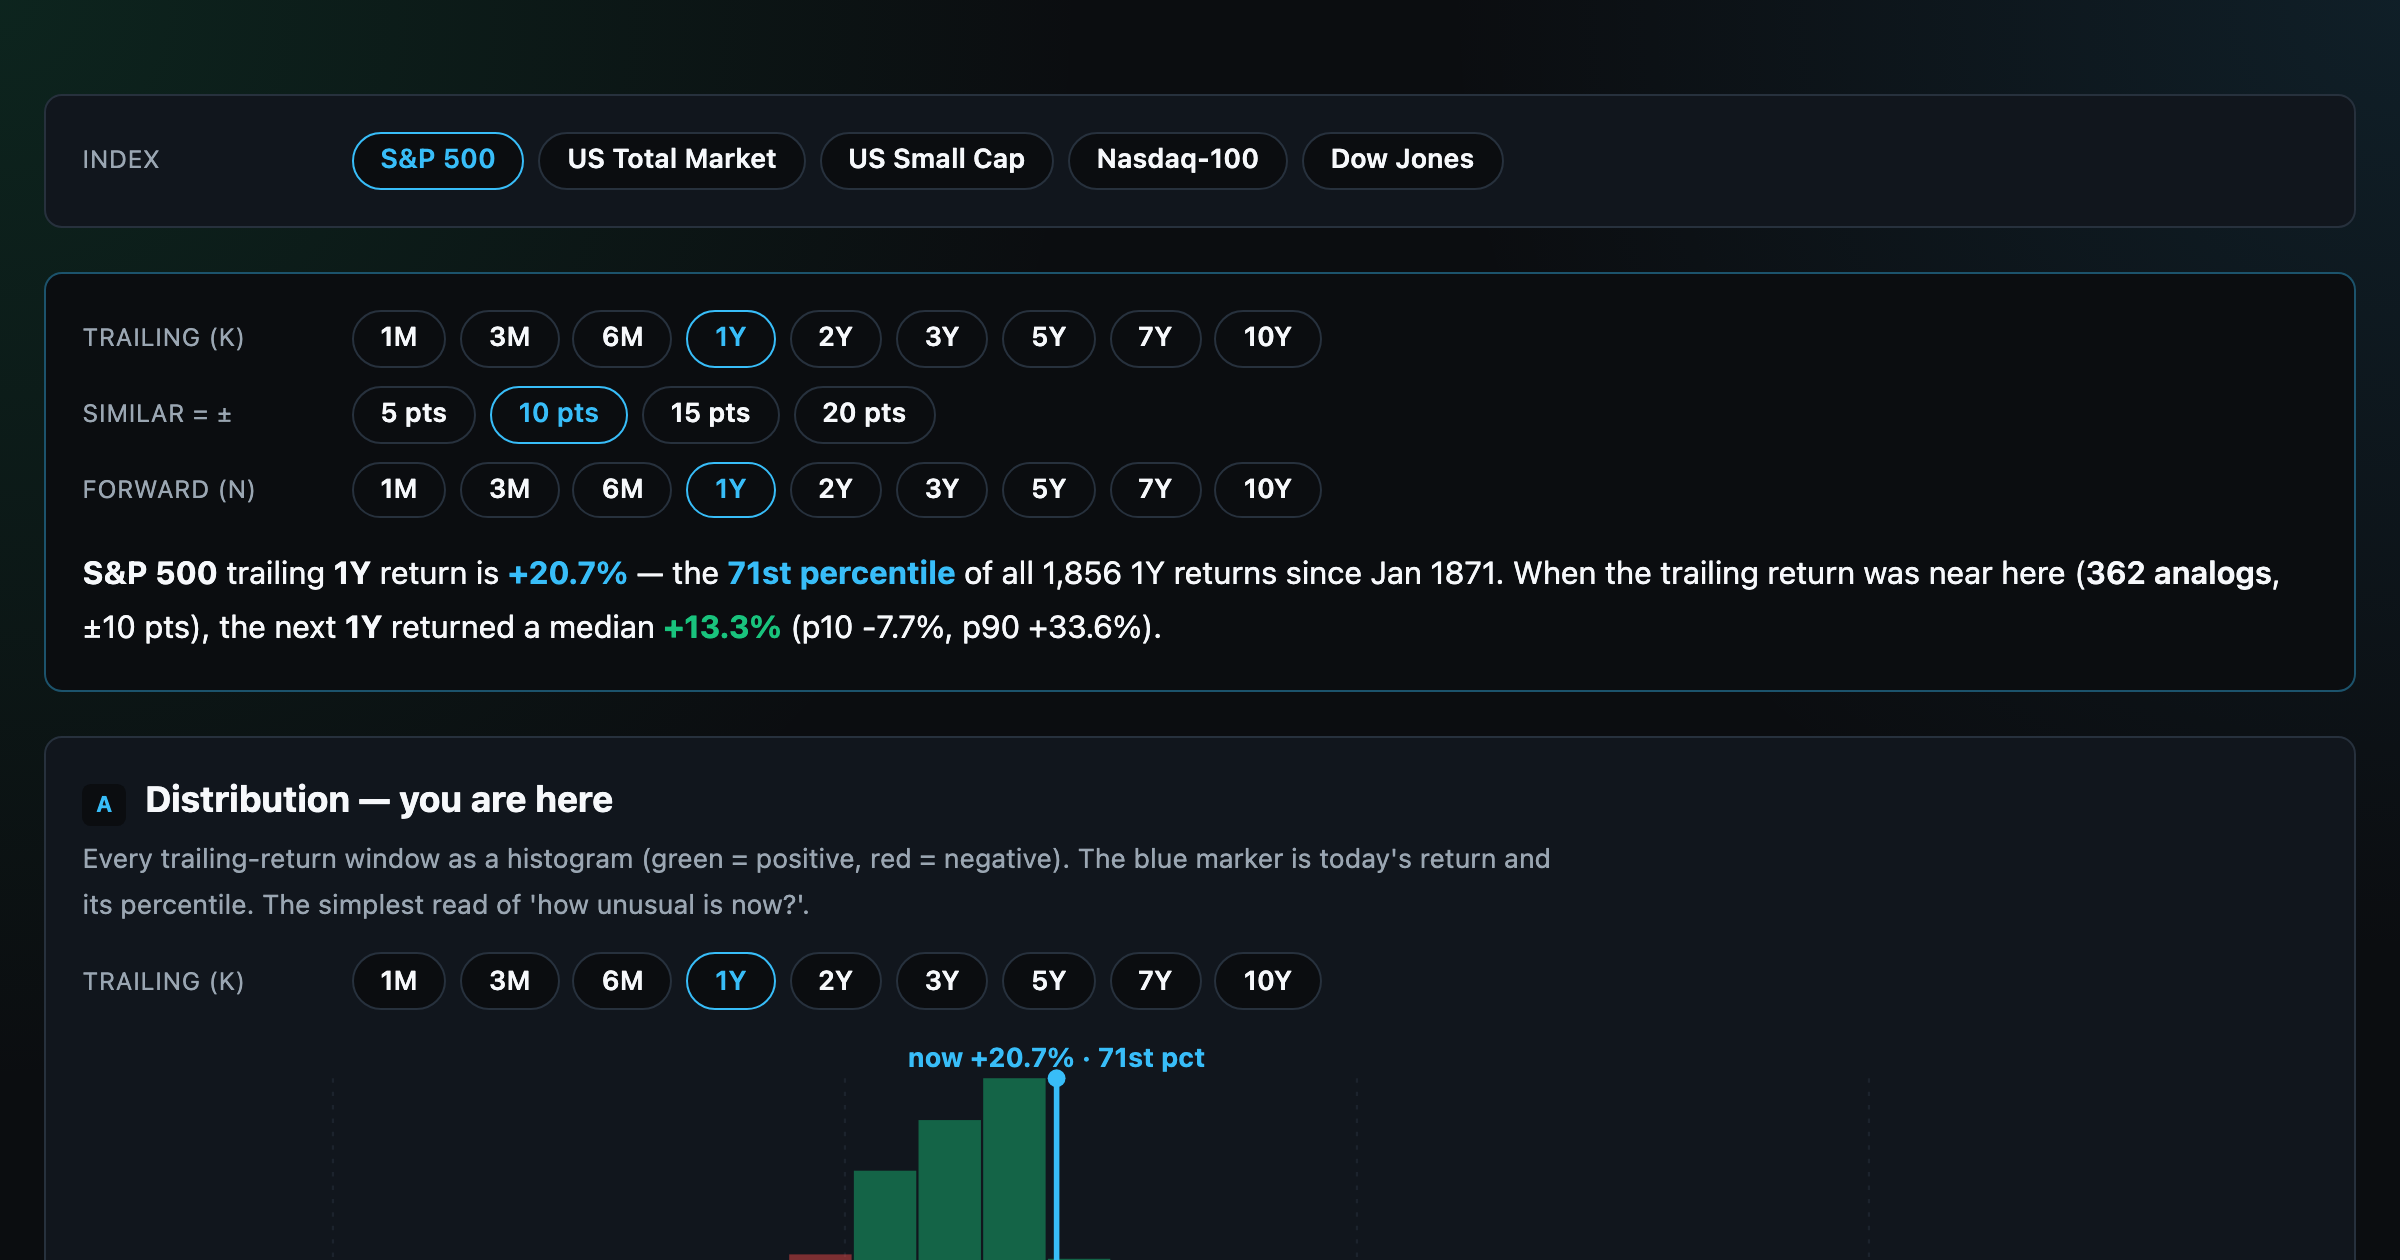
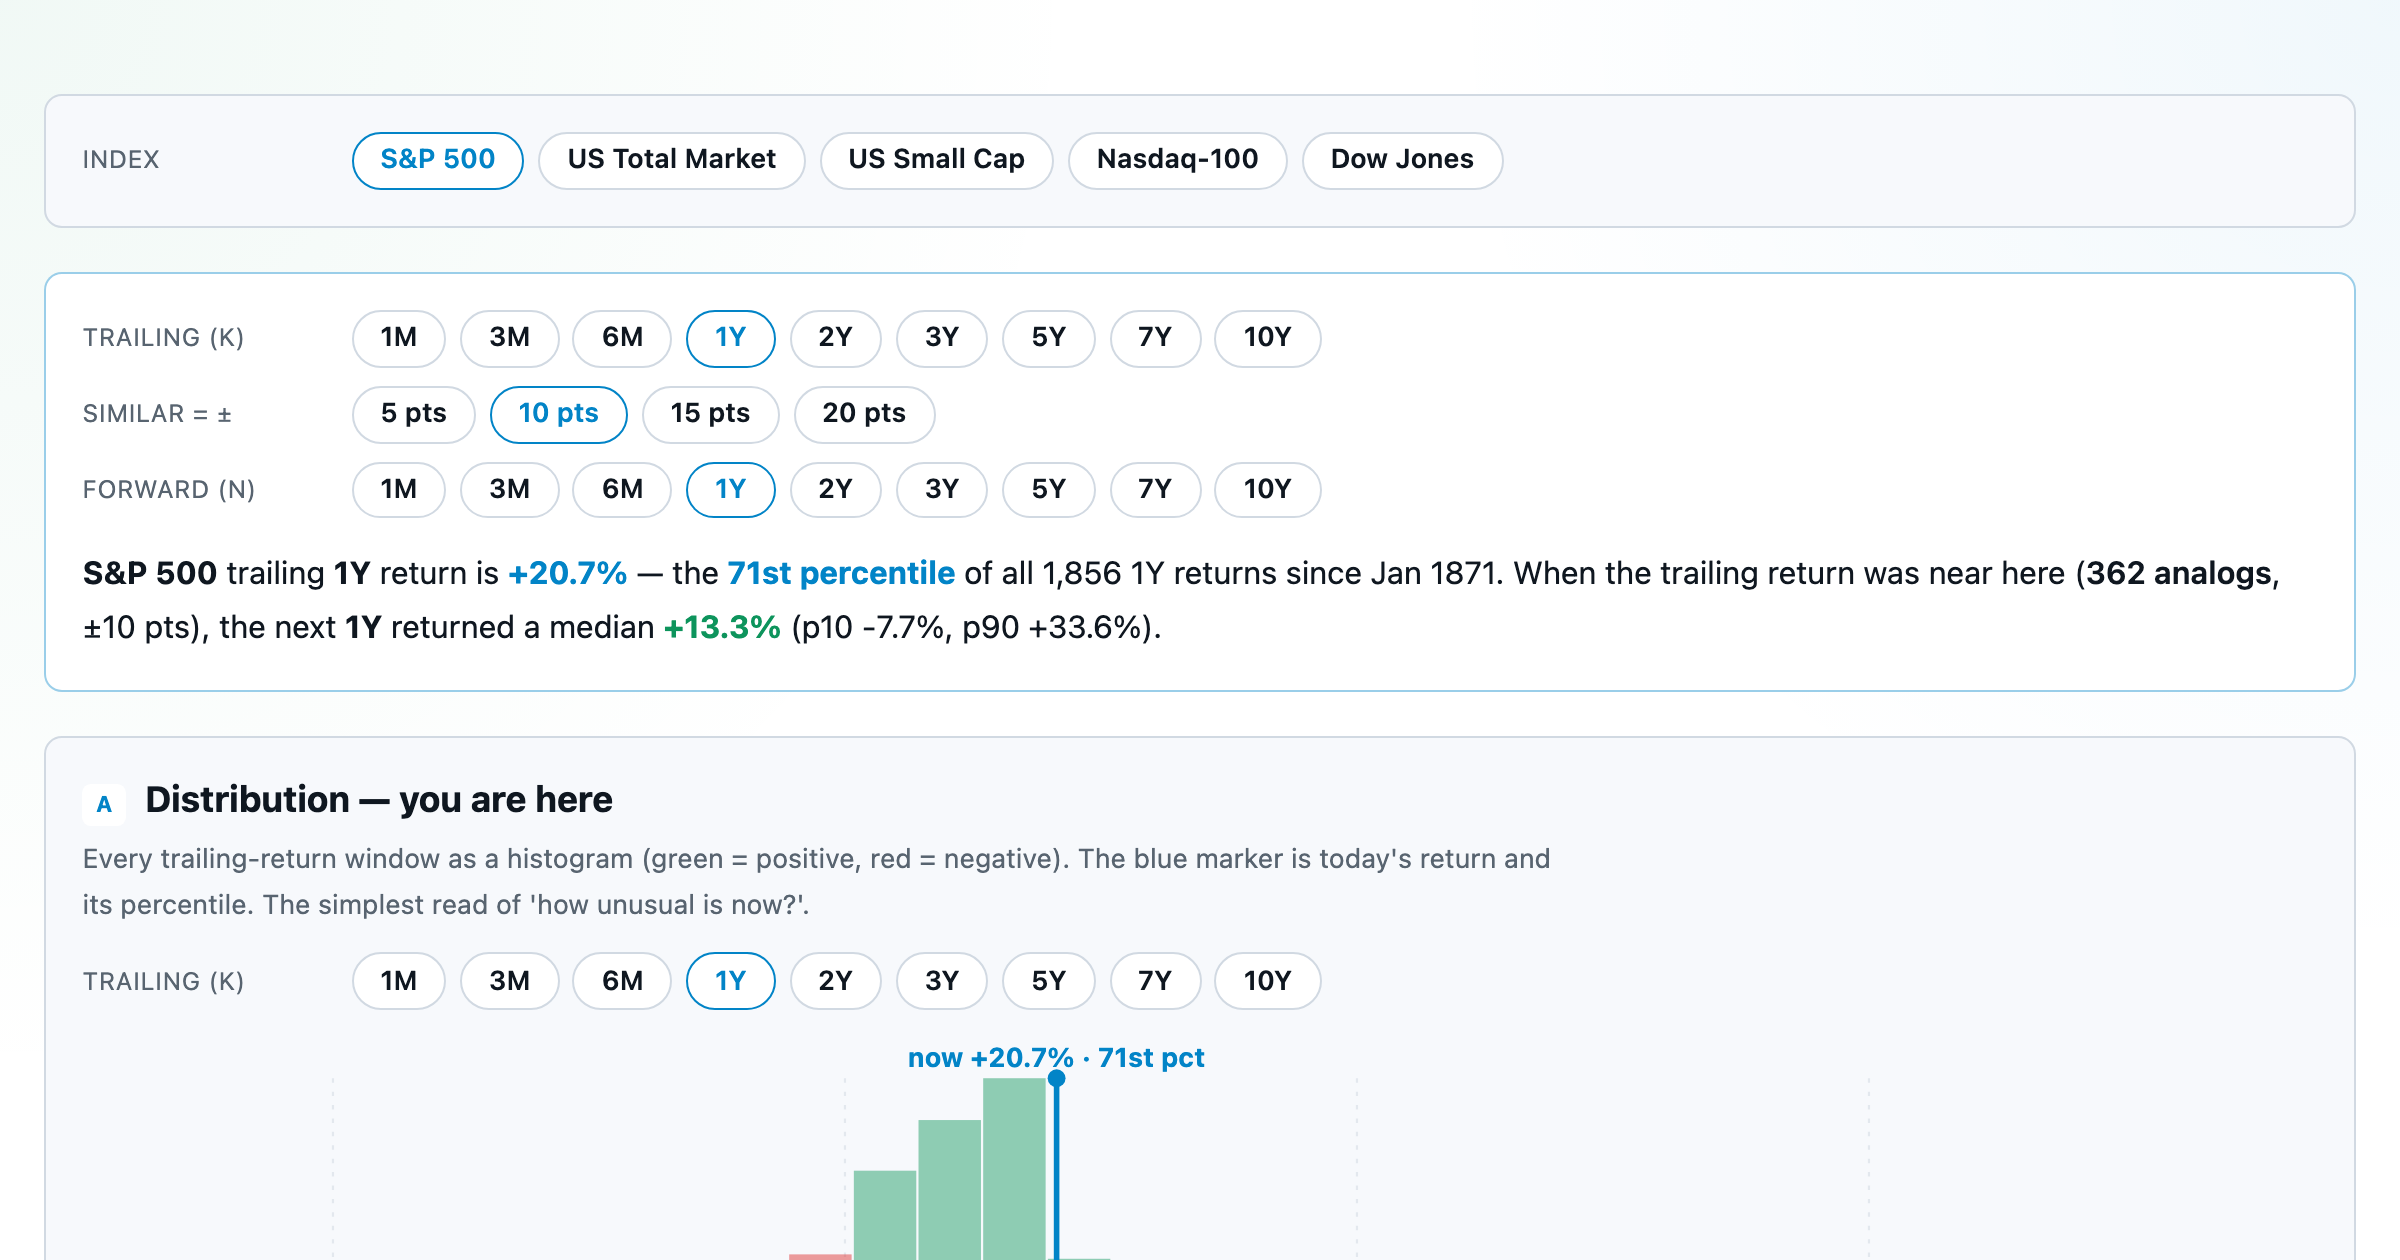
Where today's S&P 500 return ranks against all history — and the forward returns that followed similar moments.
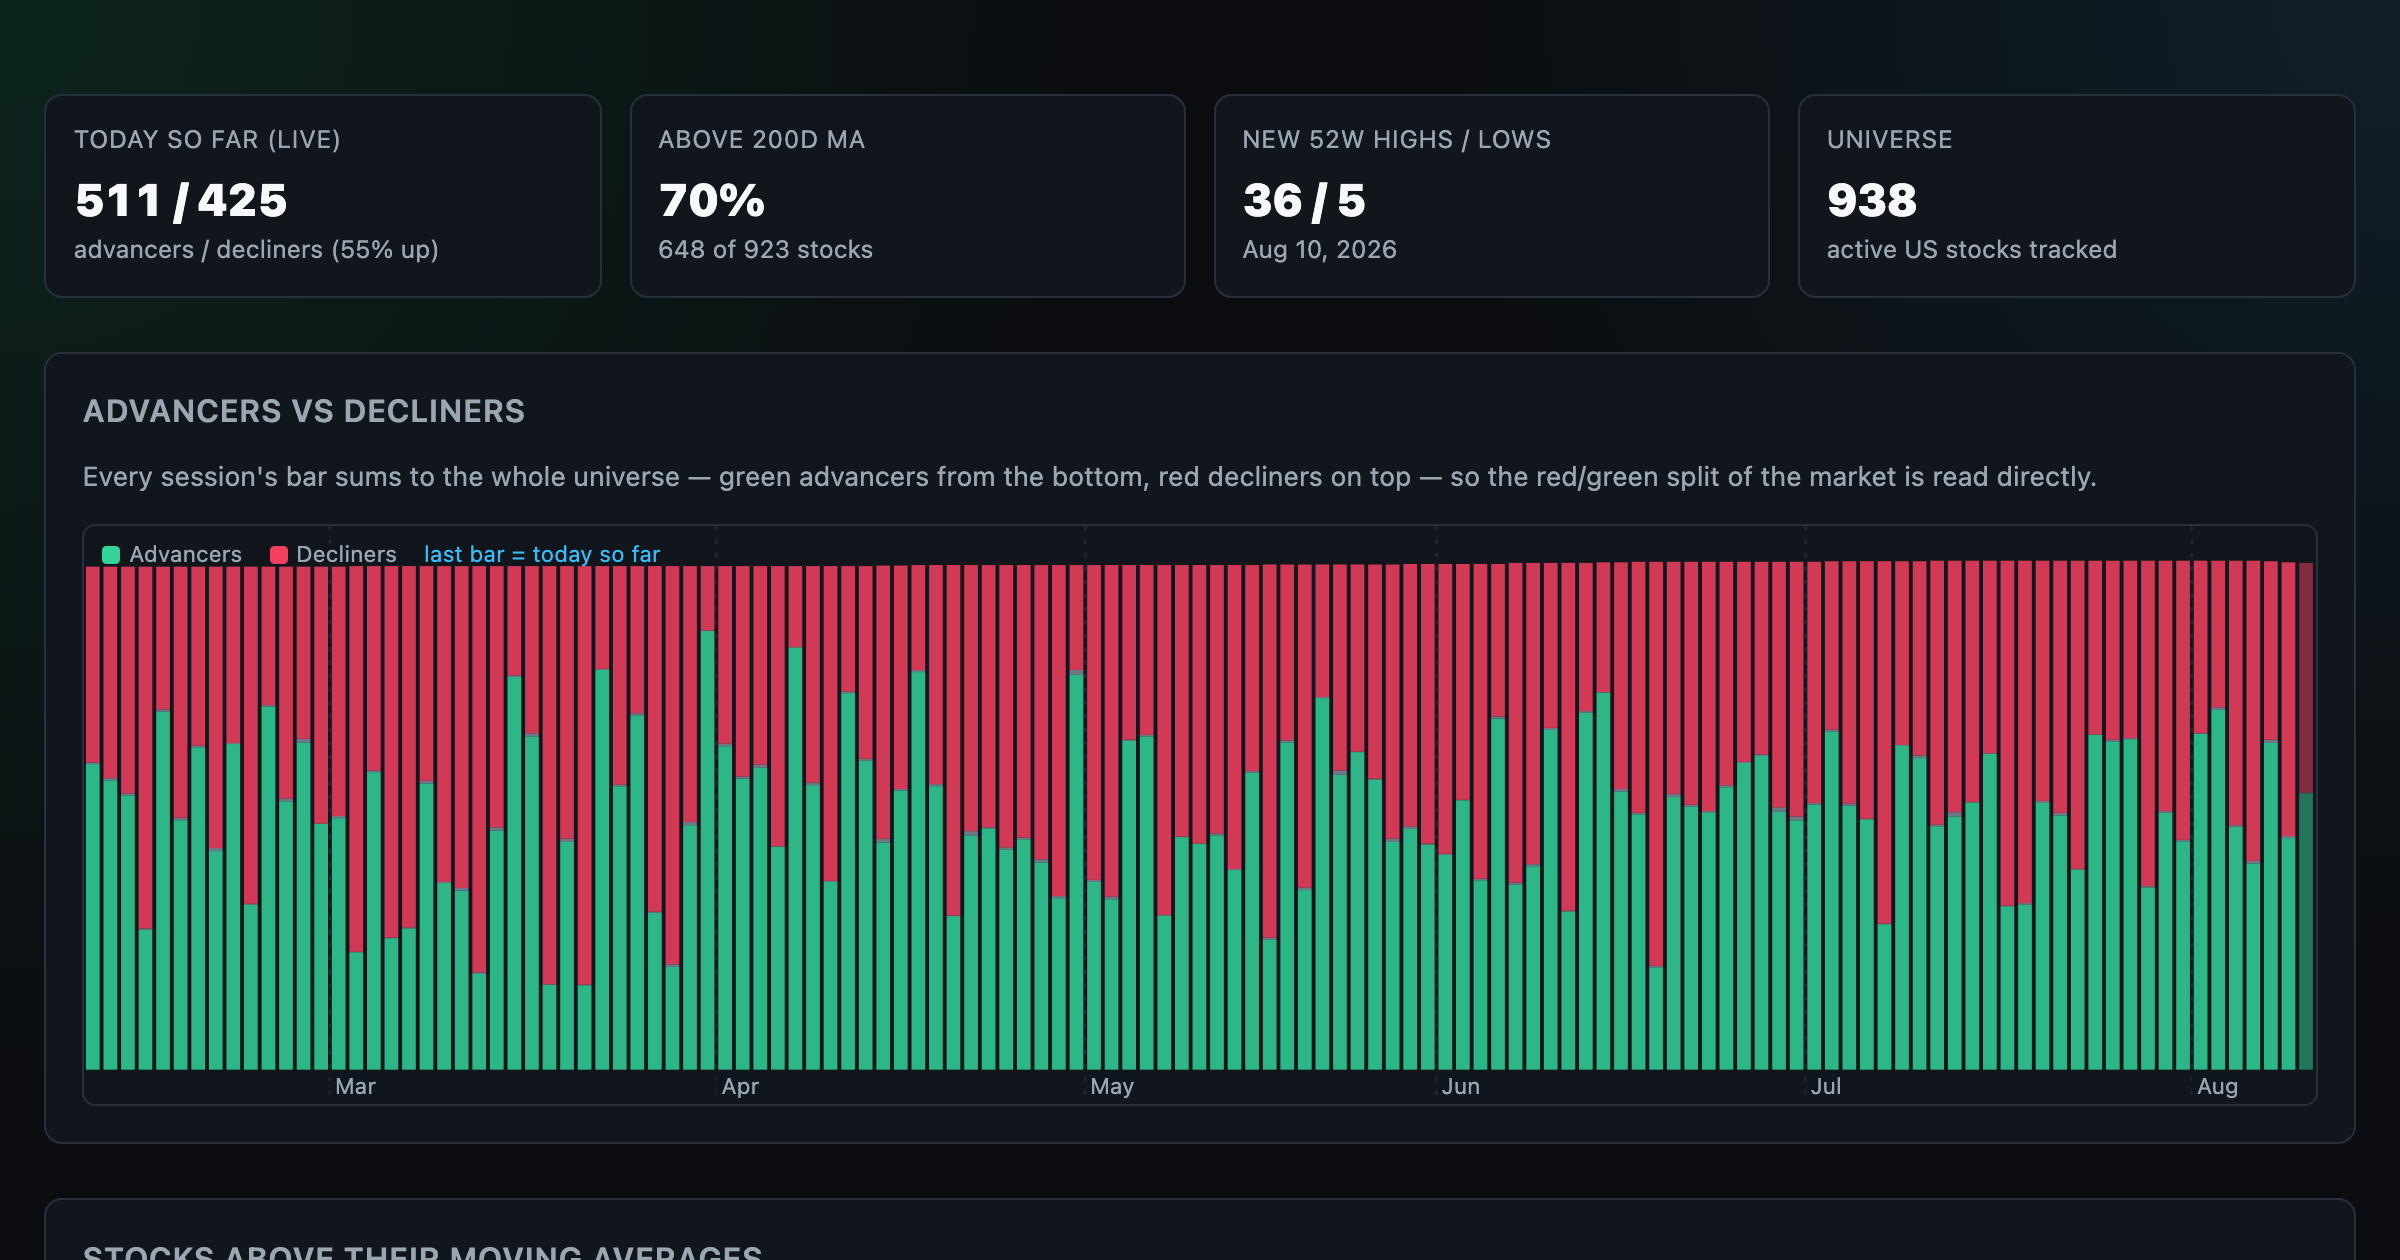
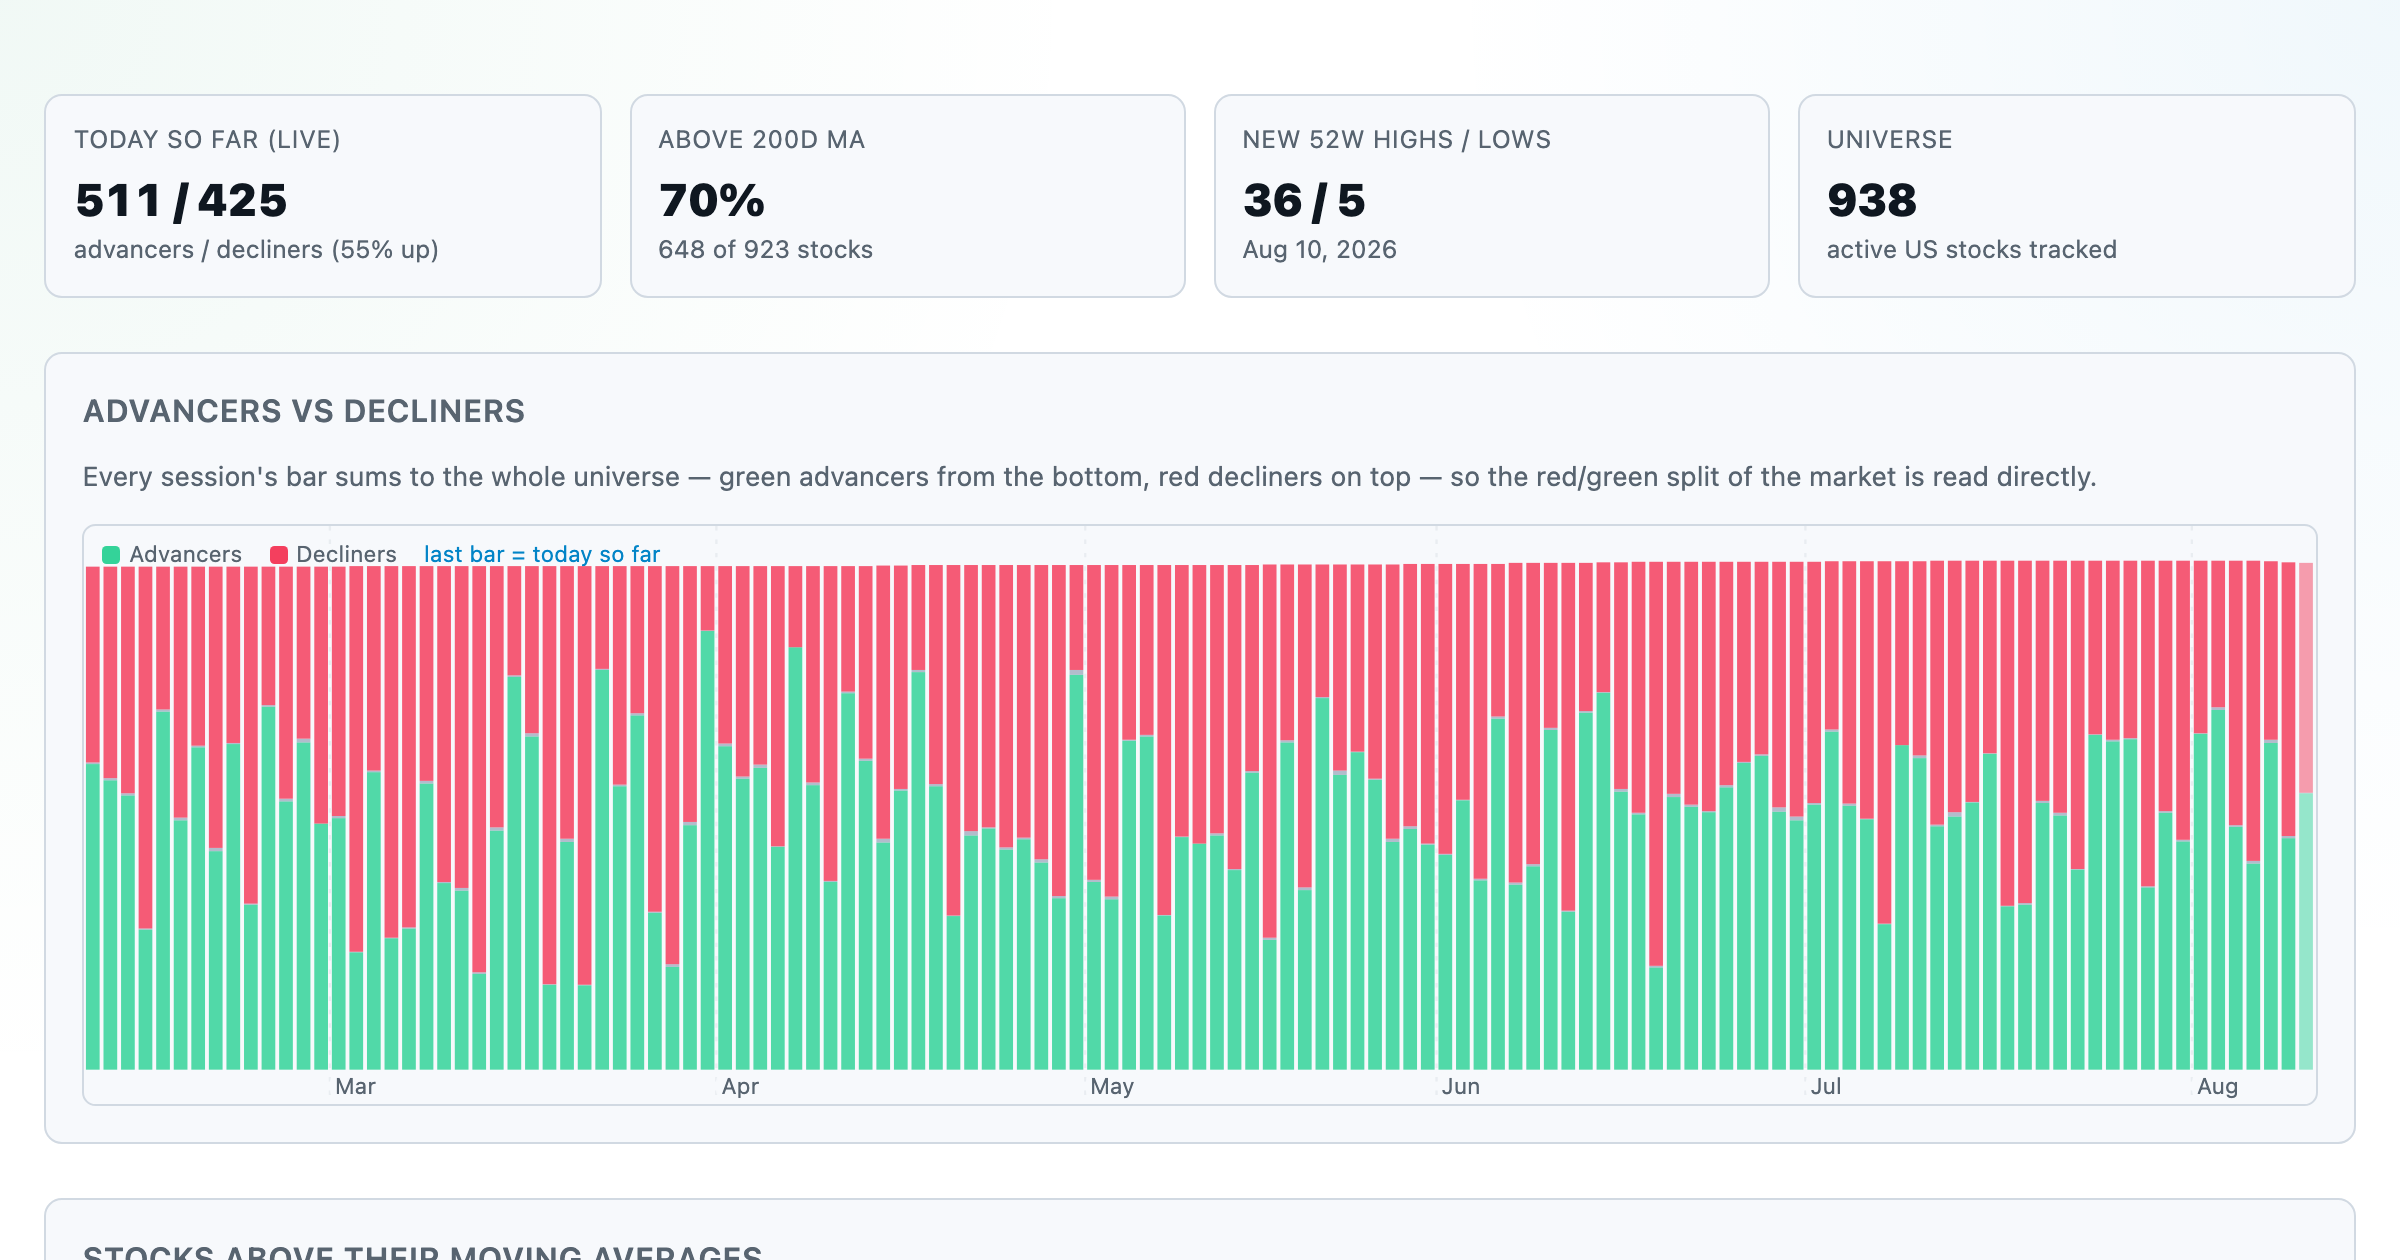
Advancers vs decliners over time, % of stocks above their moving averages, new highs vs lows, and breadth across every trailing window.
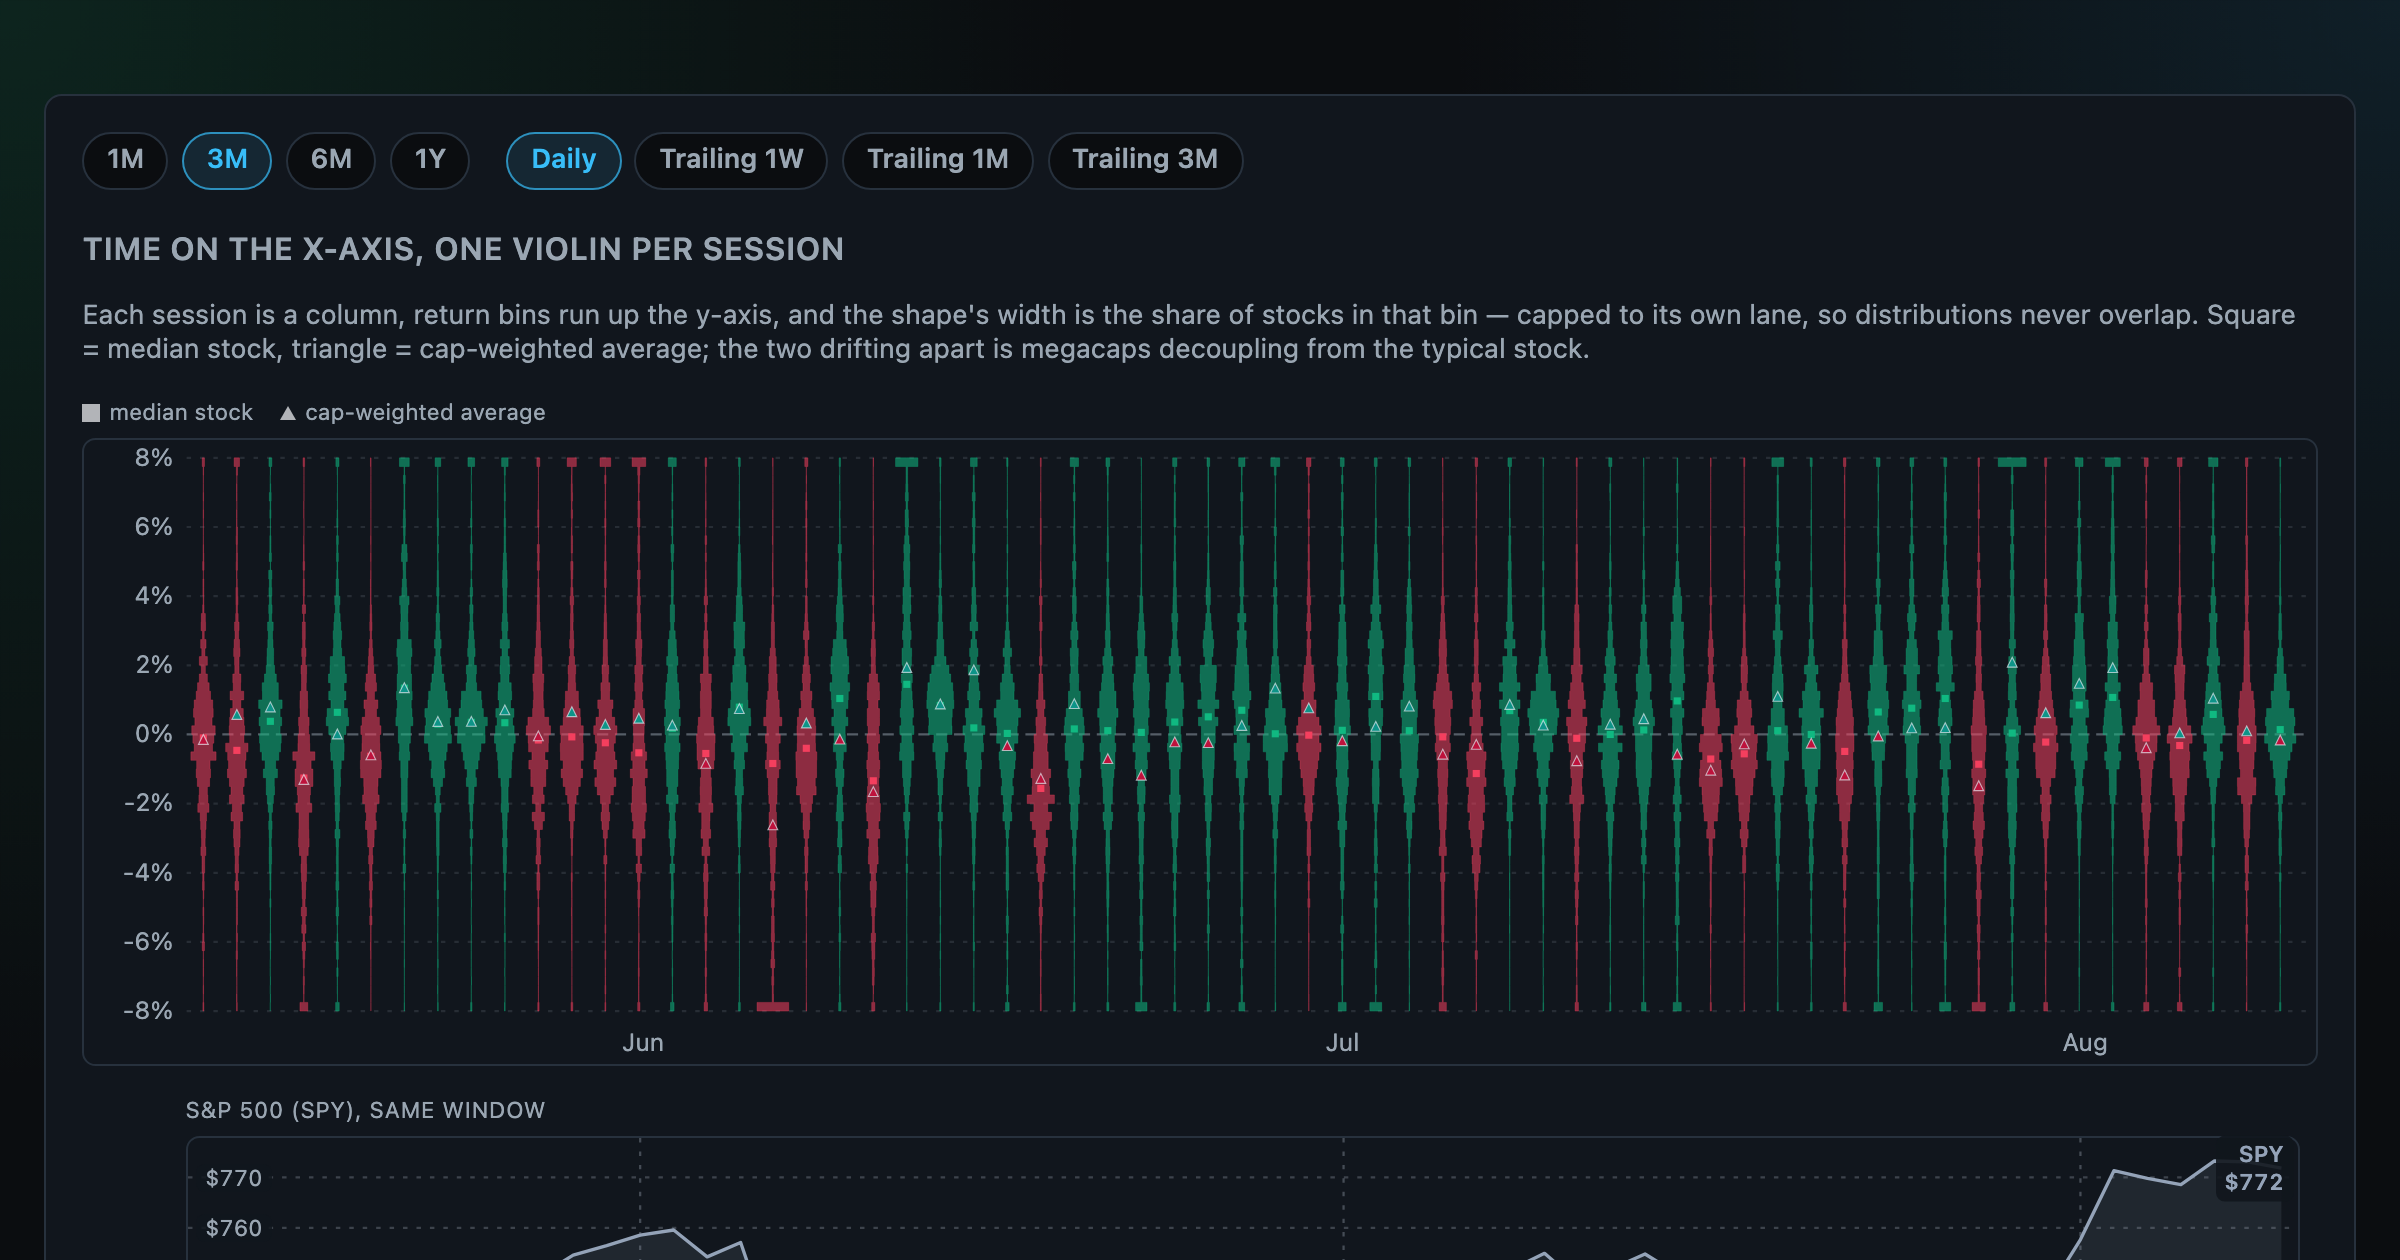
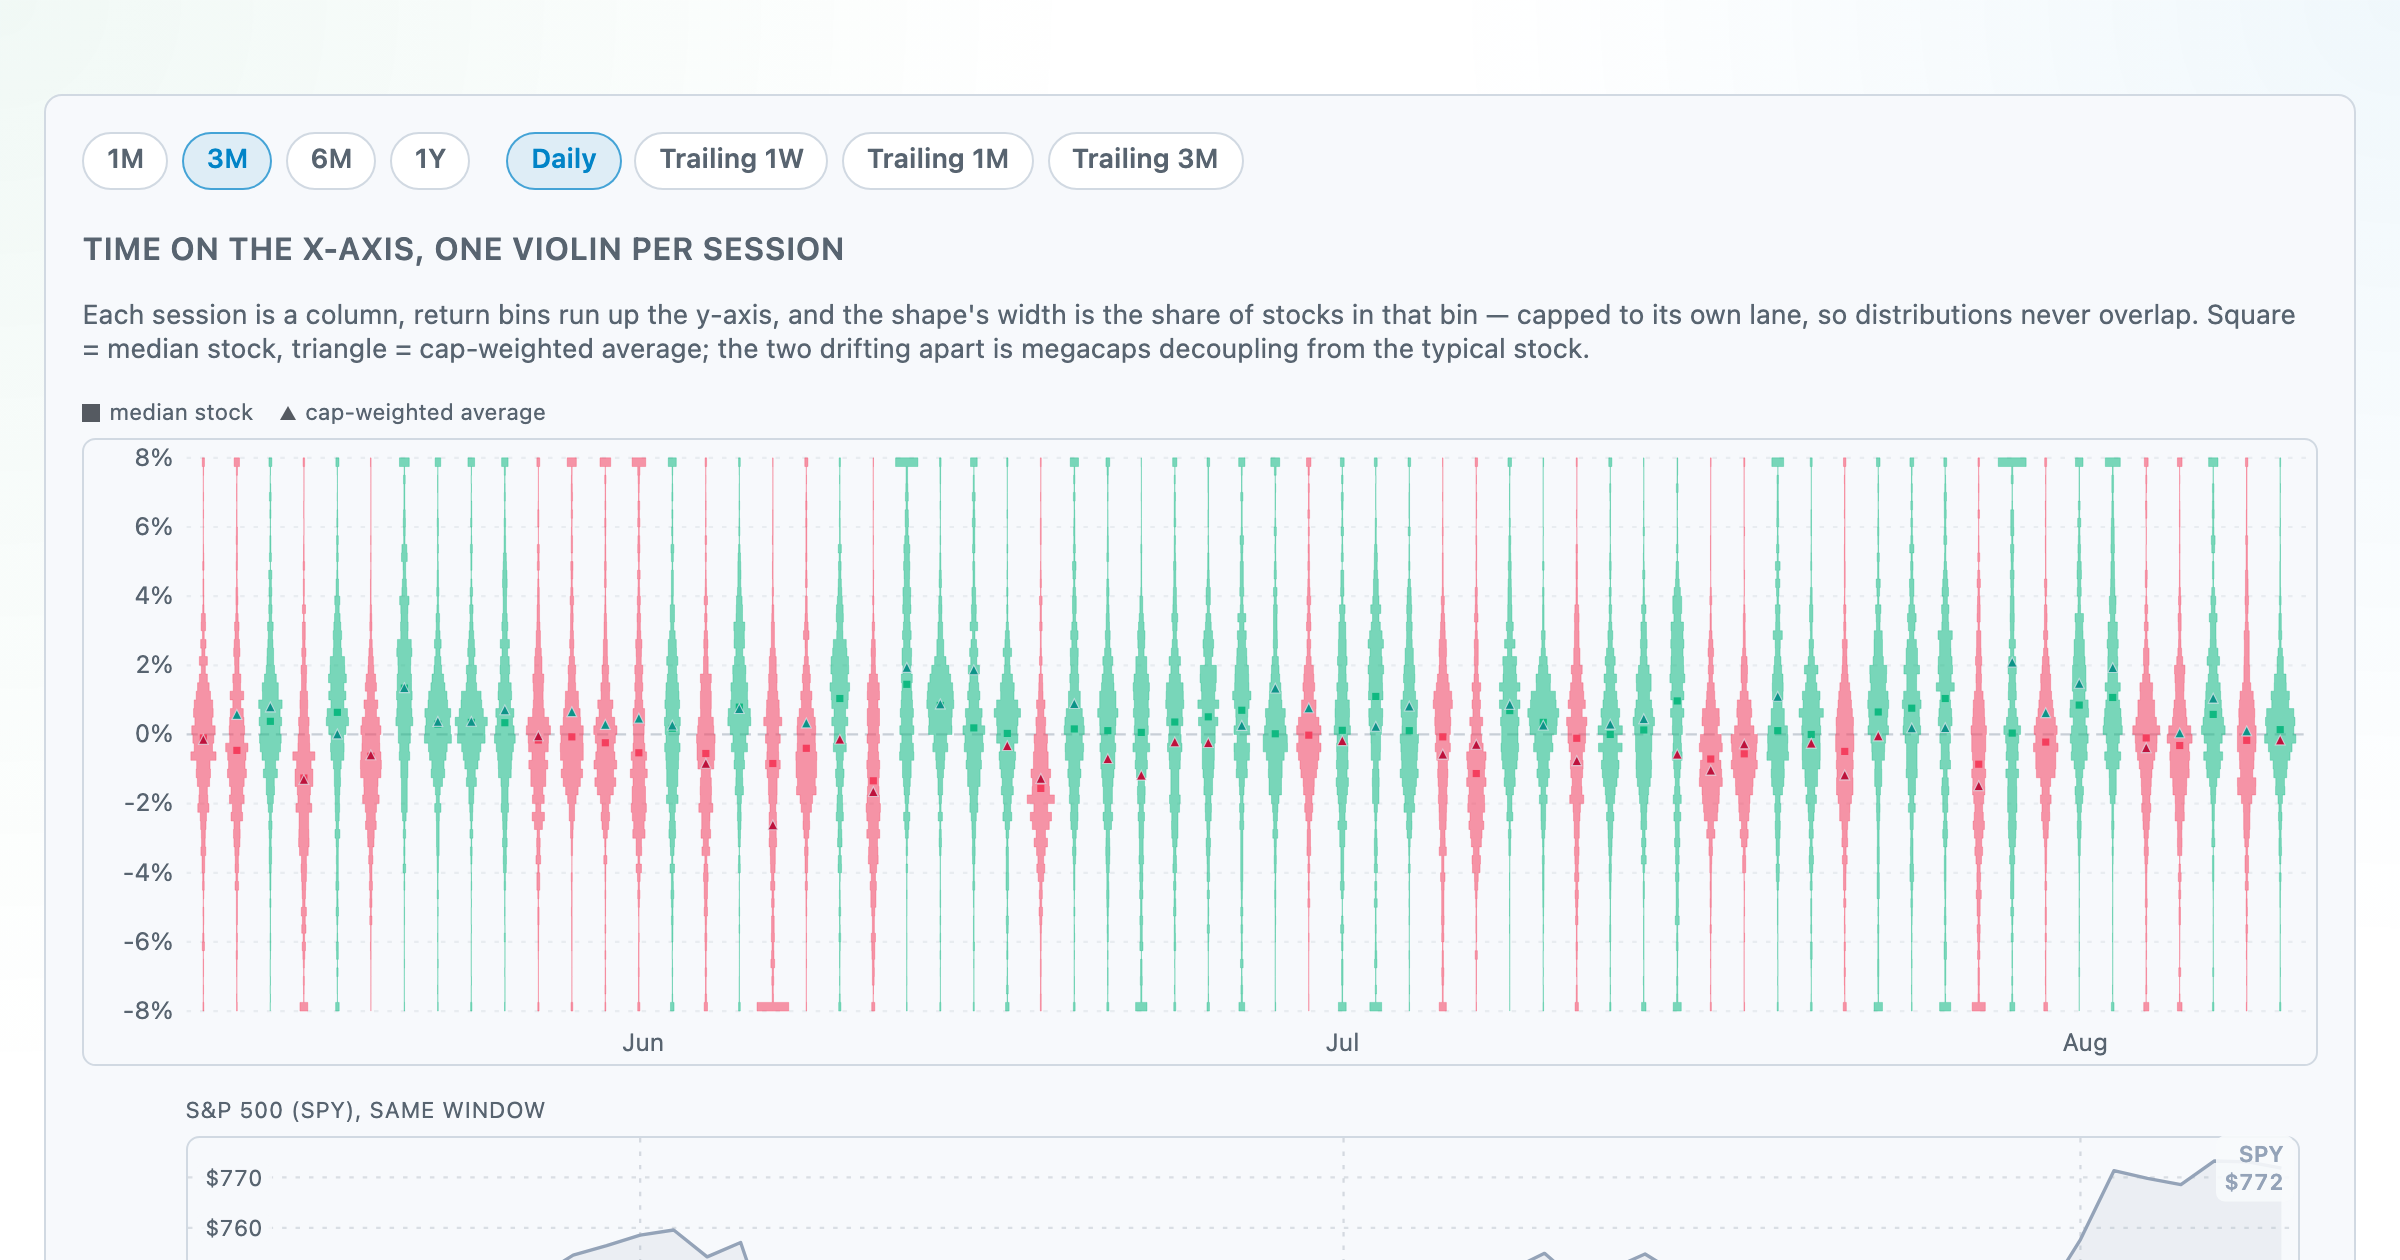
Each session's full distribution of stock returns as an upright violin, with the S&P 500 on the same axis — shifts, dispersion, and fat tails at a glance.
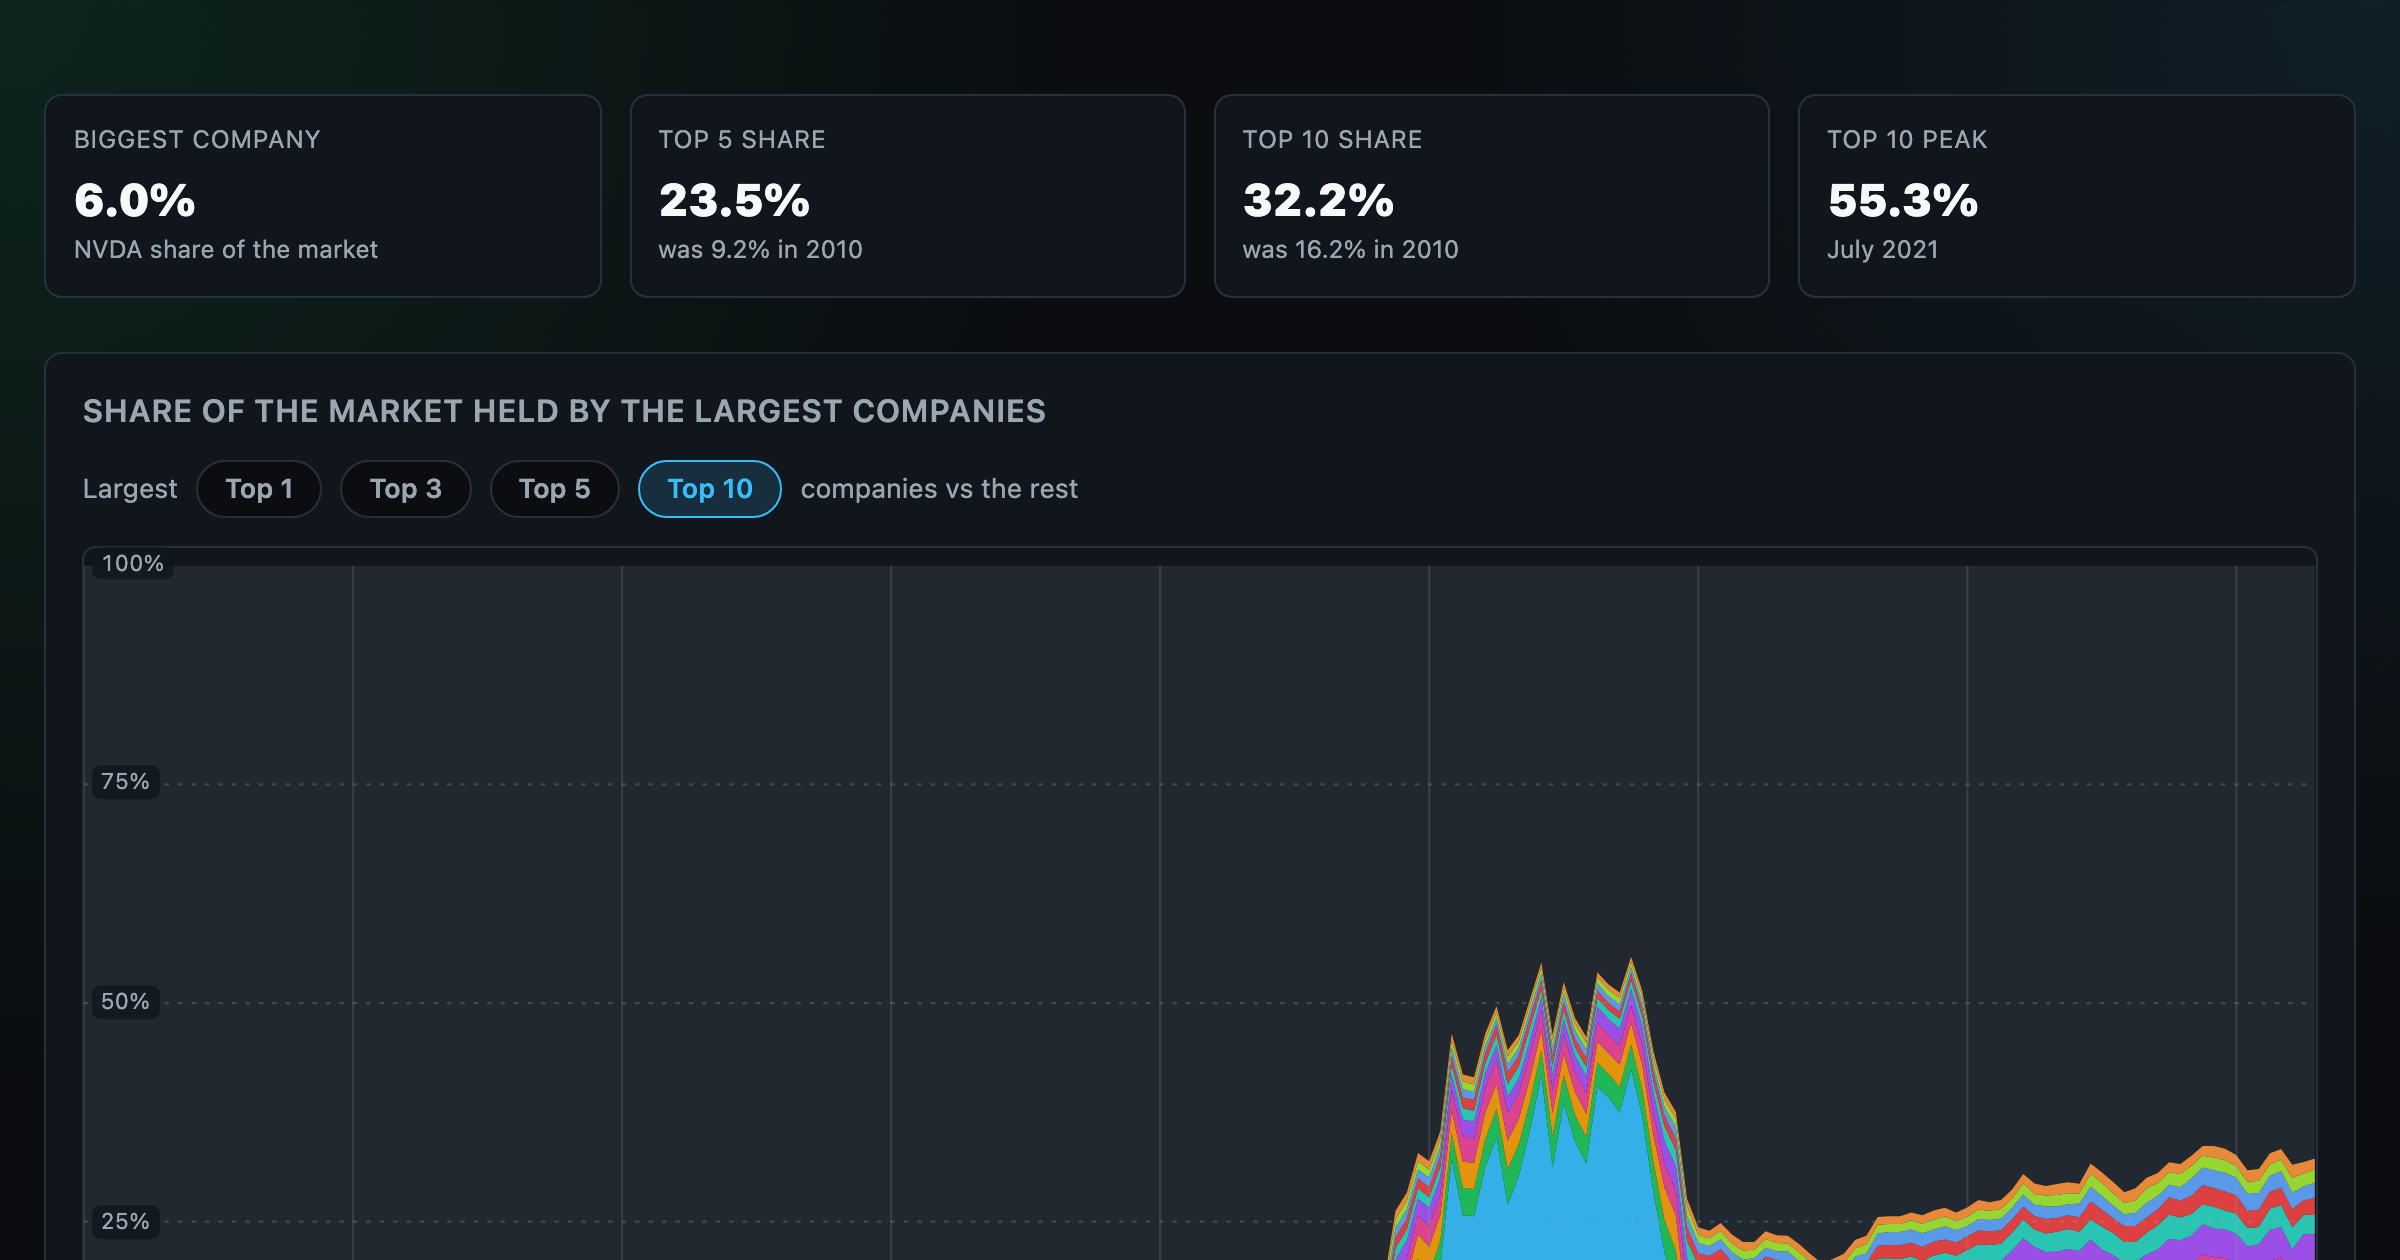
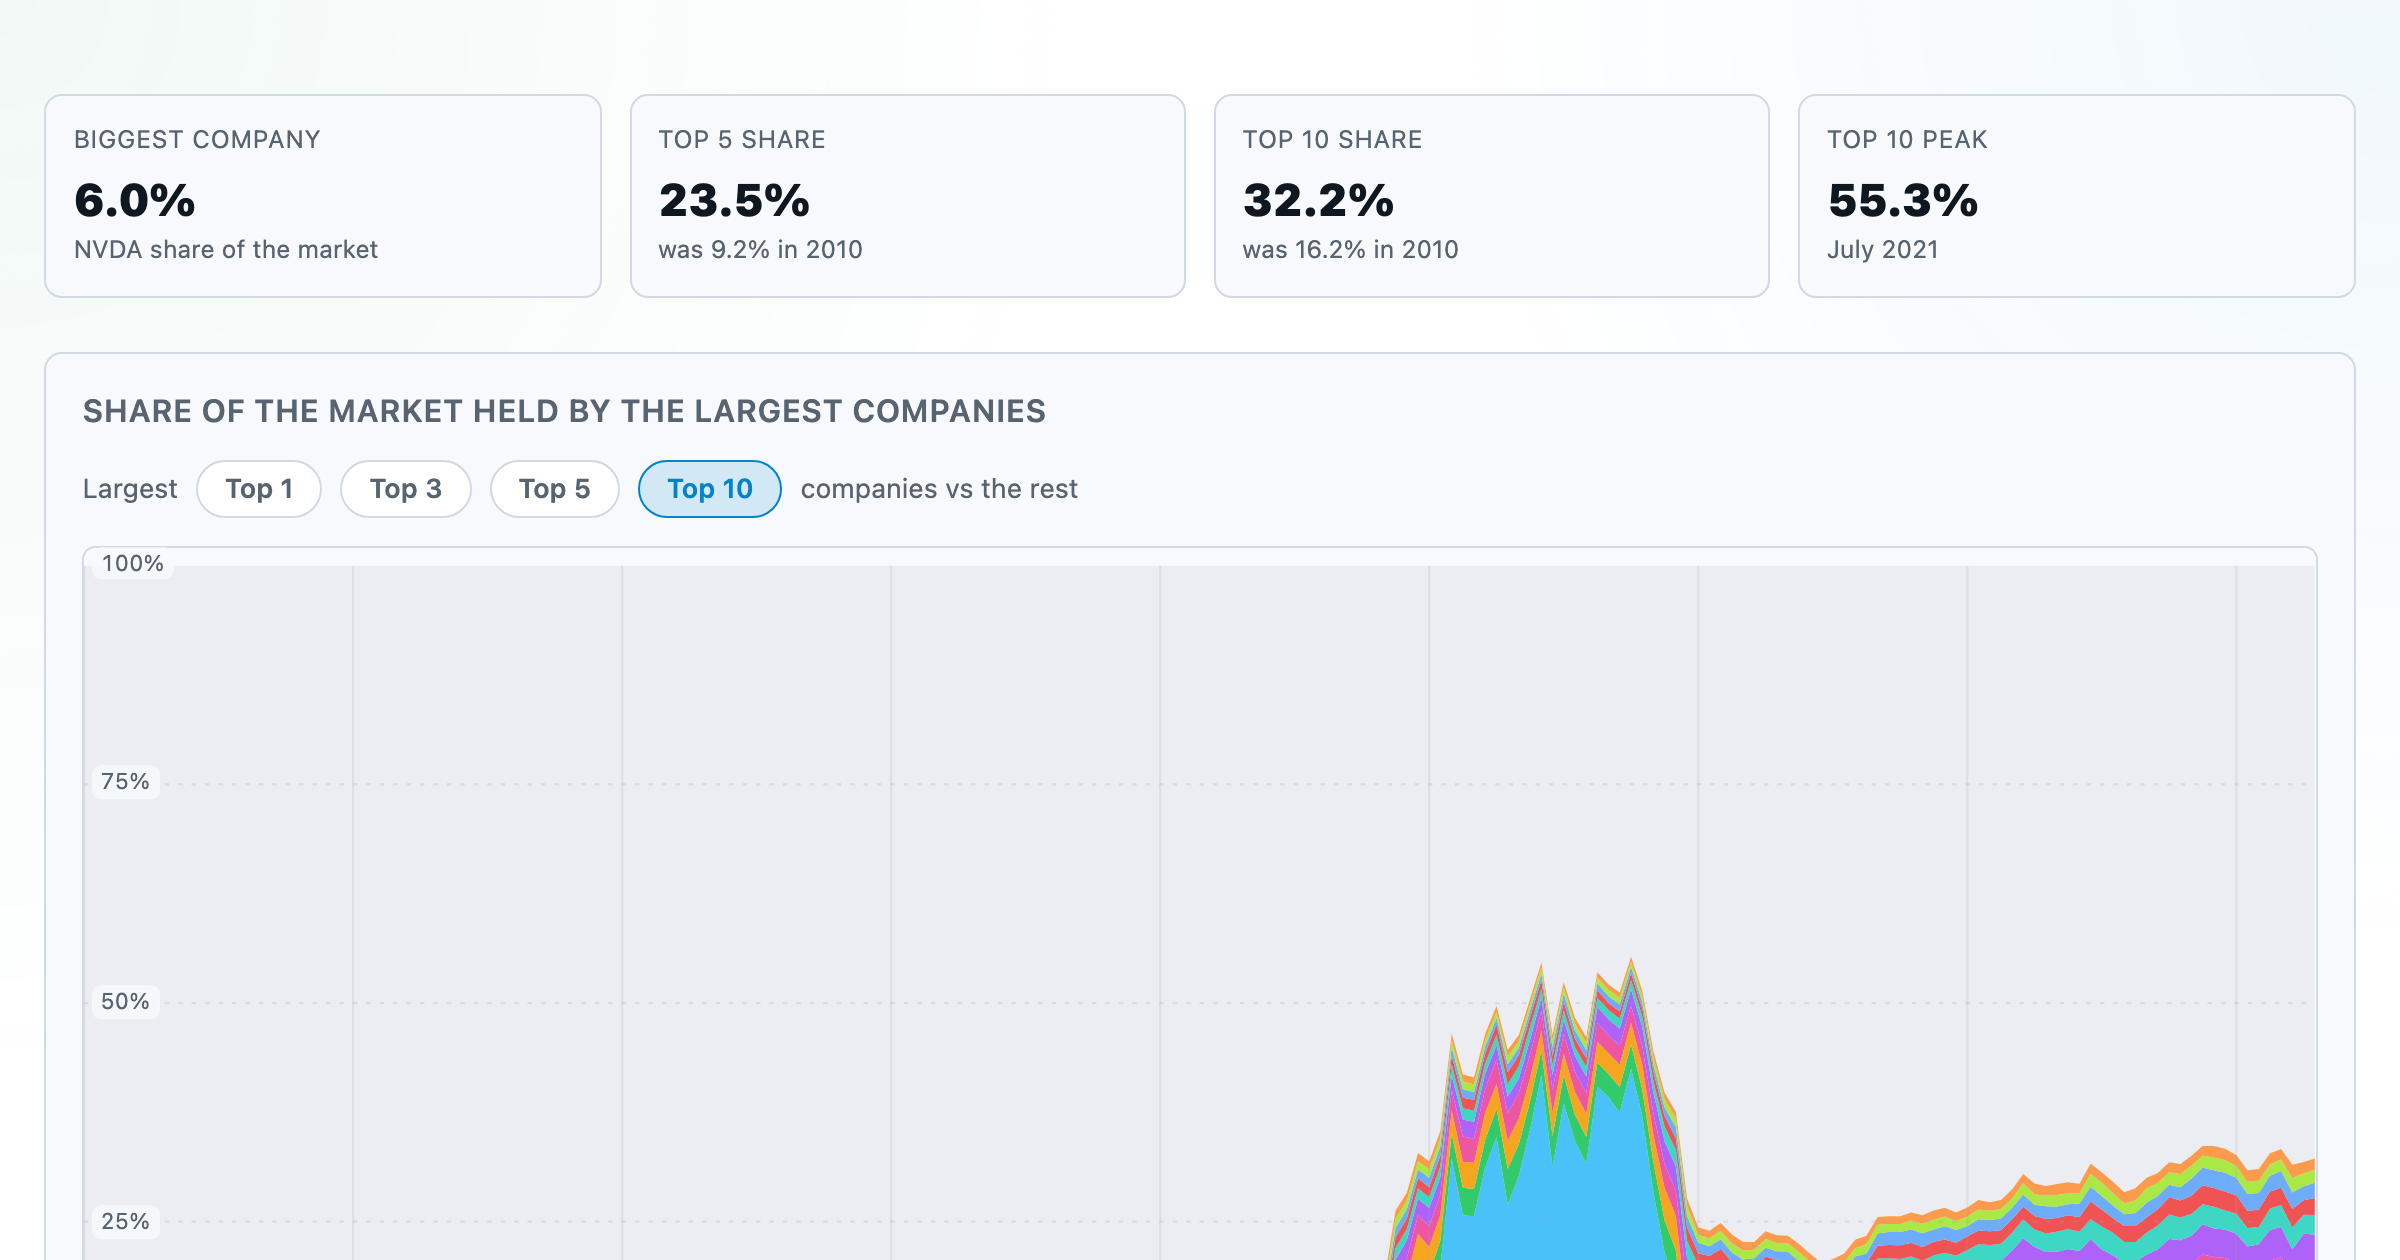
How top-heavy is the market? The top 1–10 companies' share of total market value, month by month since 2010.
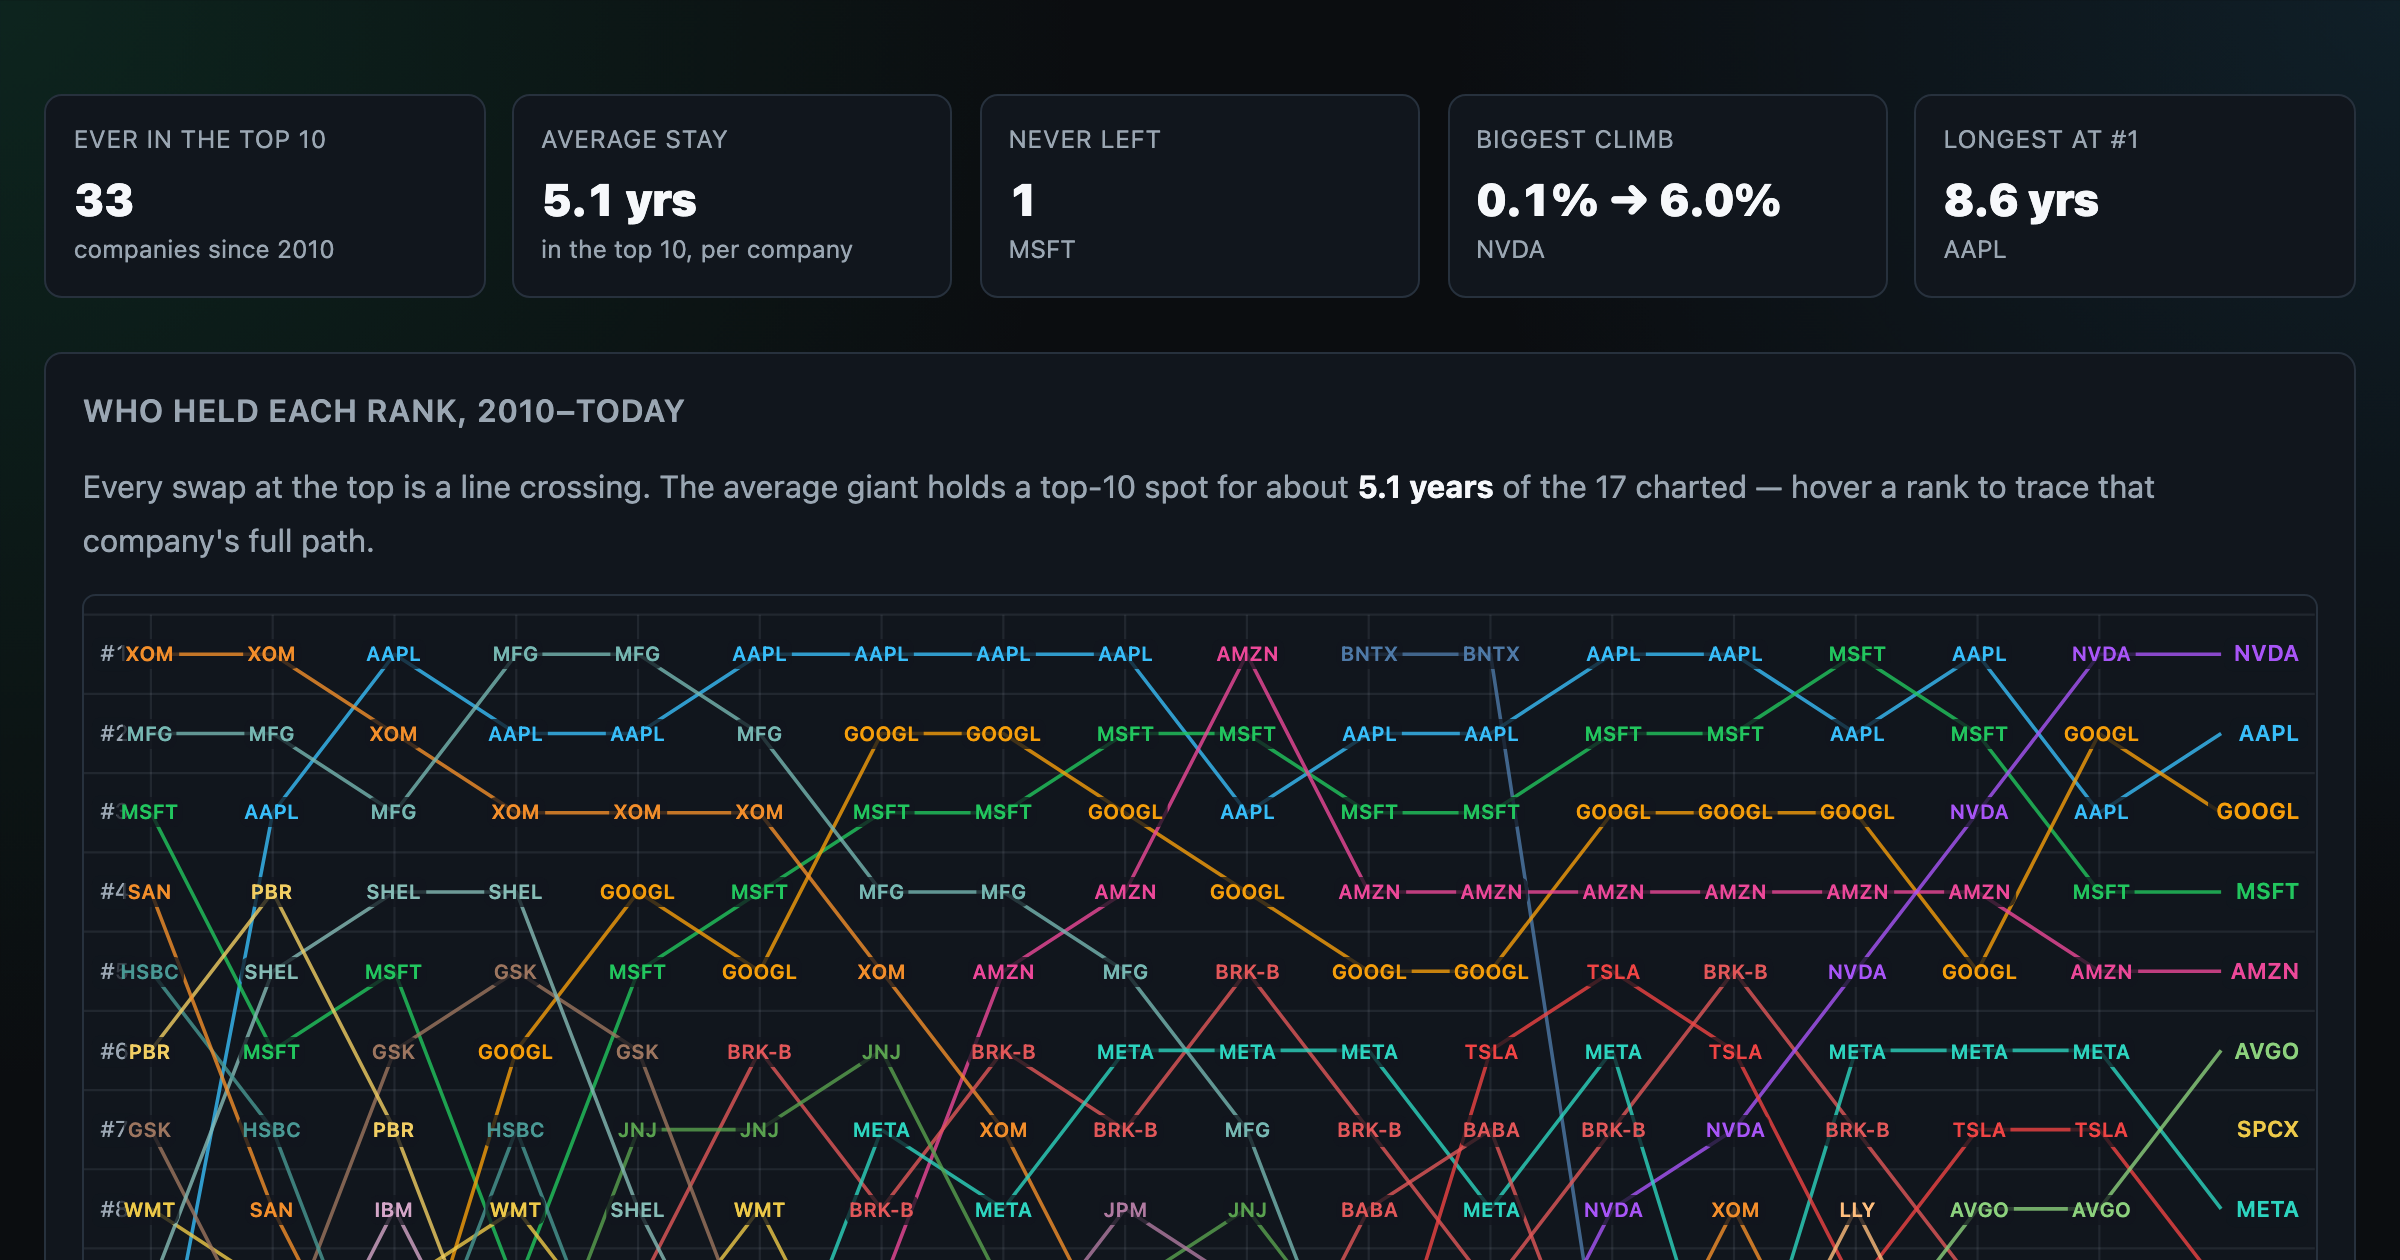
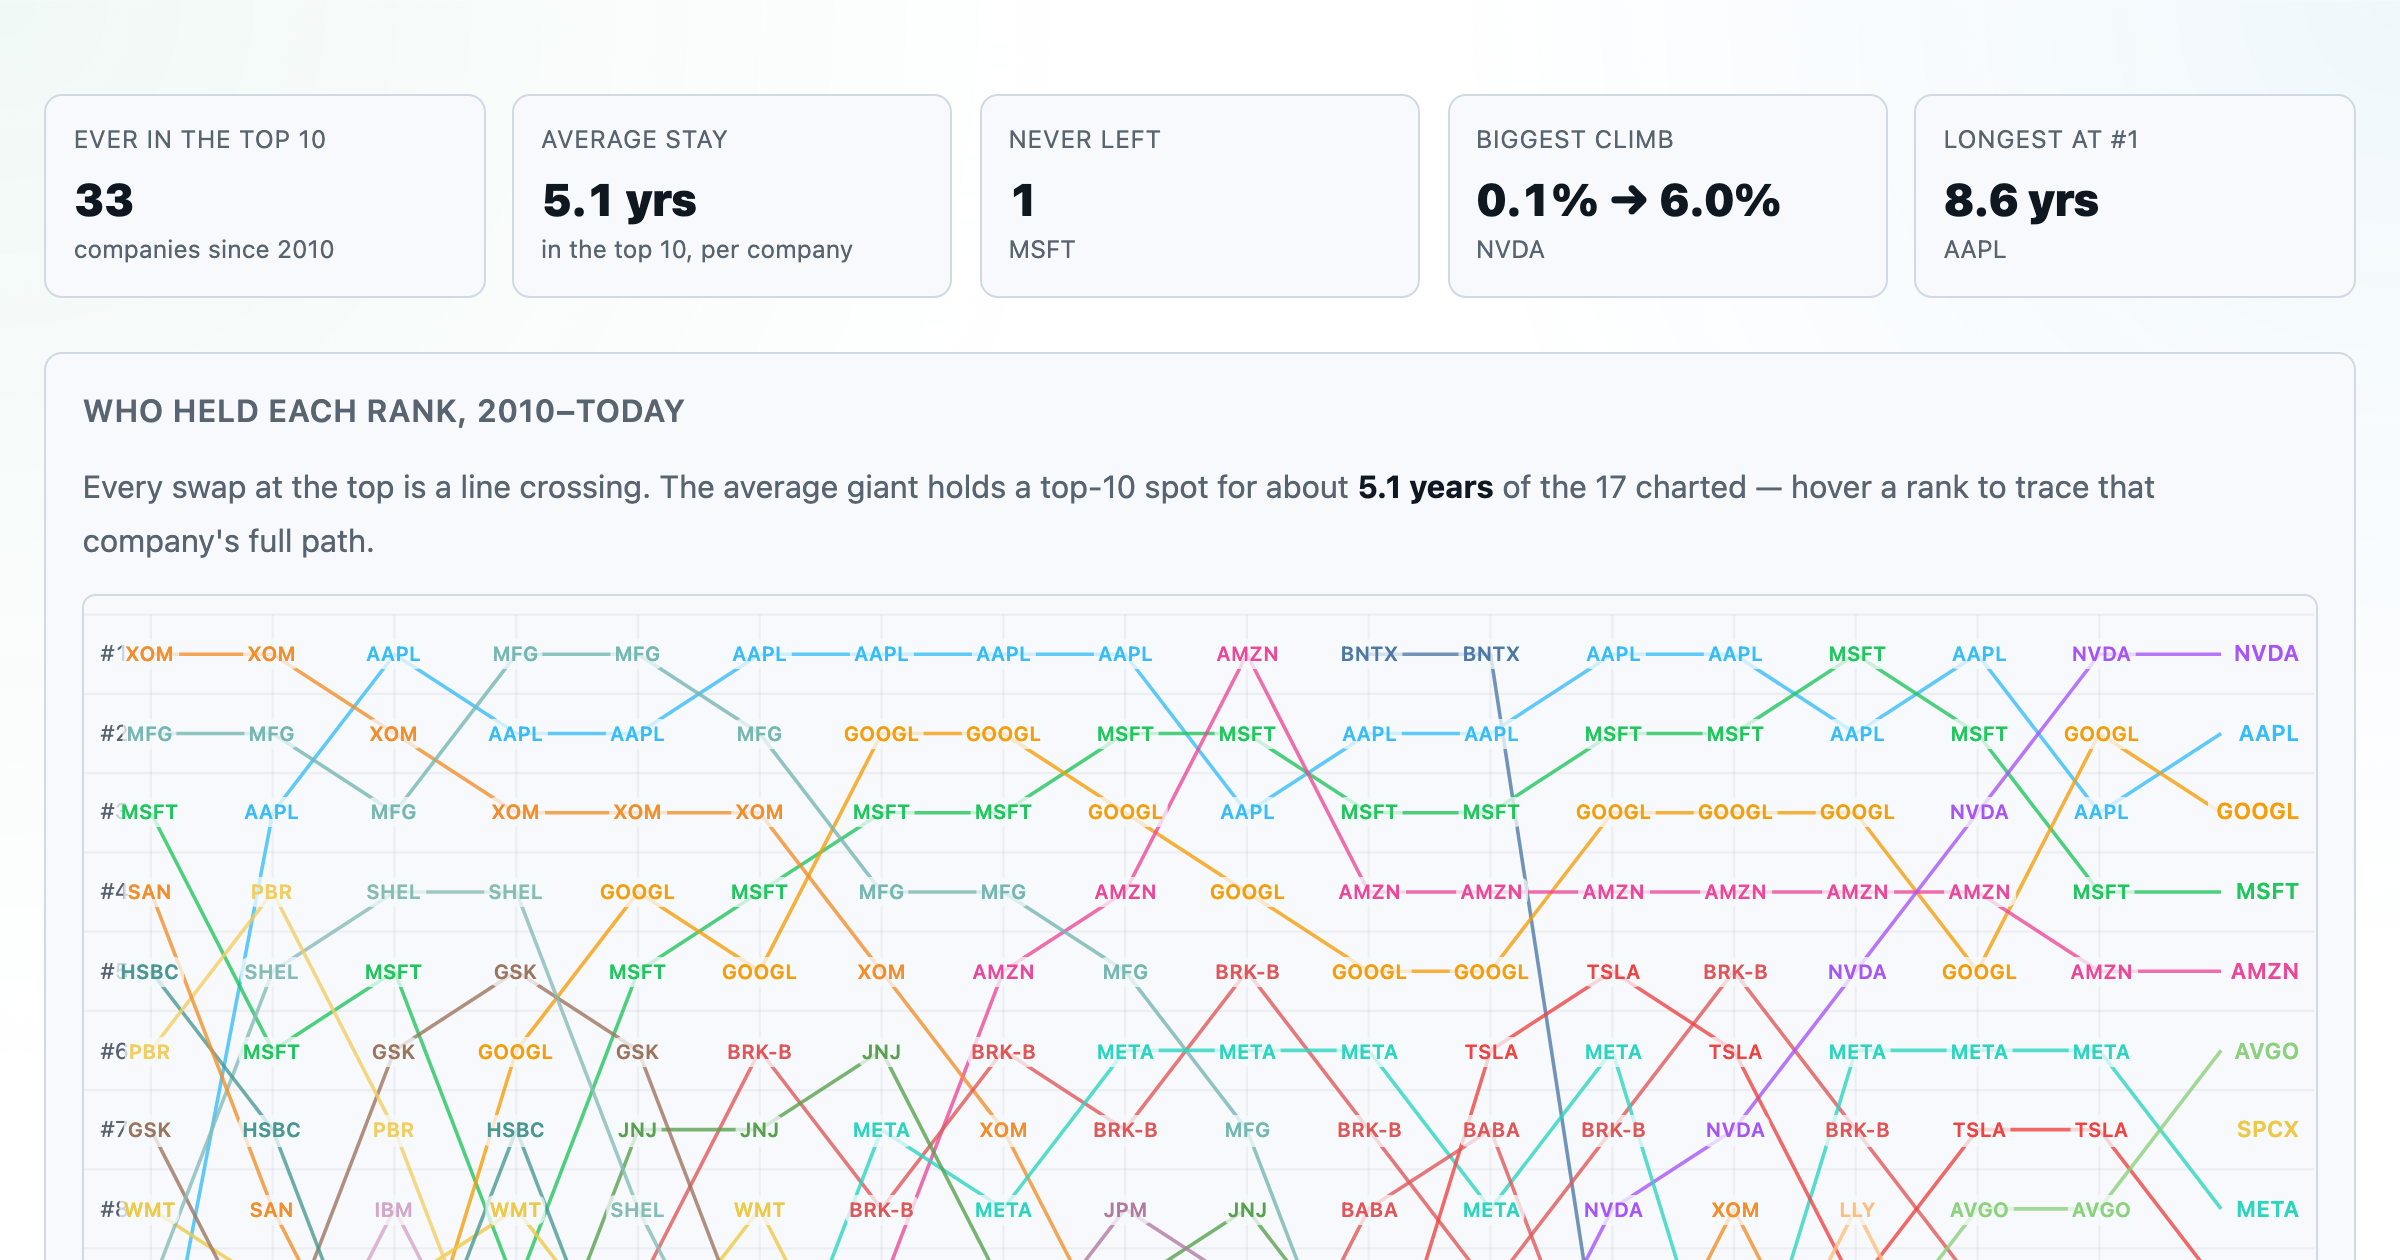
Every company that ever cracked the market's top 10 since 2010 — who climbed, who faded, who never left.
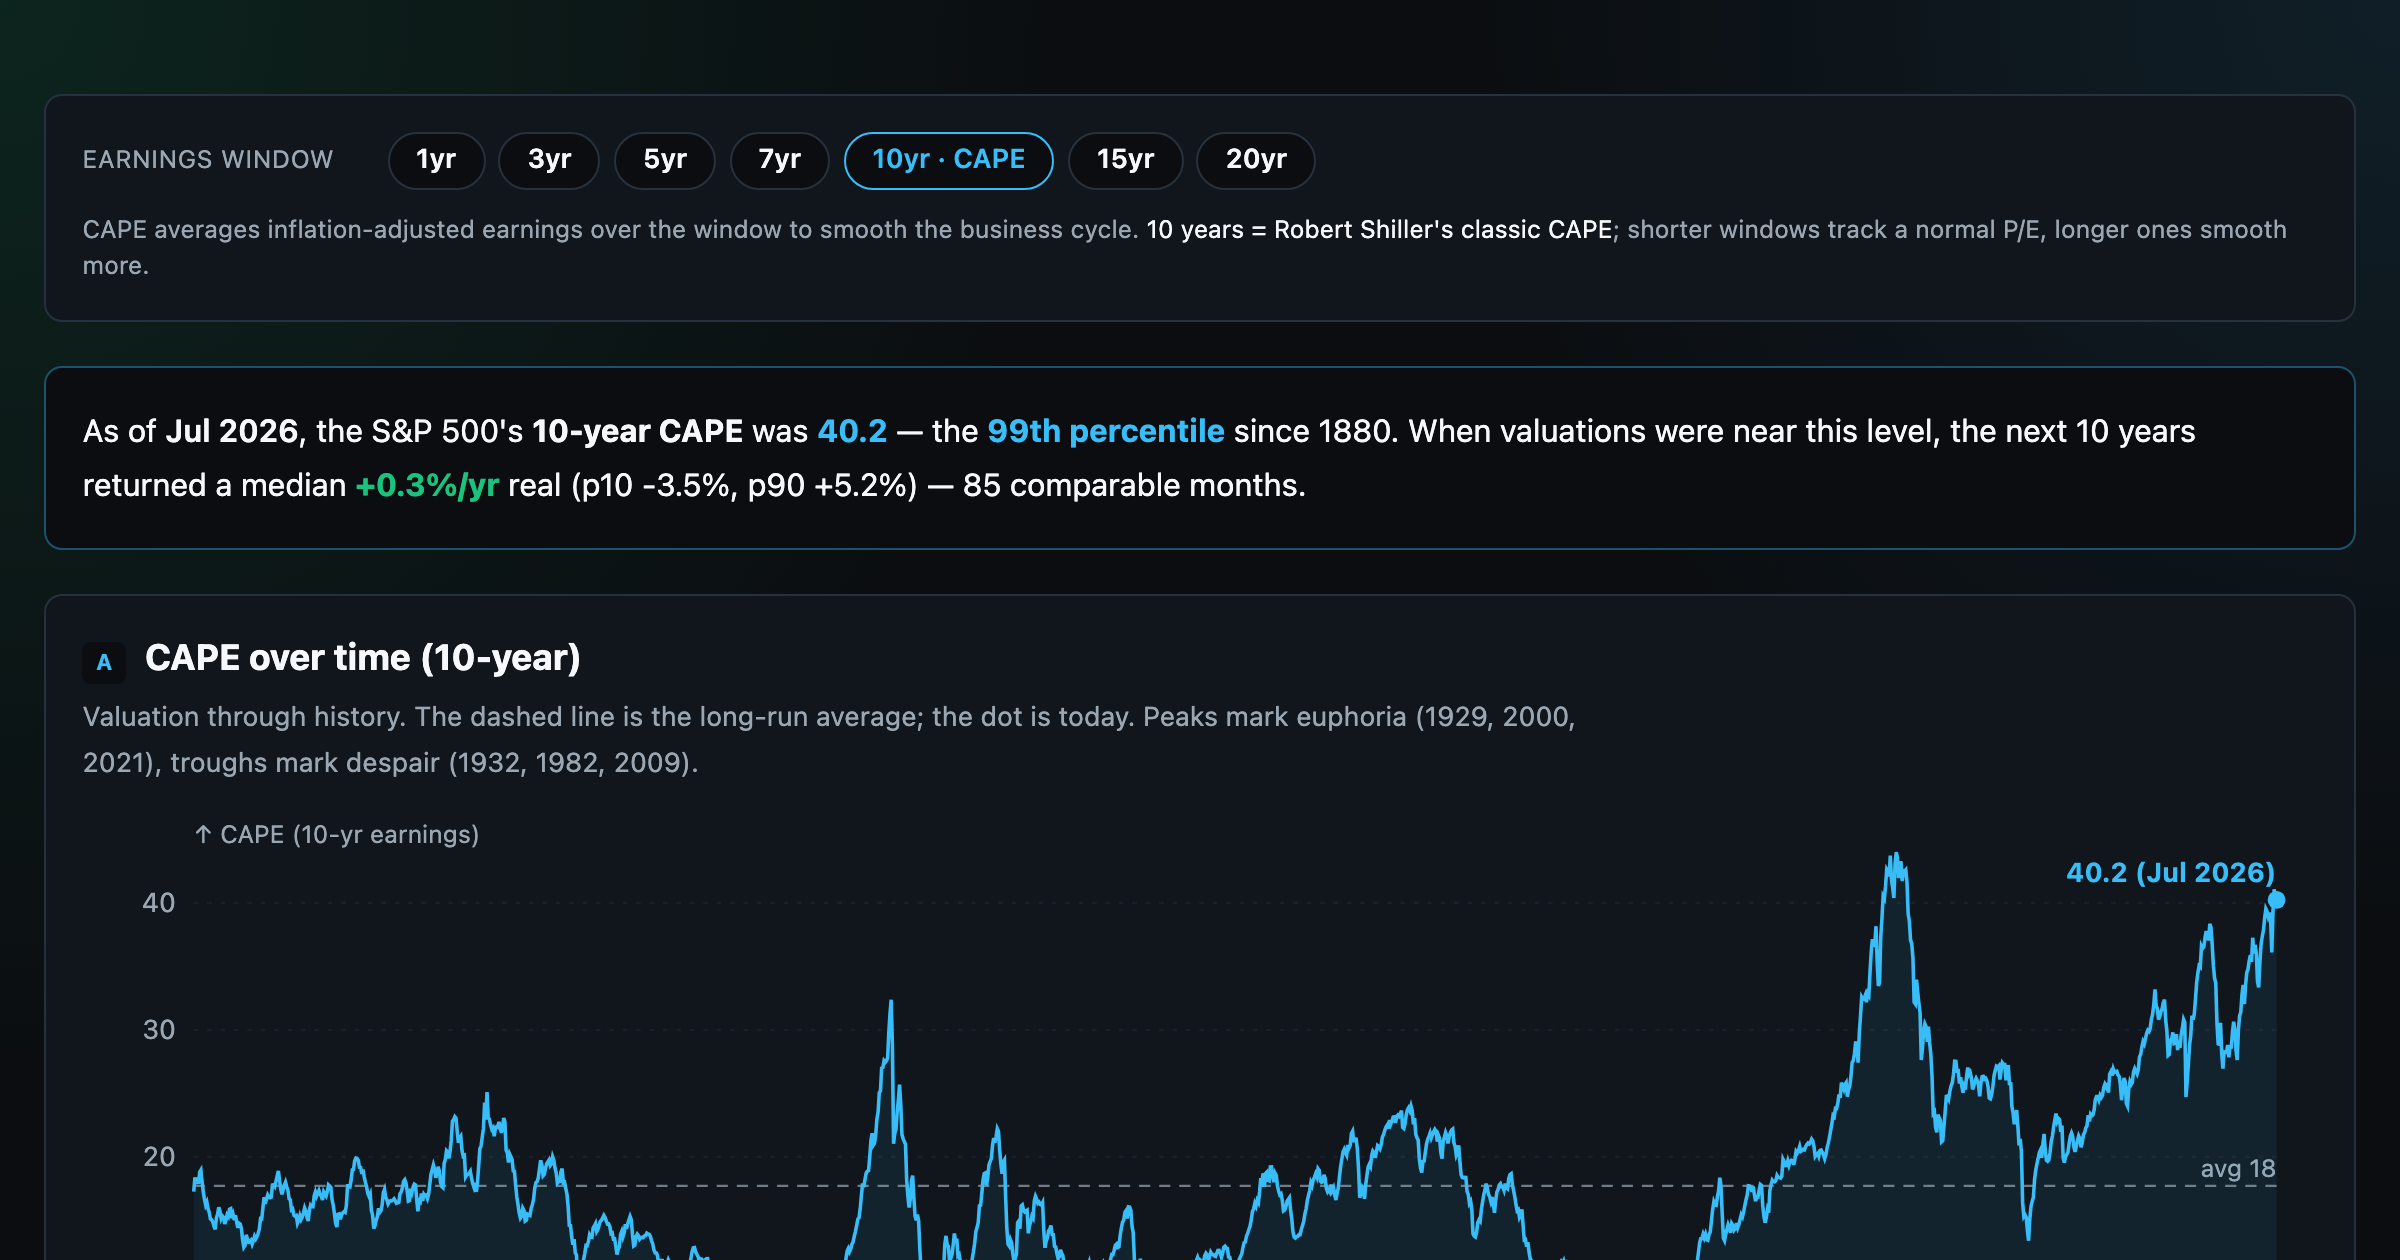
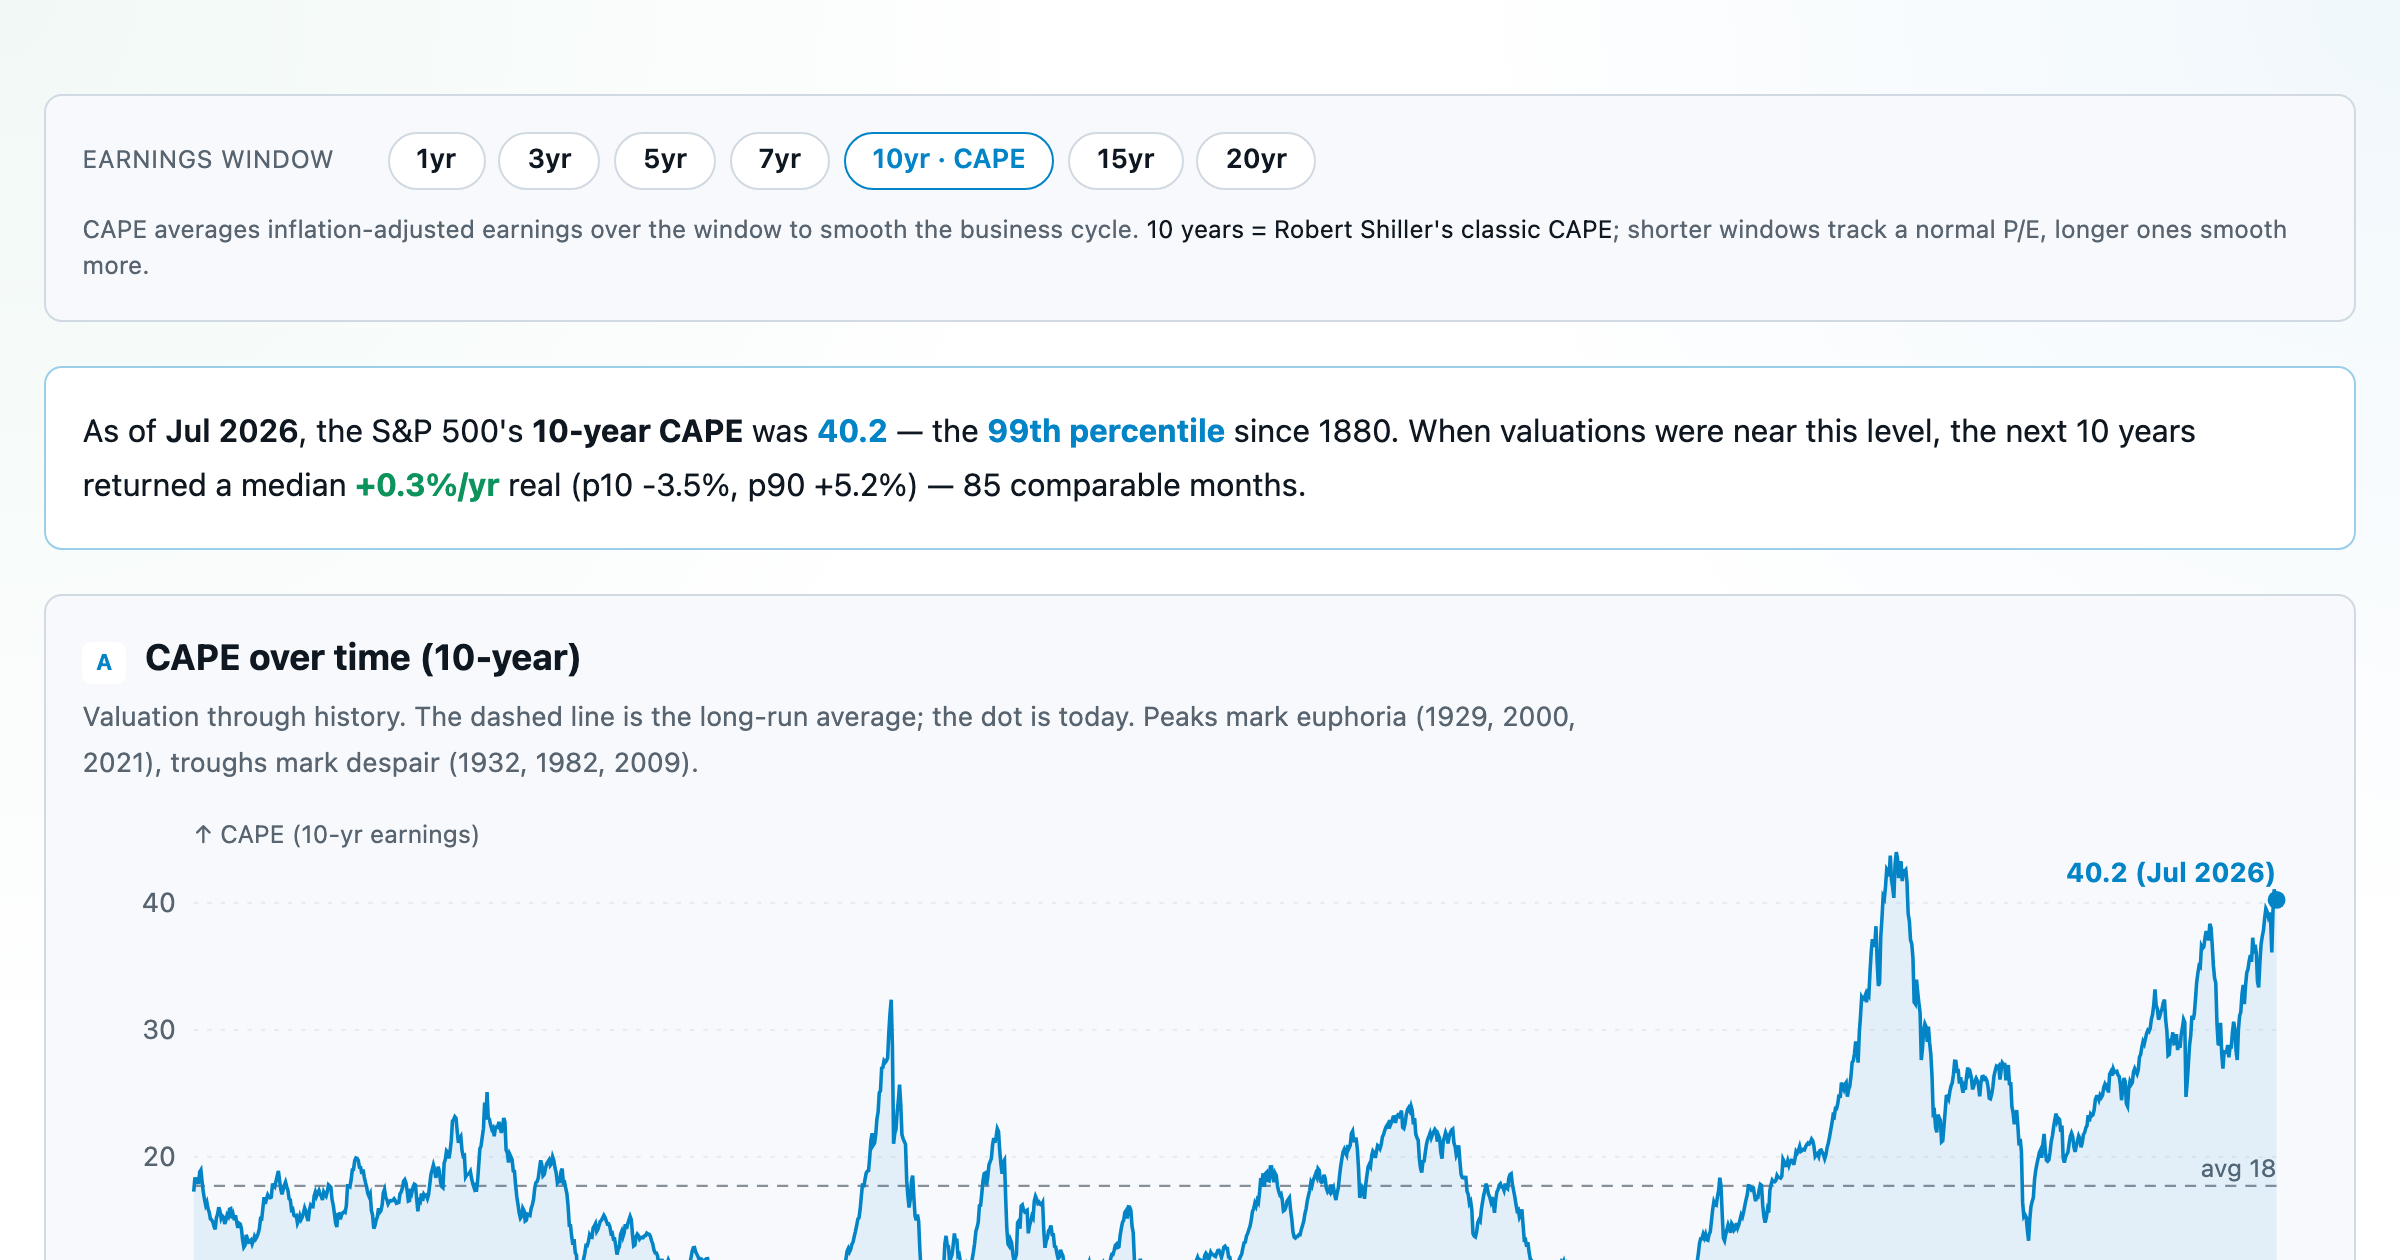
Is the market expensive? The Shiller CAPE back to 1871 and what valuations have meant for the next decade.
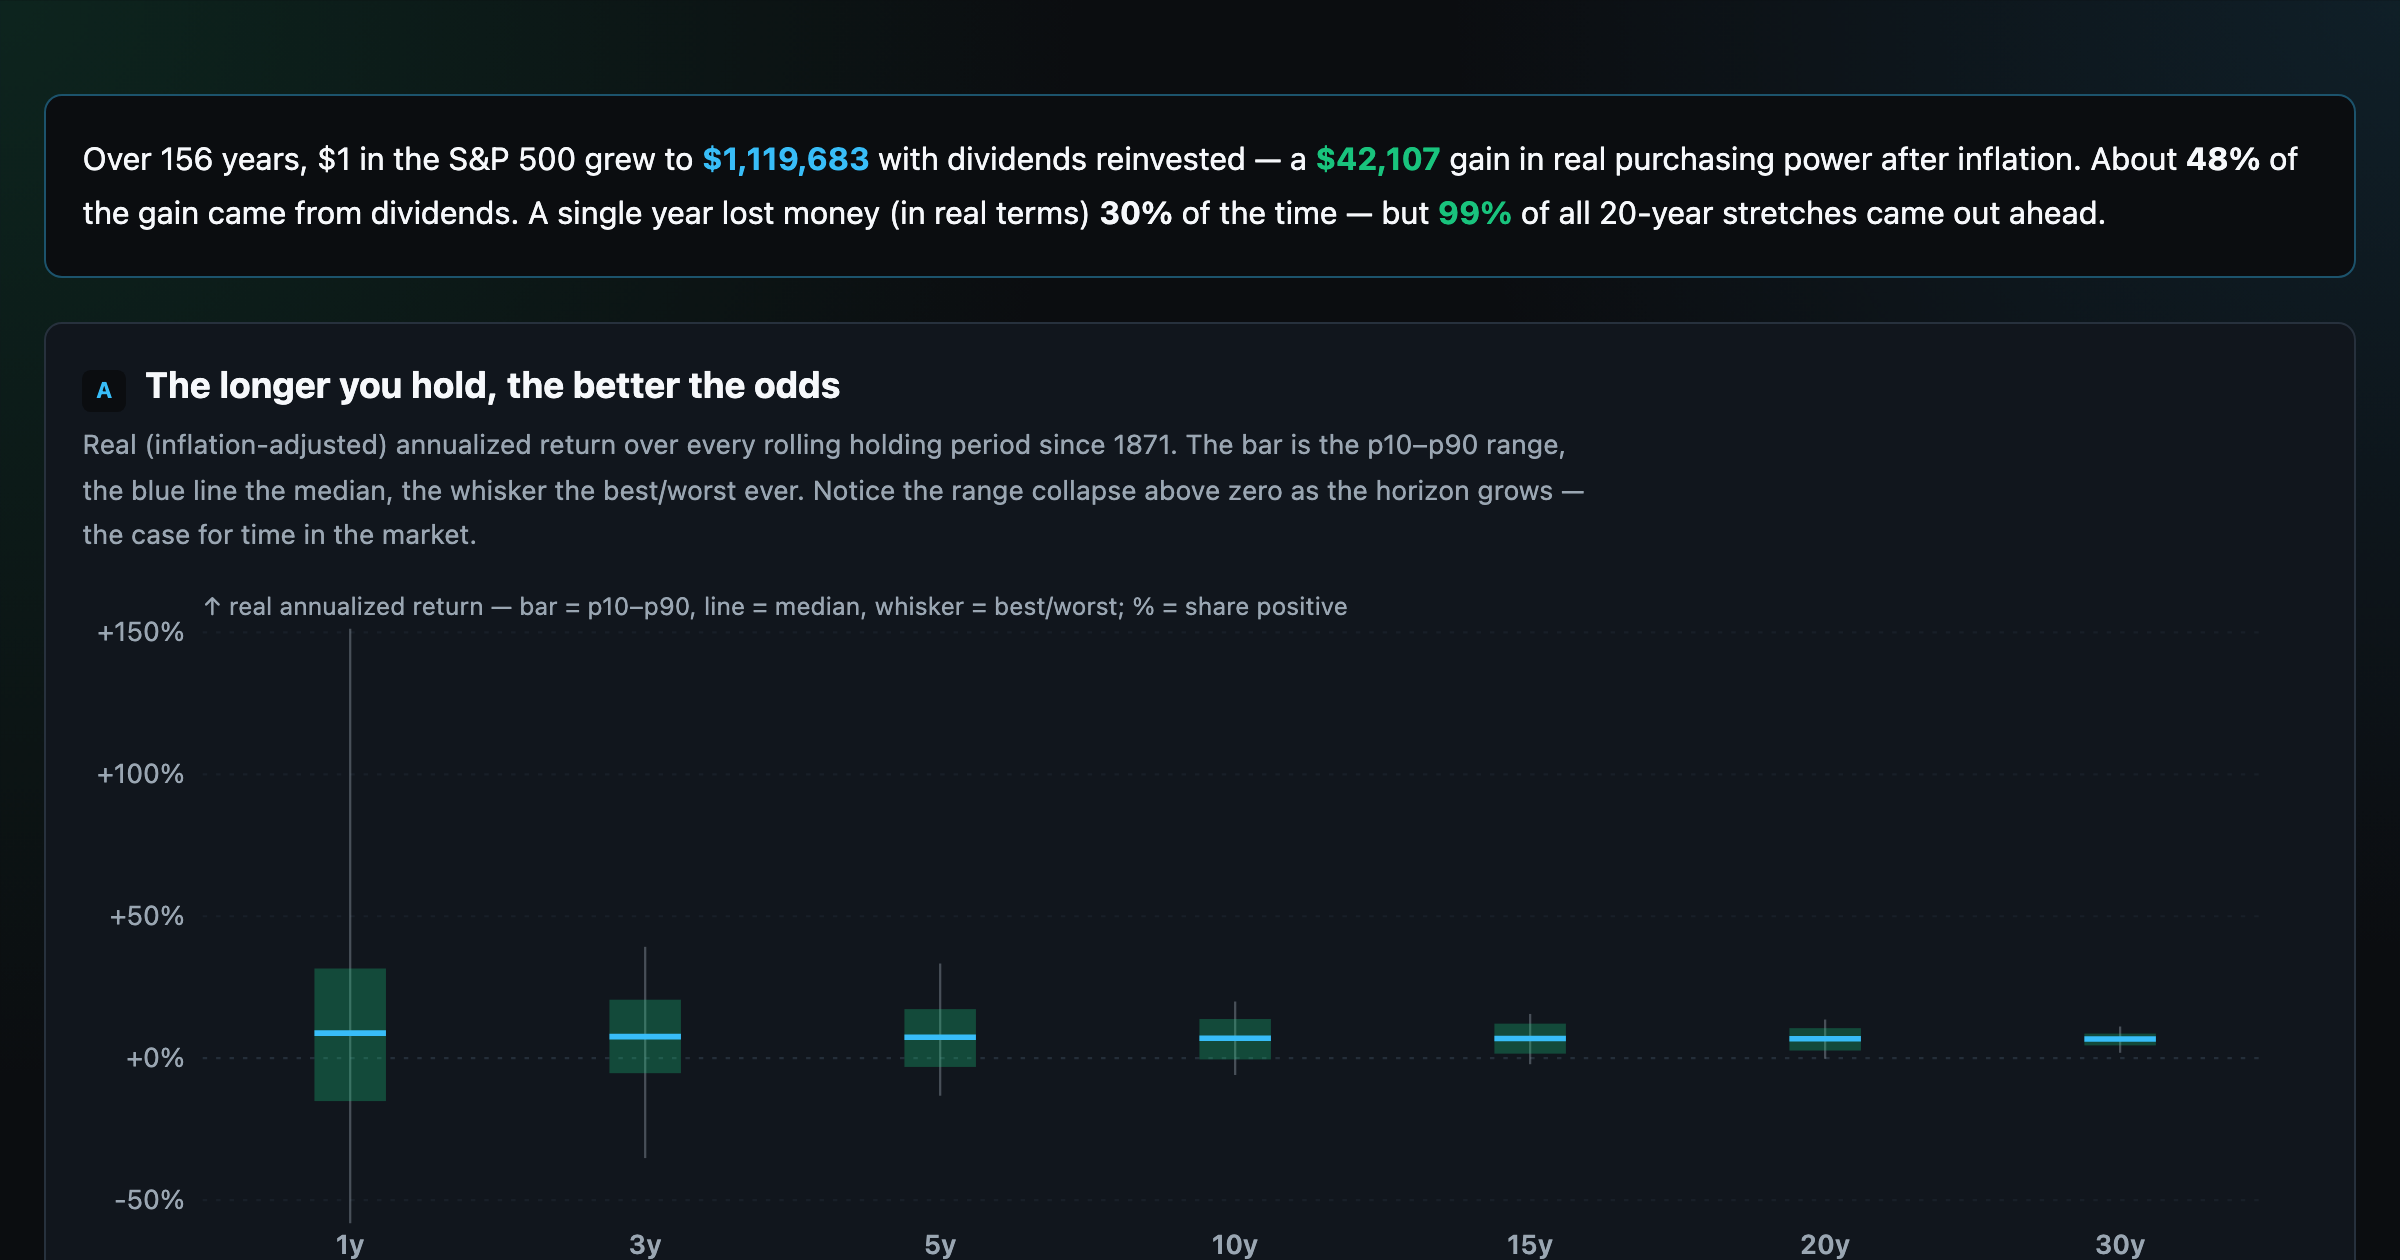
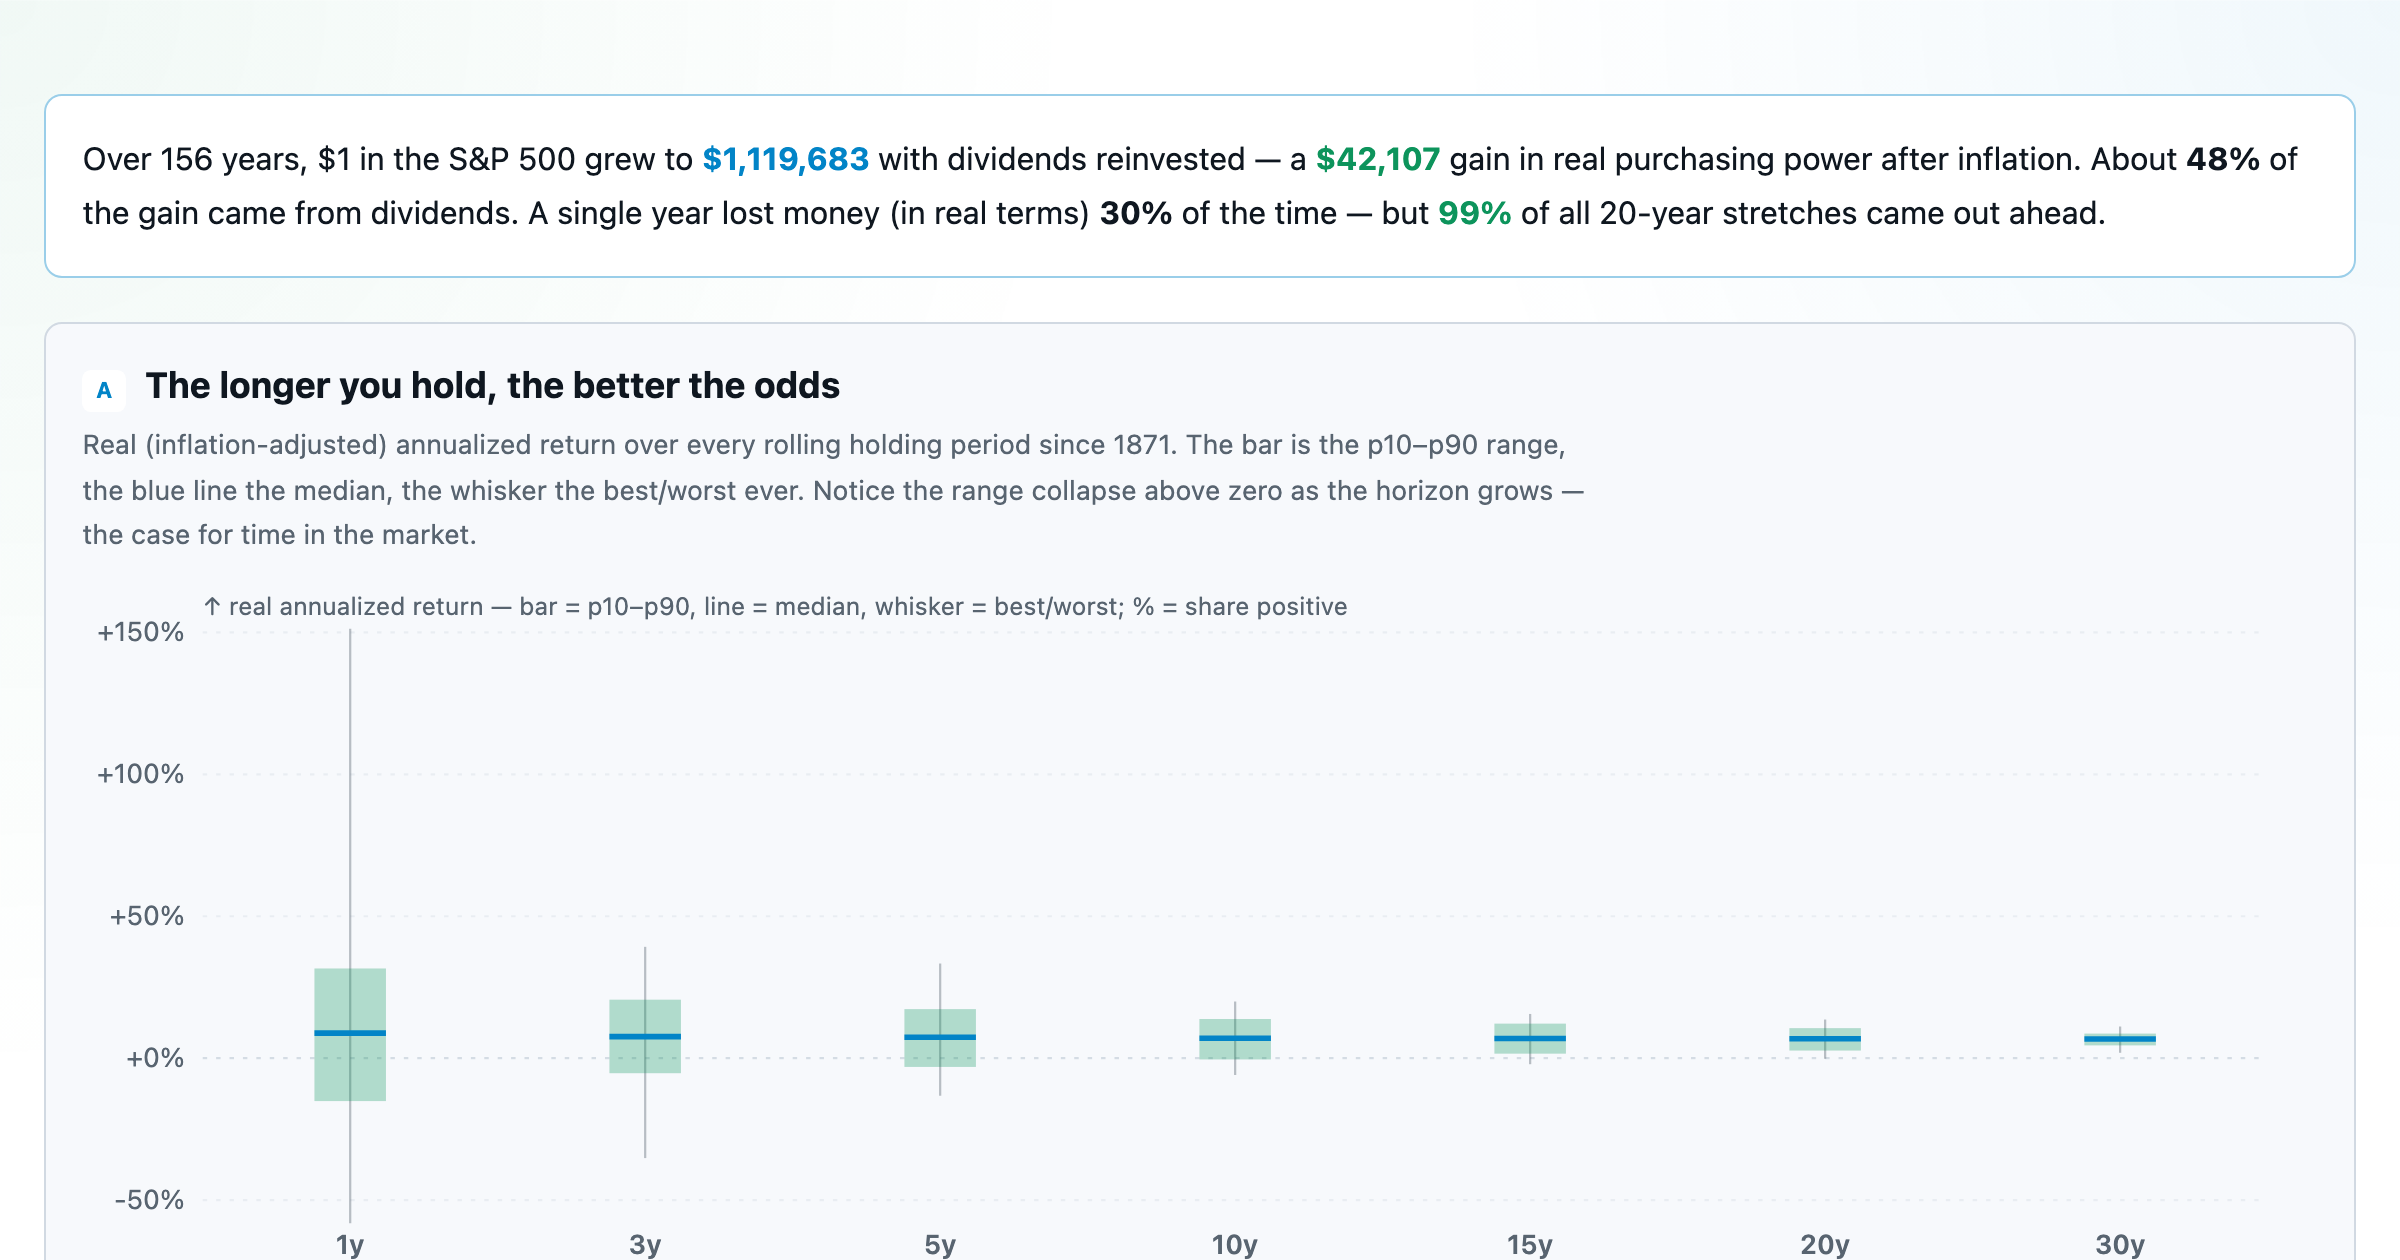
The S&P 500 since 1871 — odds of gain by holding period, real drawdowns, and the growth of $1.
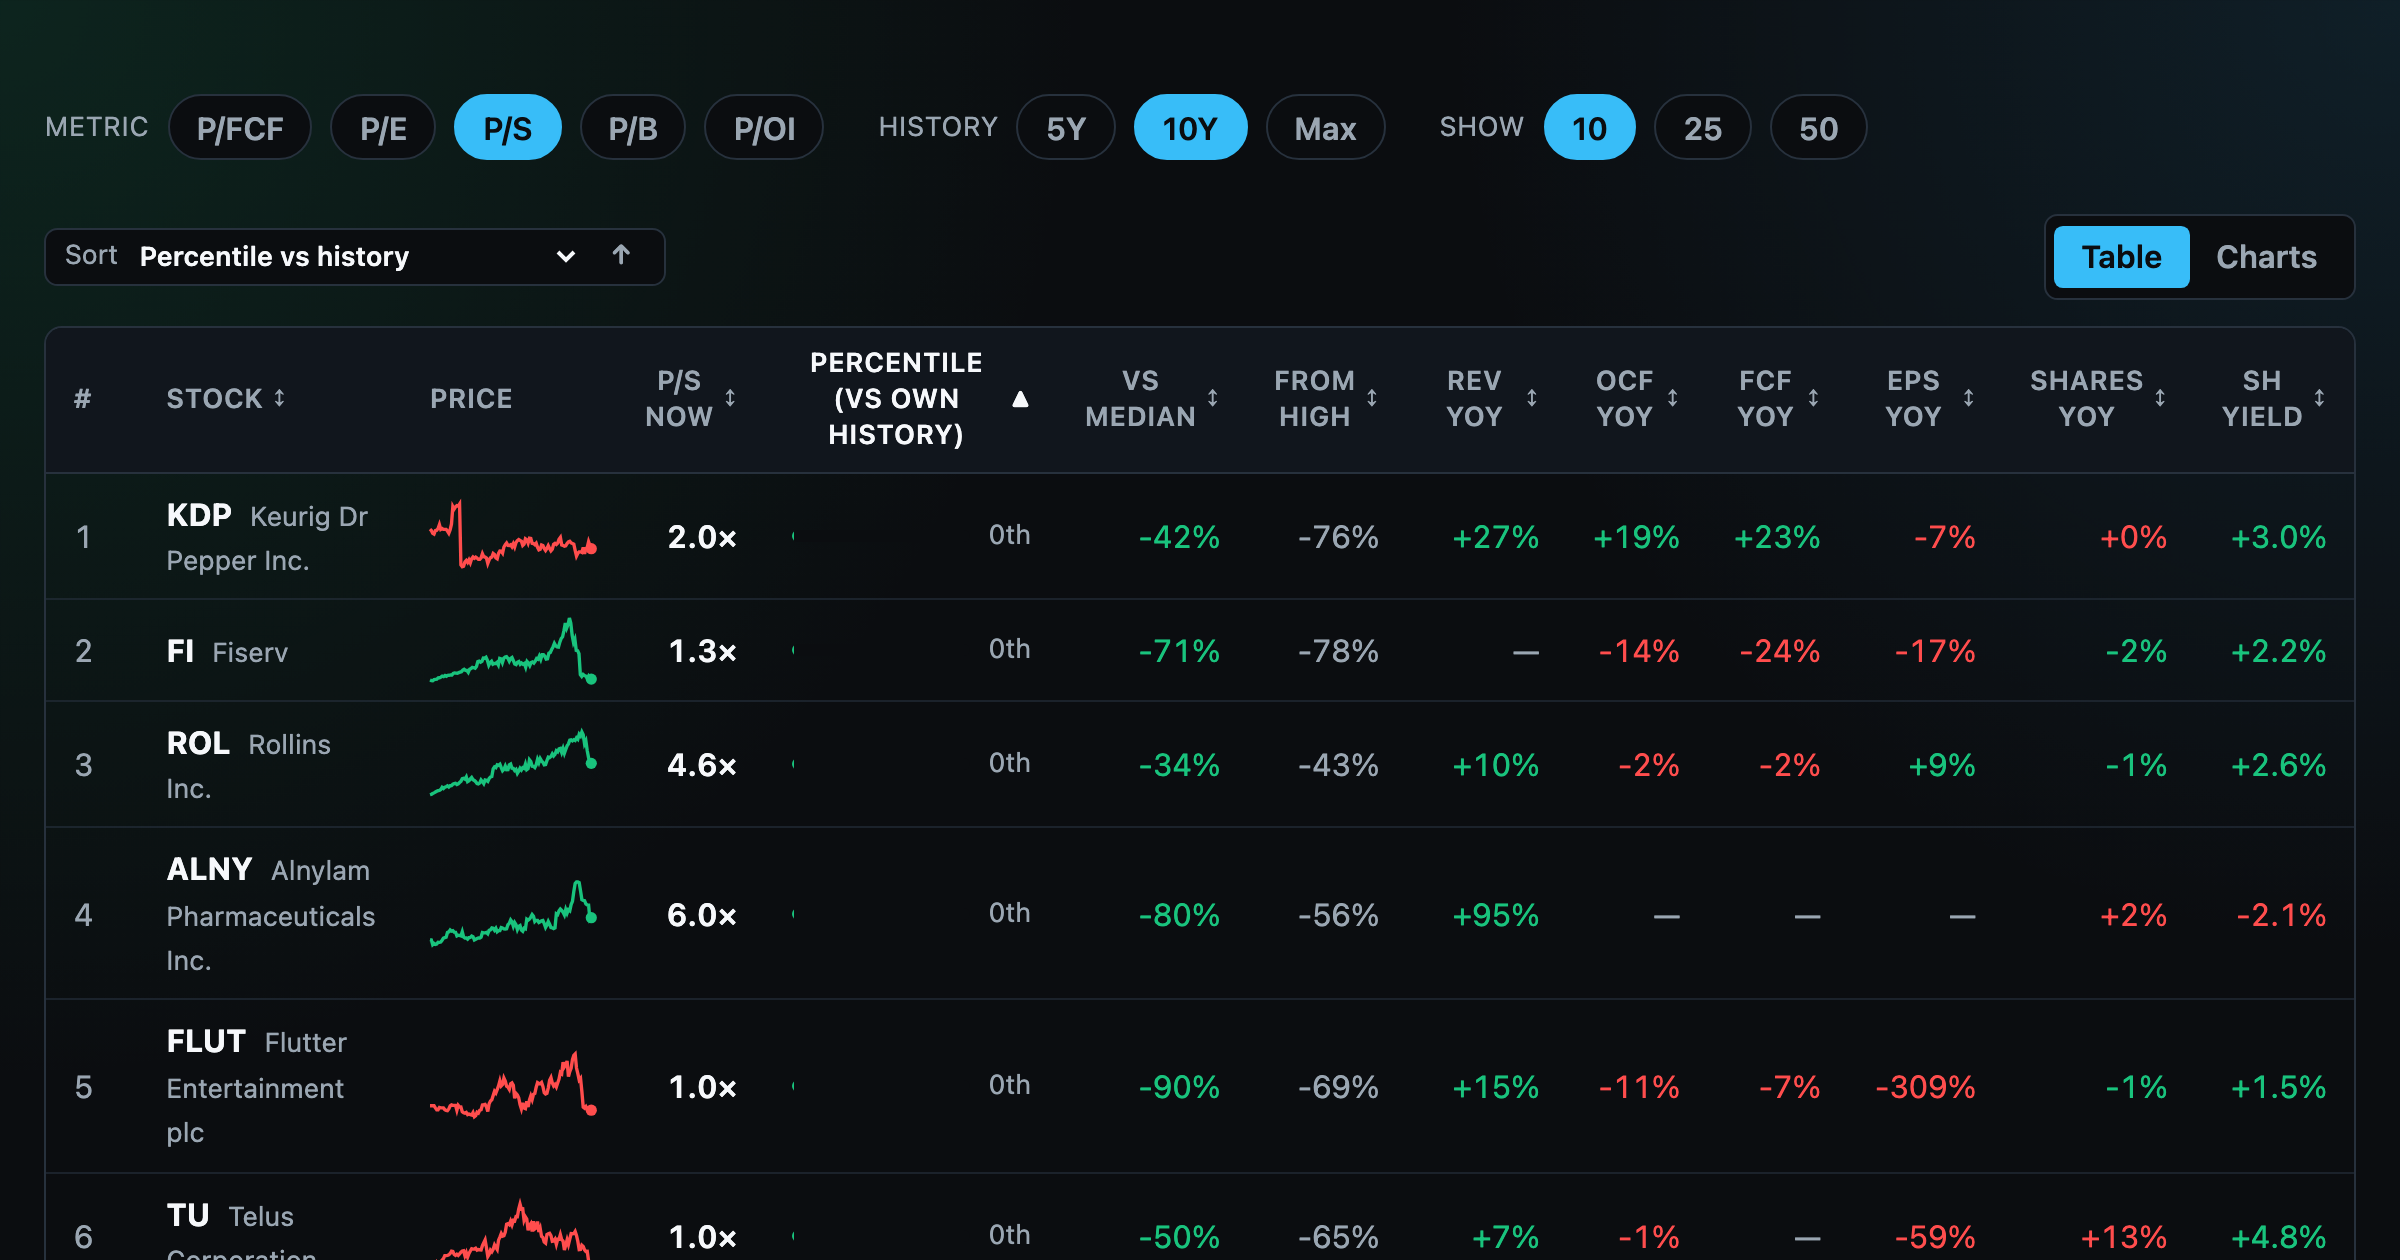
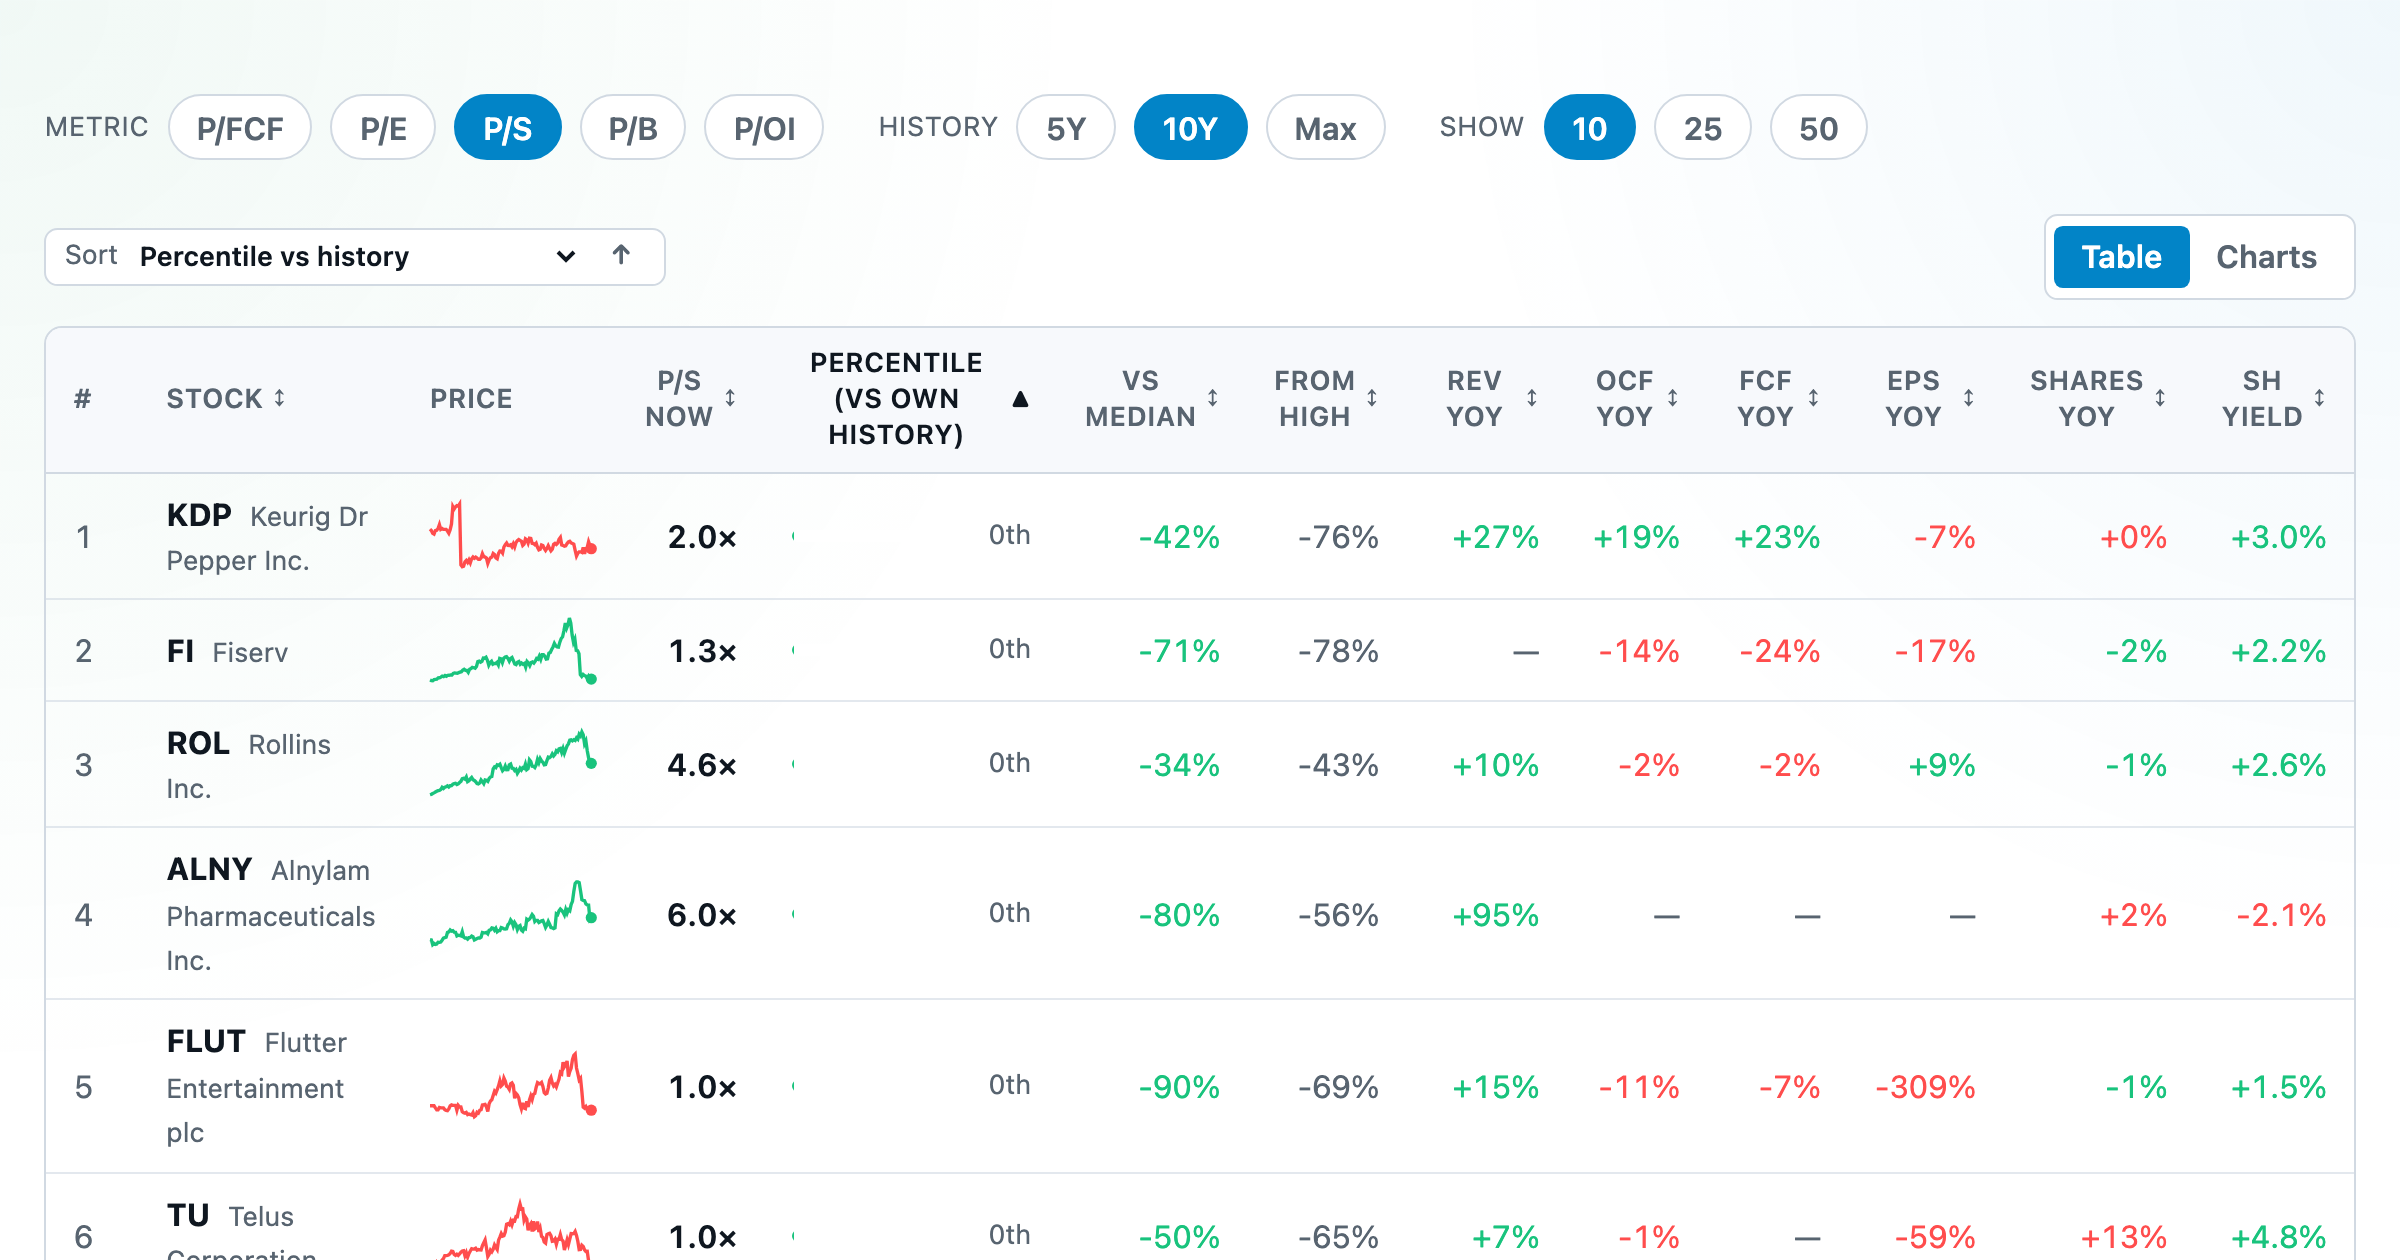
Stocks trading cheapest relative to their own P/E, P/FCF, P/S, or P/B history — with fair-value bands.
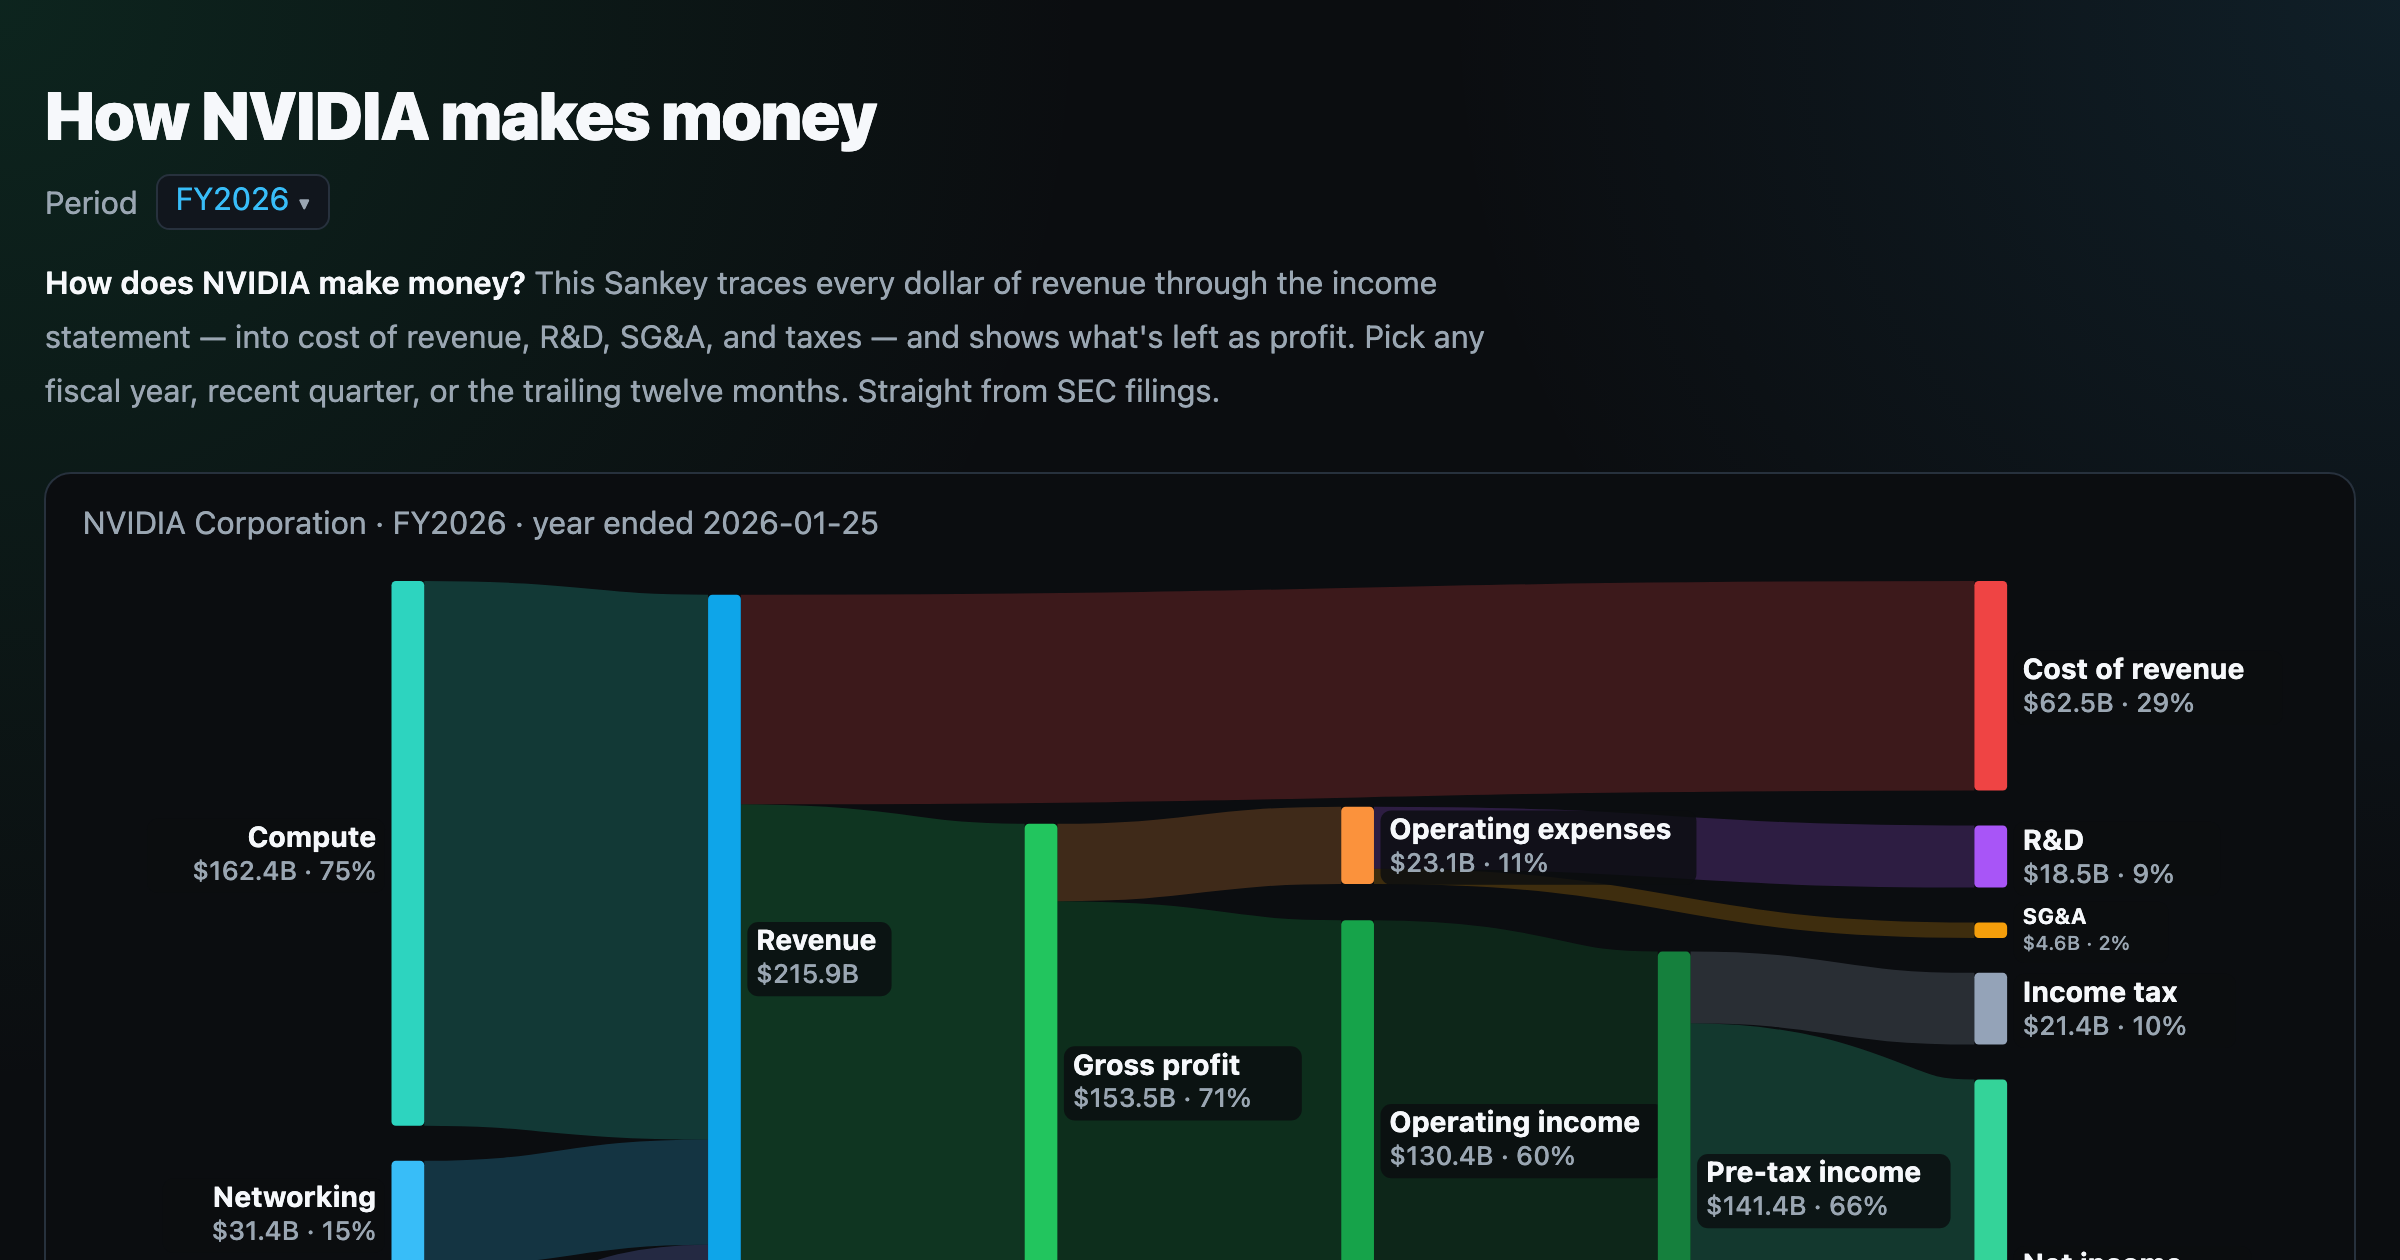
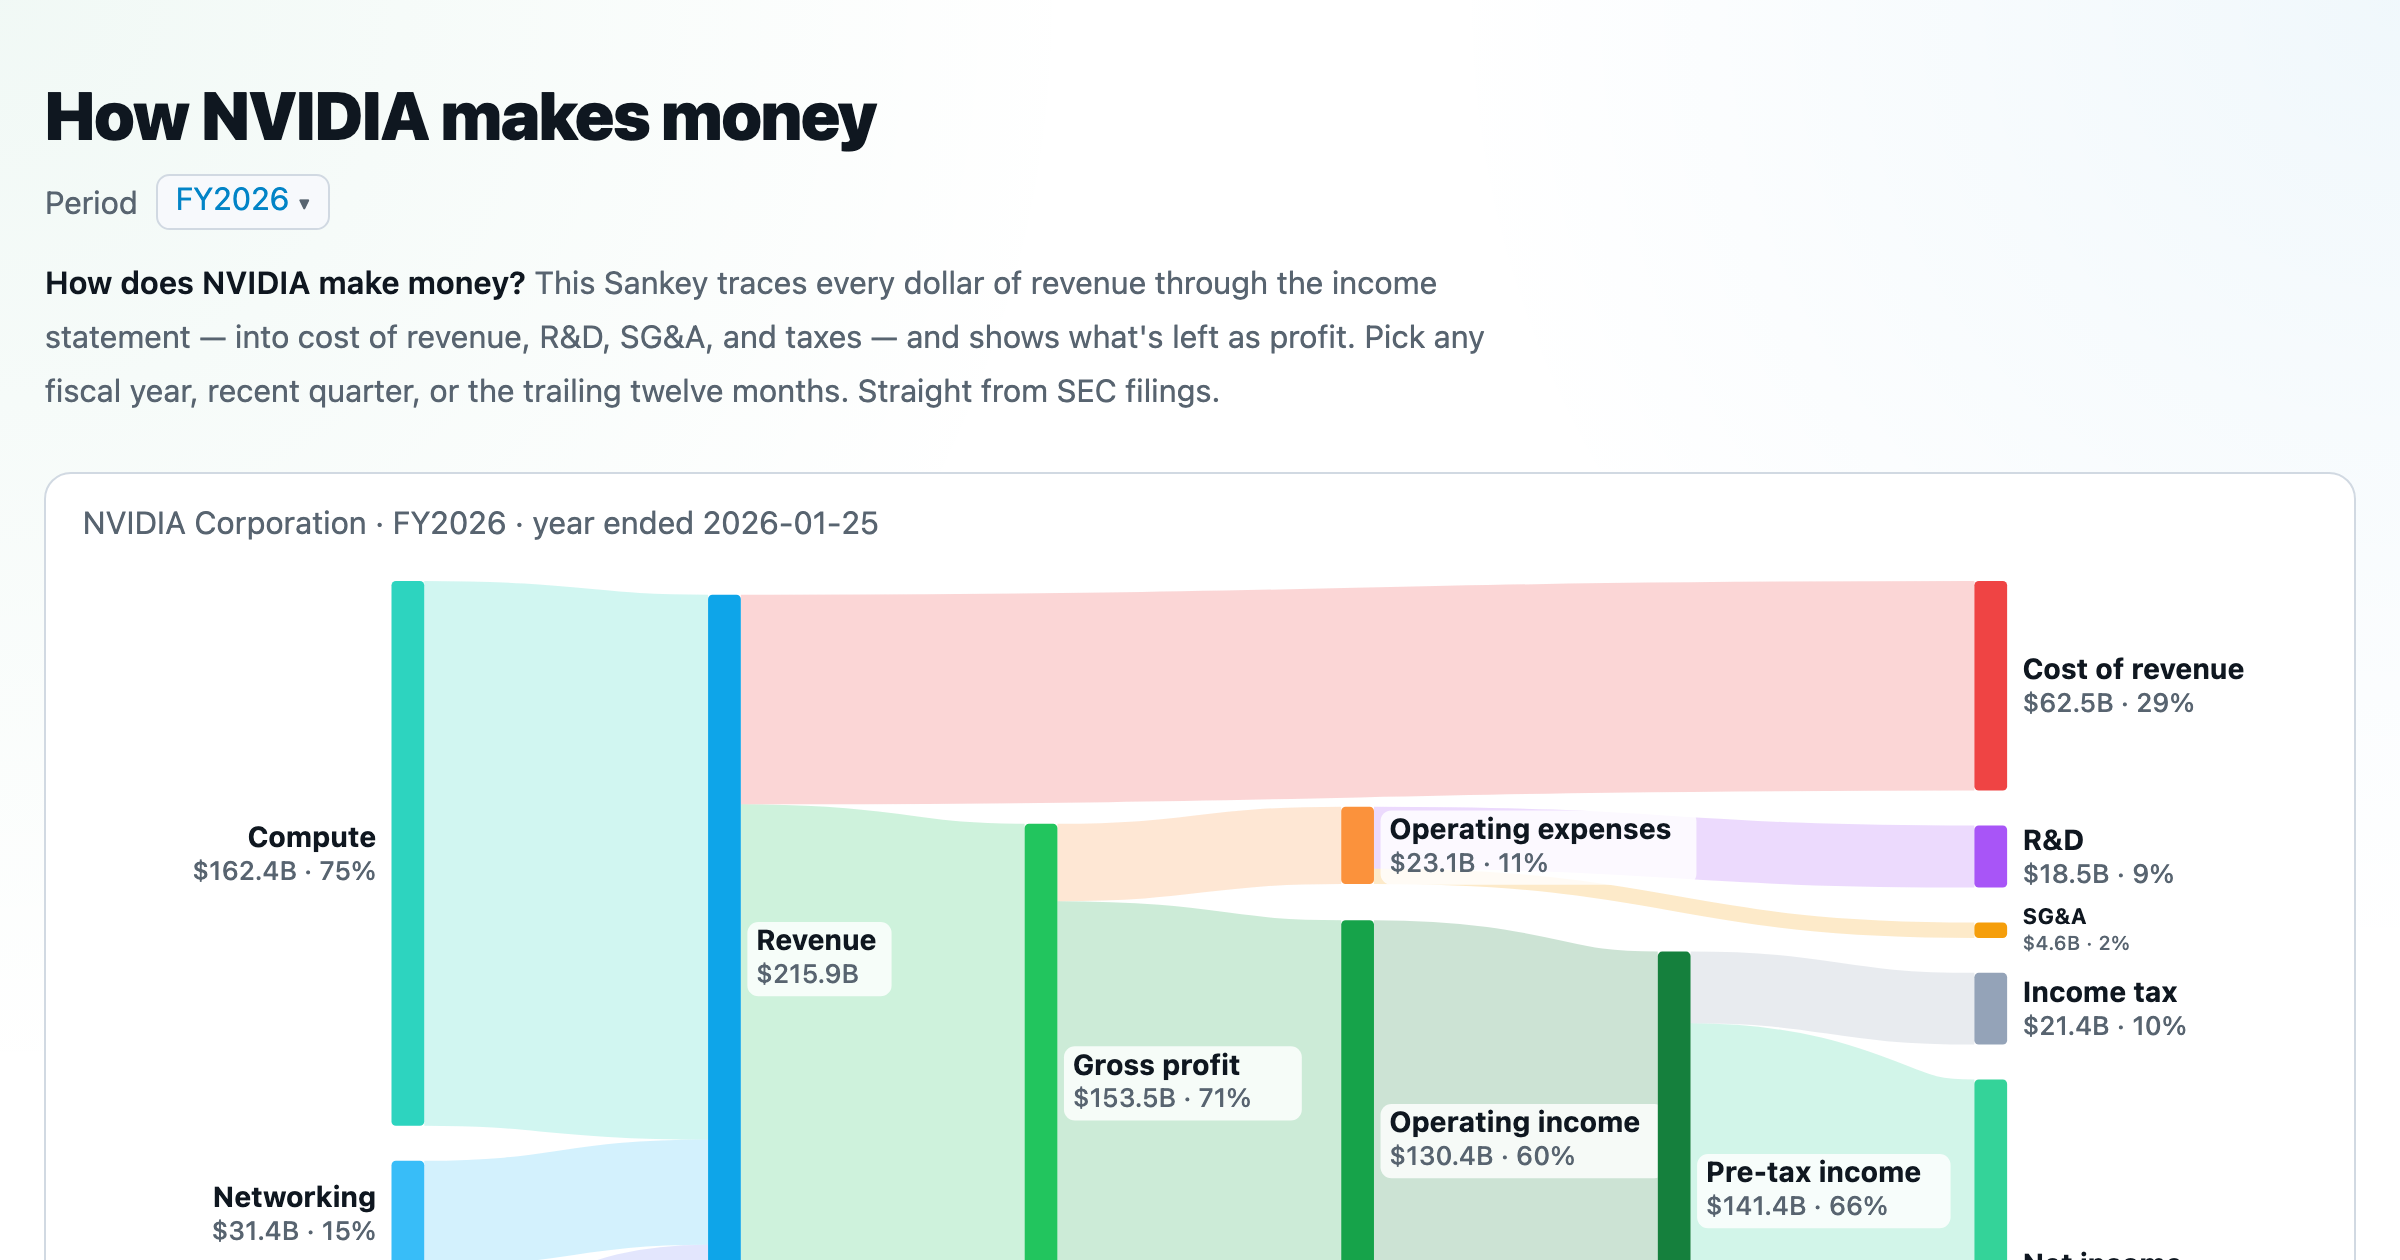
Follow a company's revenue through its income statement as a Sankey — costs, taxes, and profit.
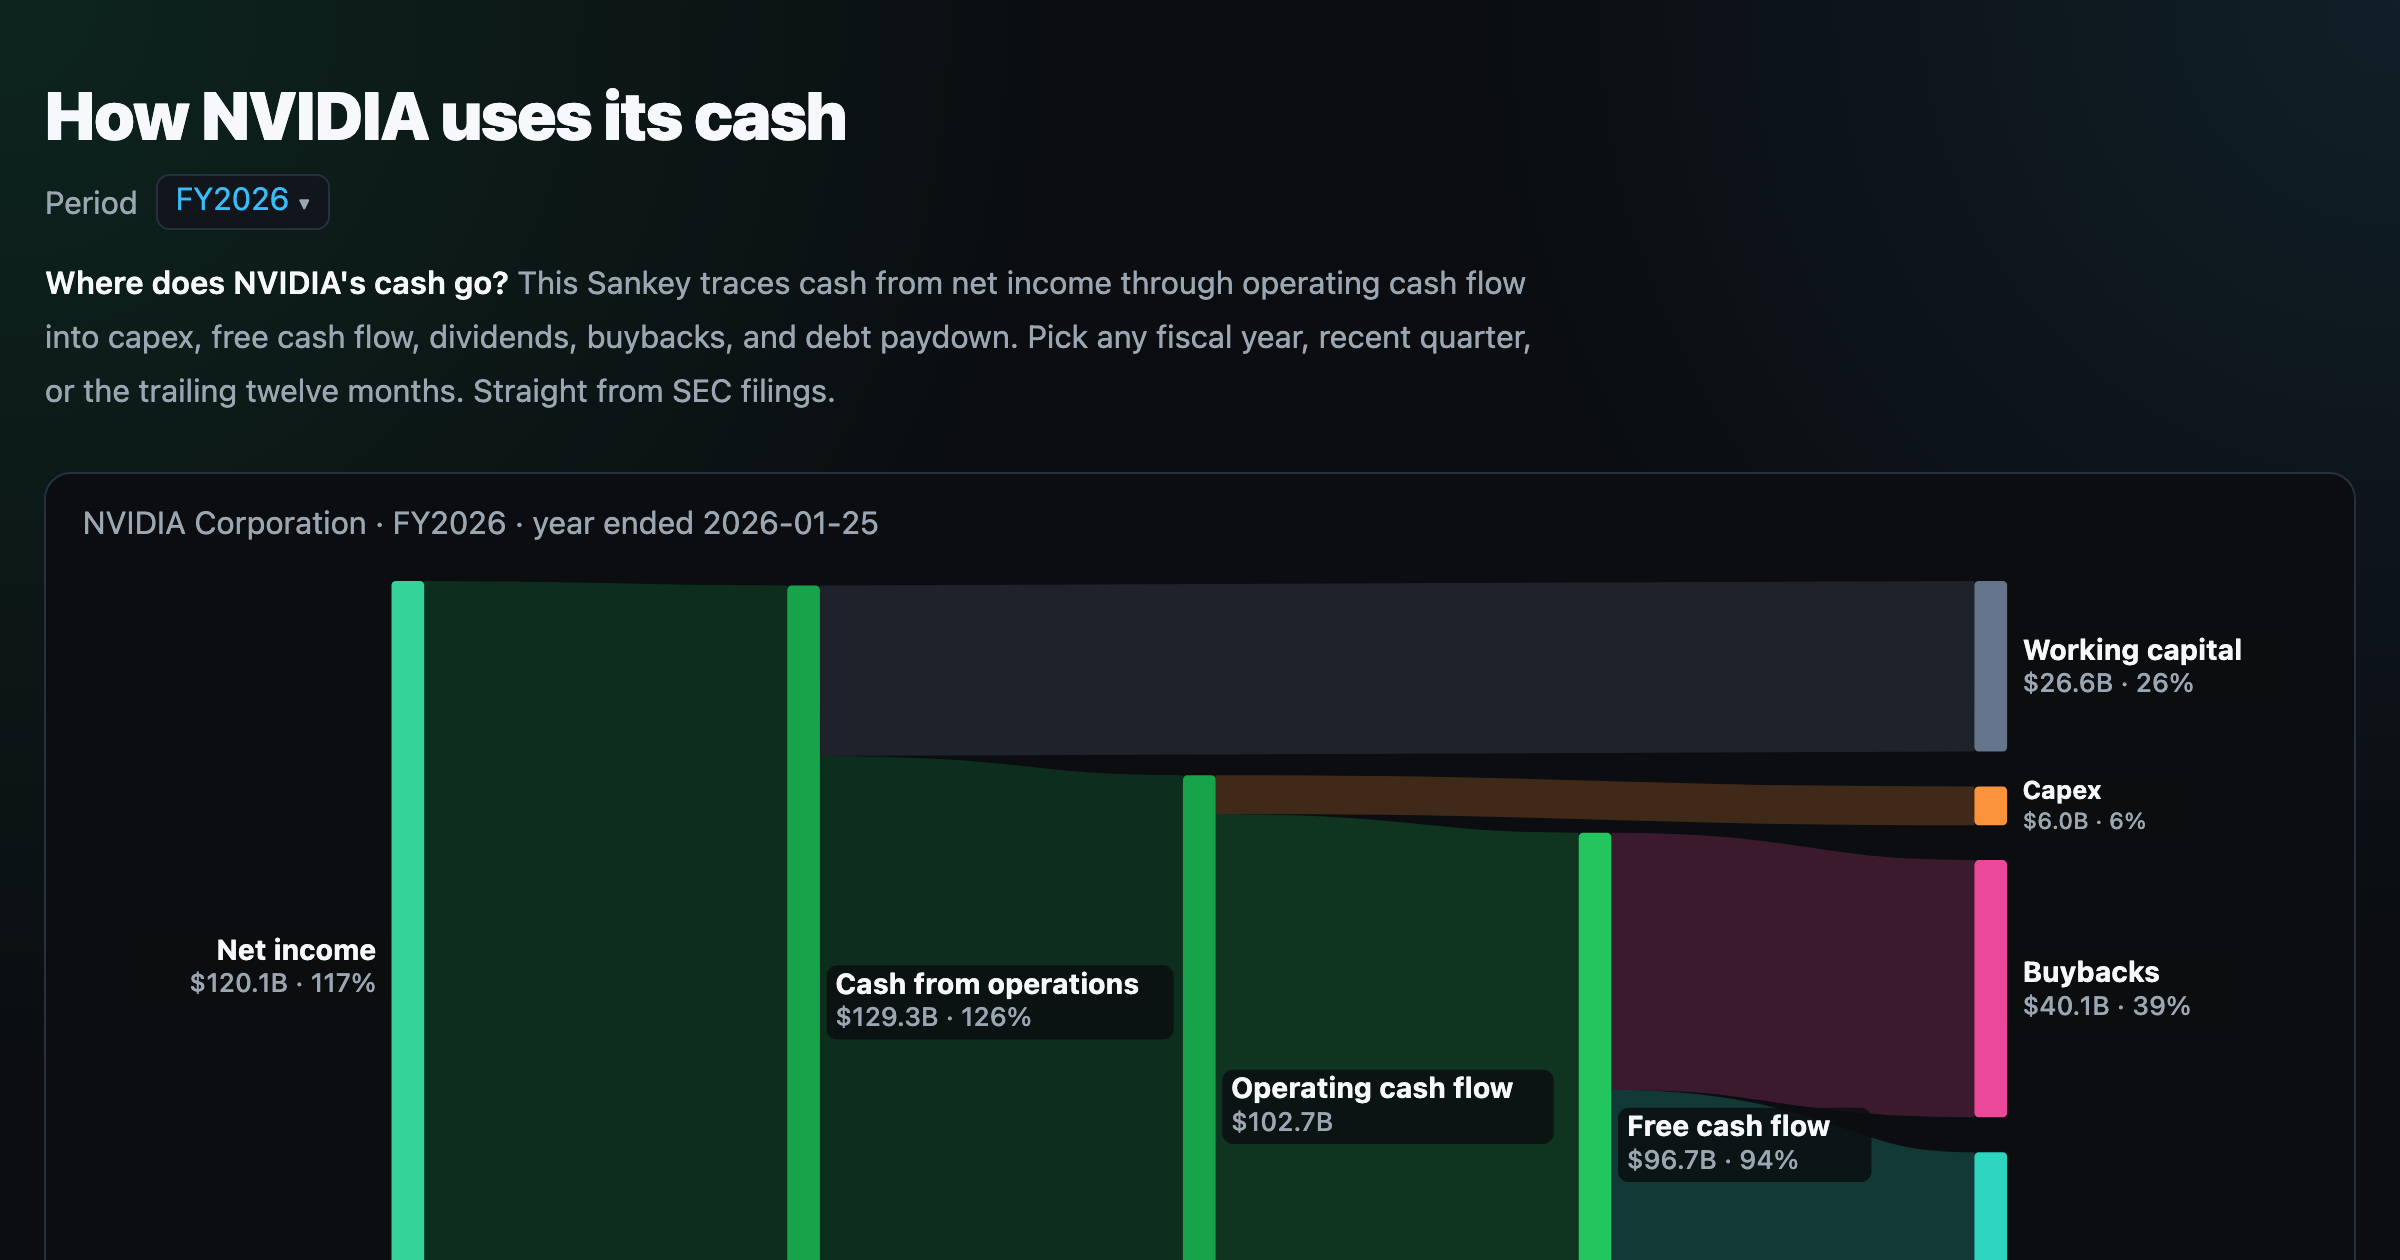
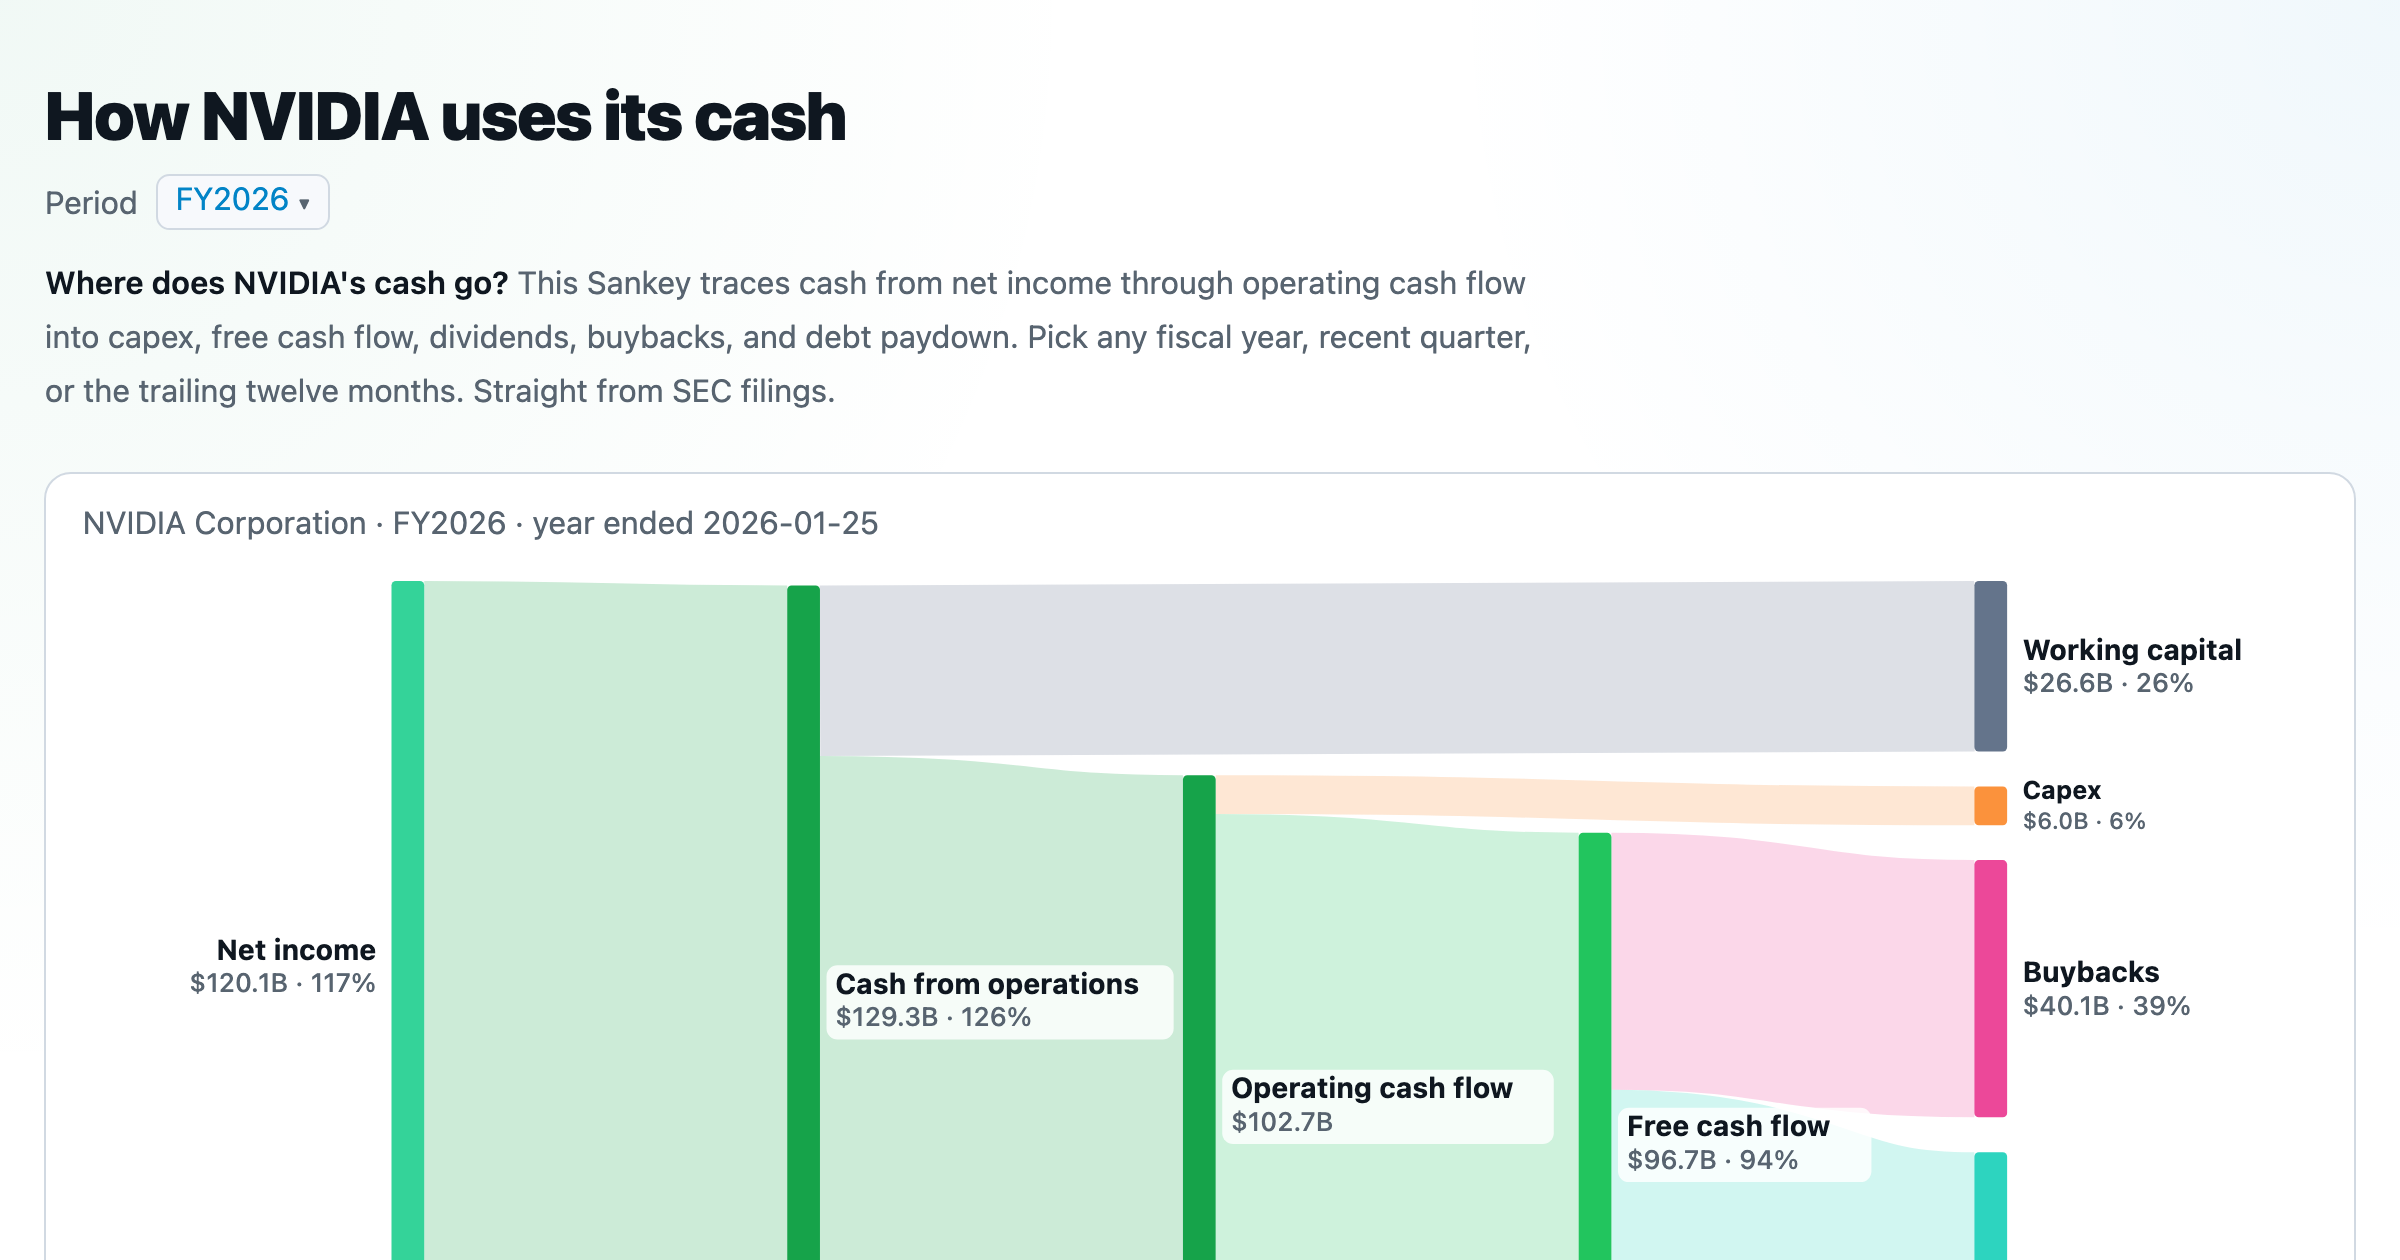
Follow a company's cash from net income through operating cash flow into capex, buybacks, and dividends.
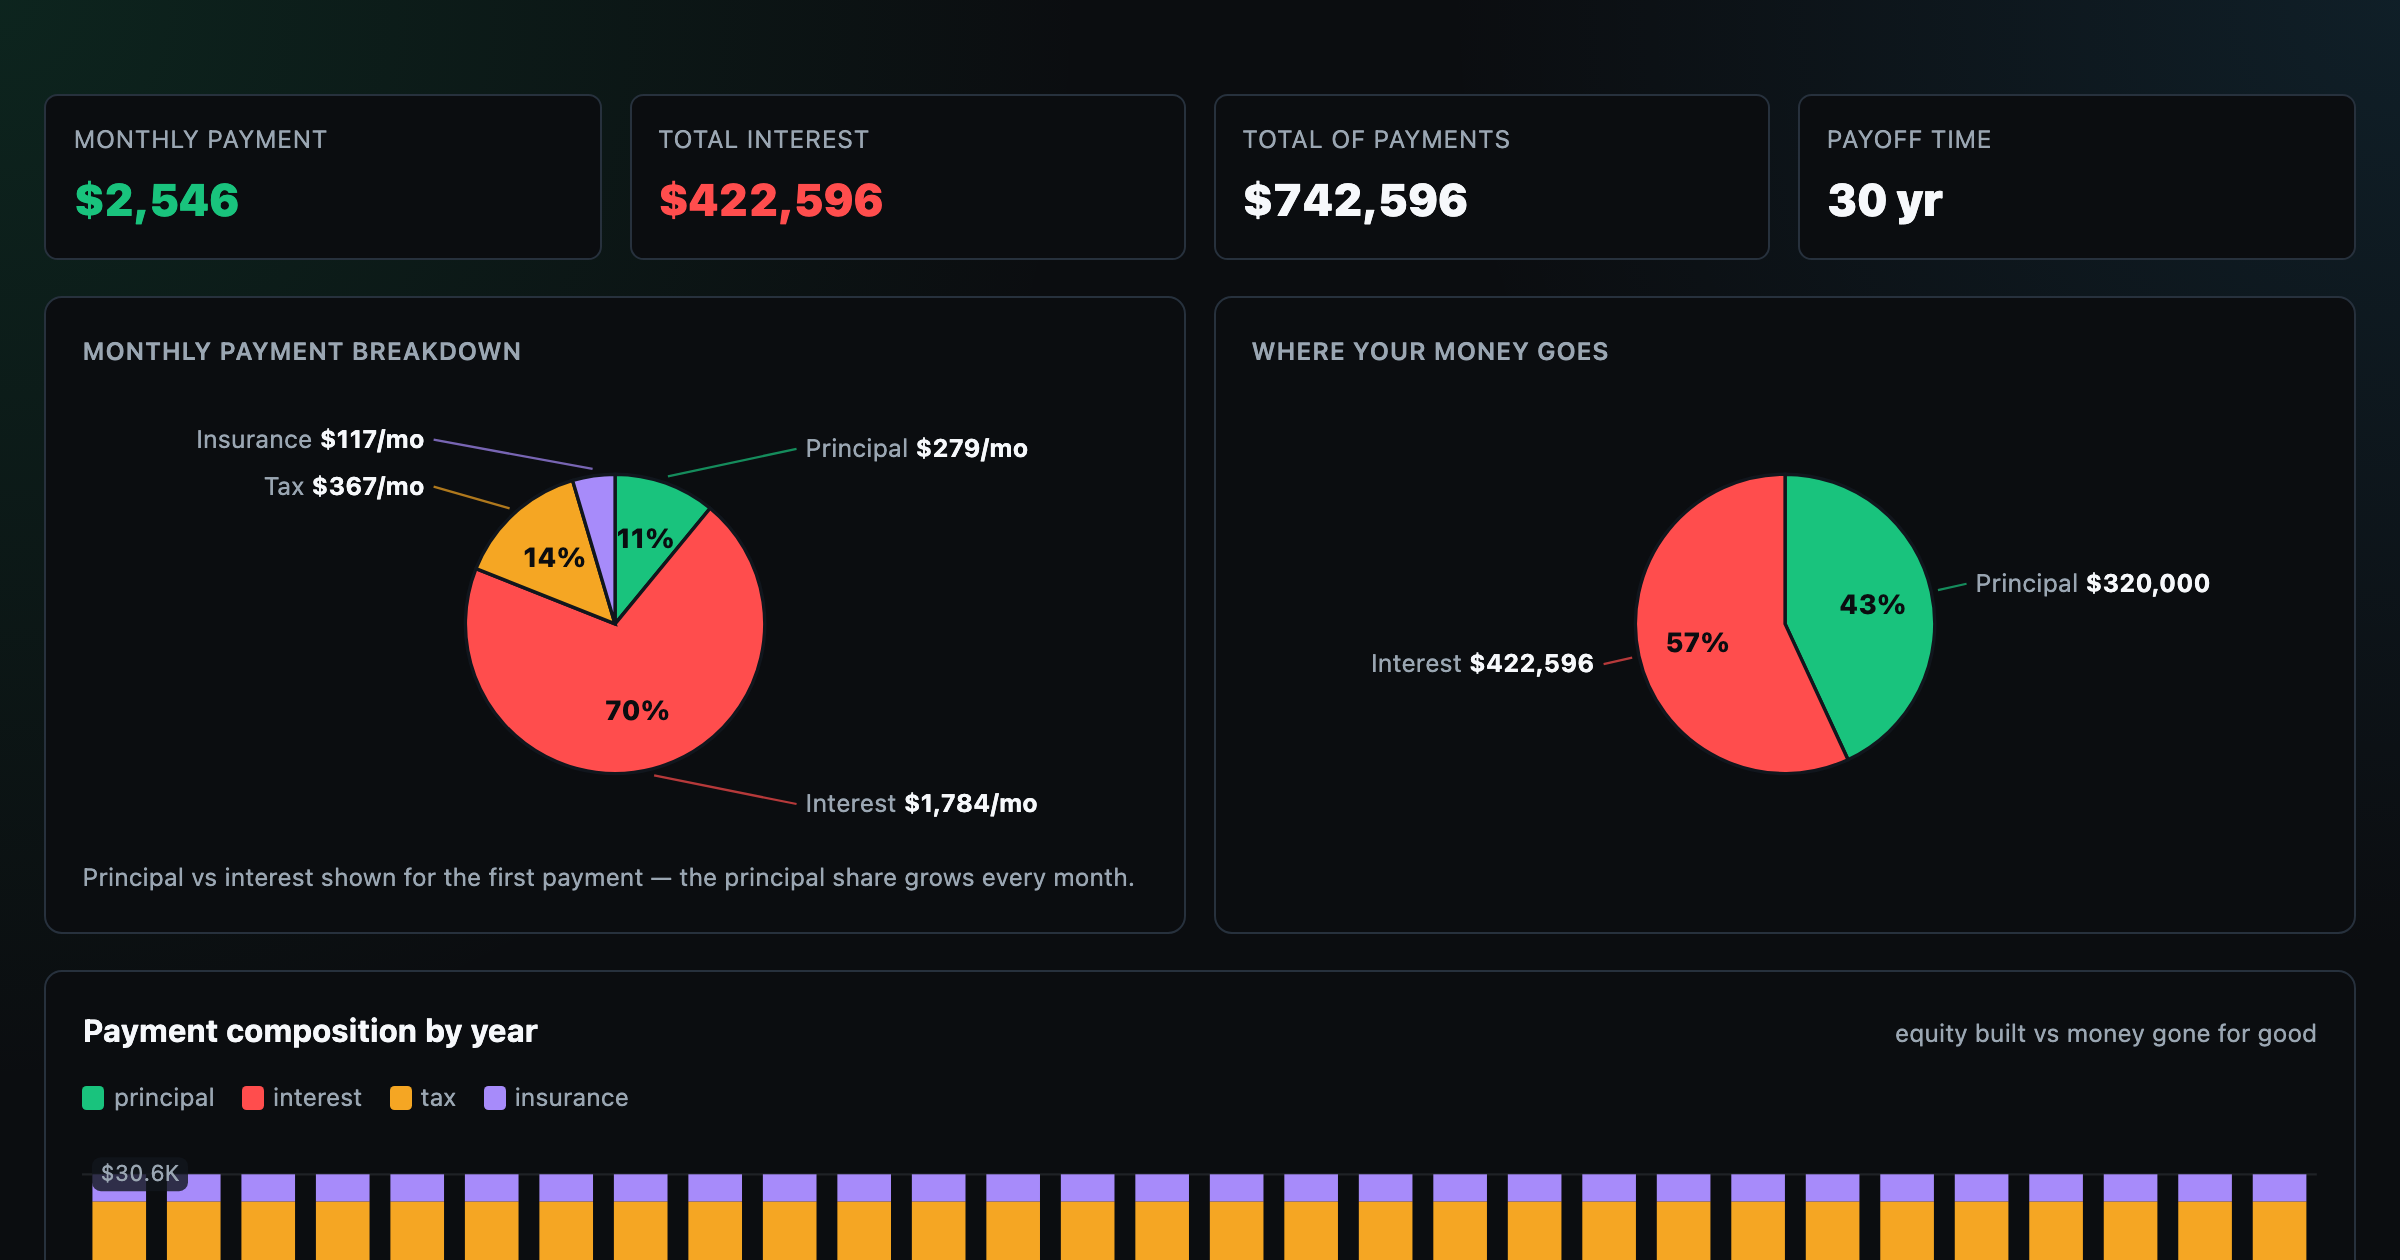
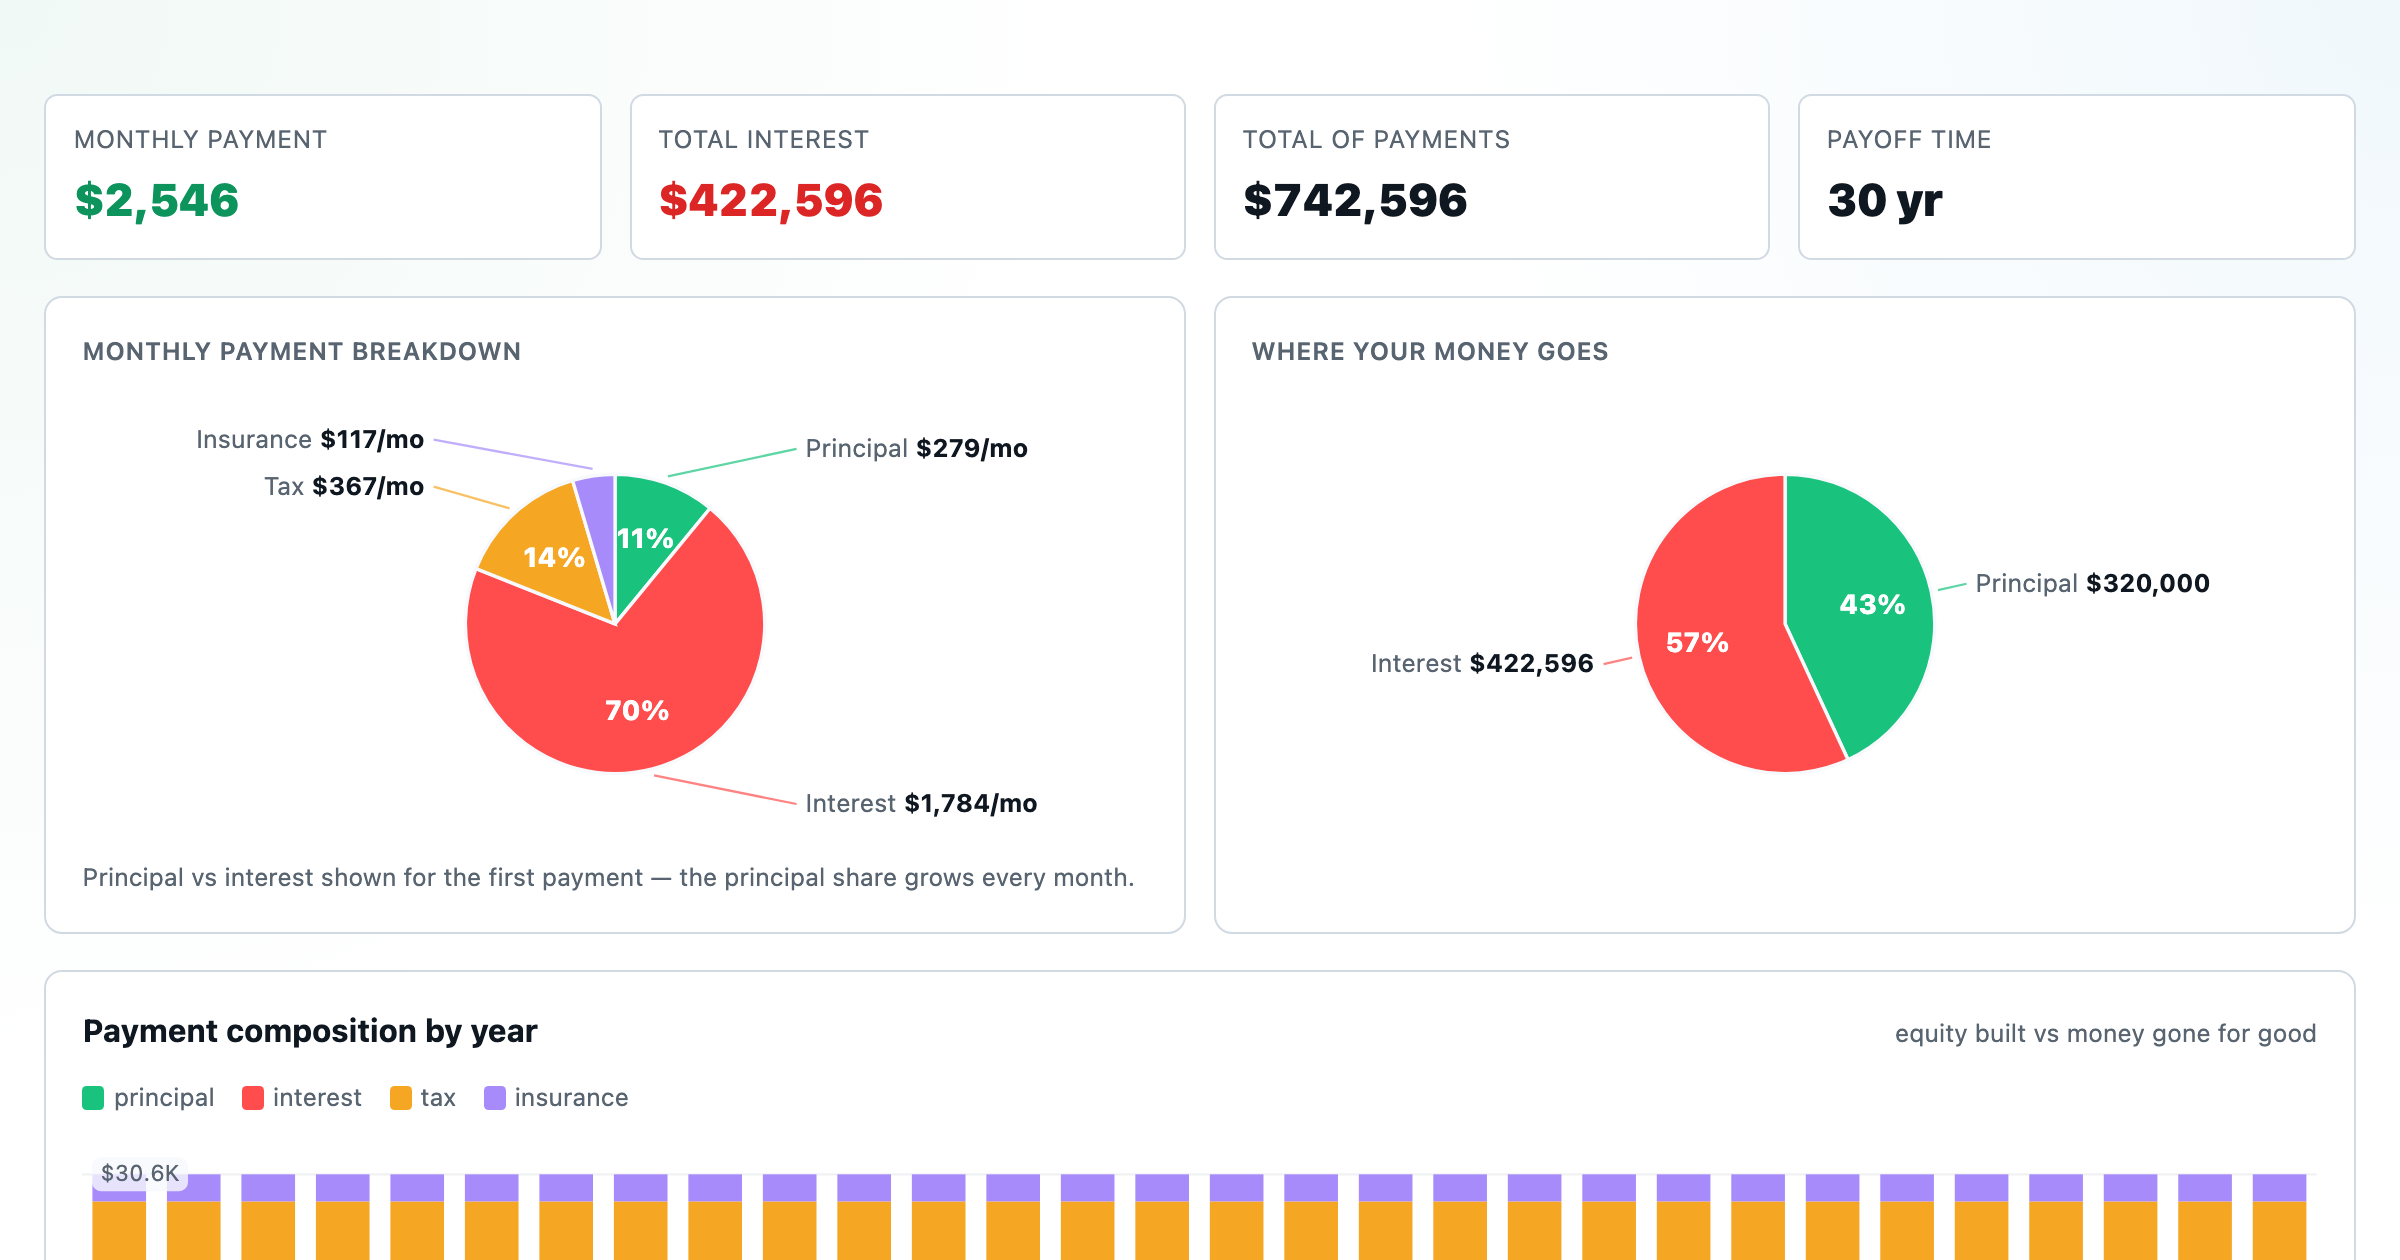
Monthly payment, principal vs interest by year, and the balance paydown — with extra-payment savings.
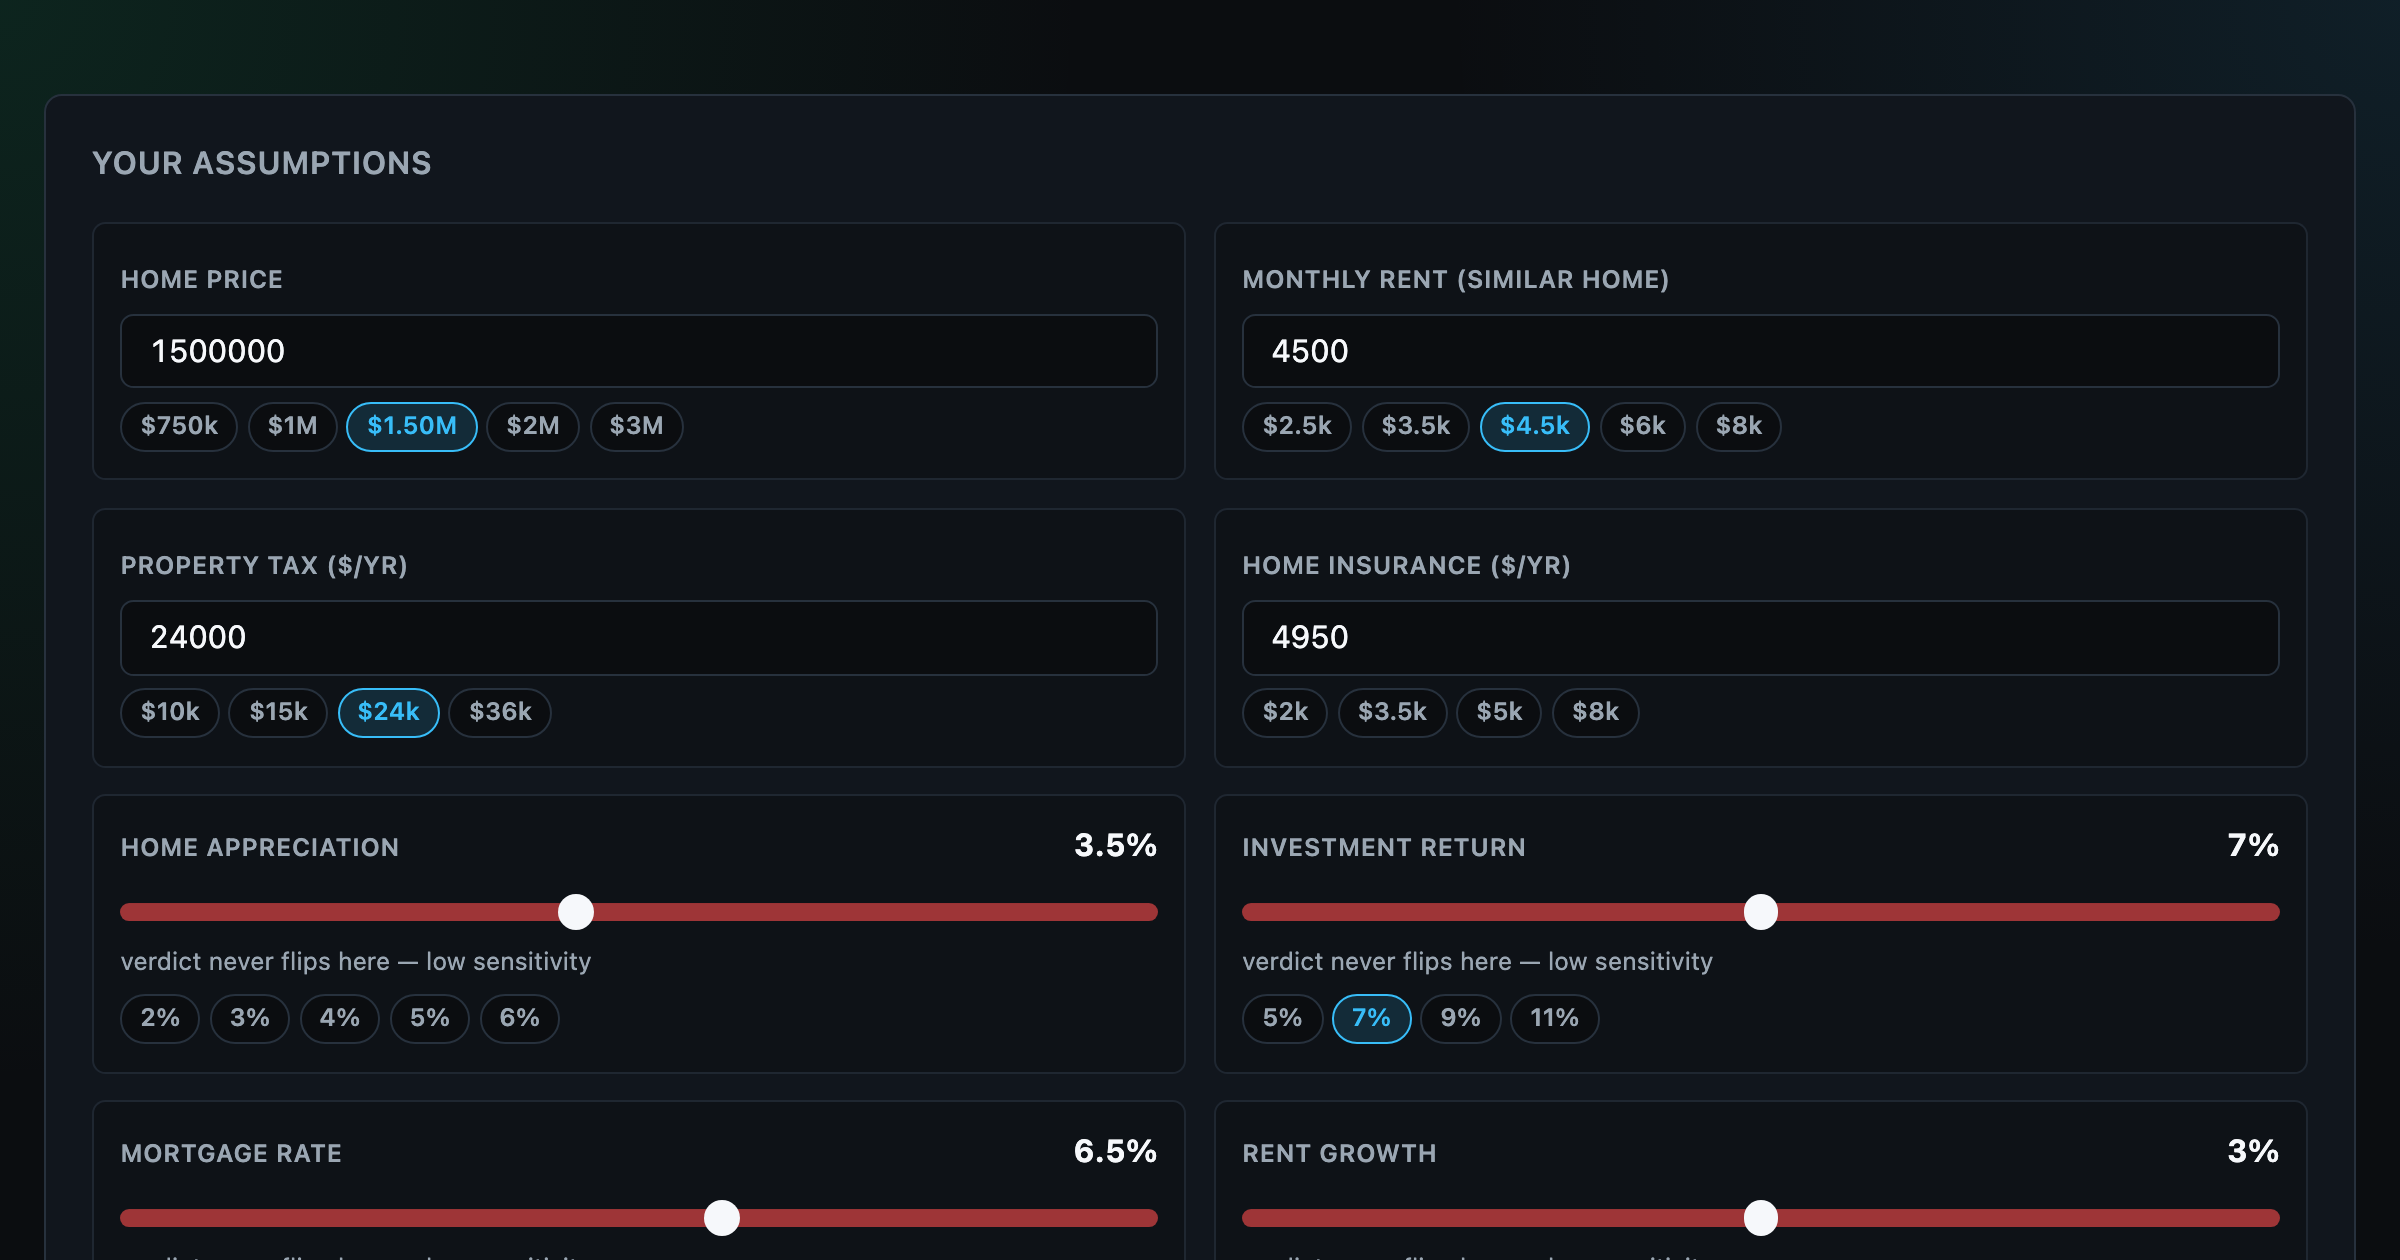
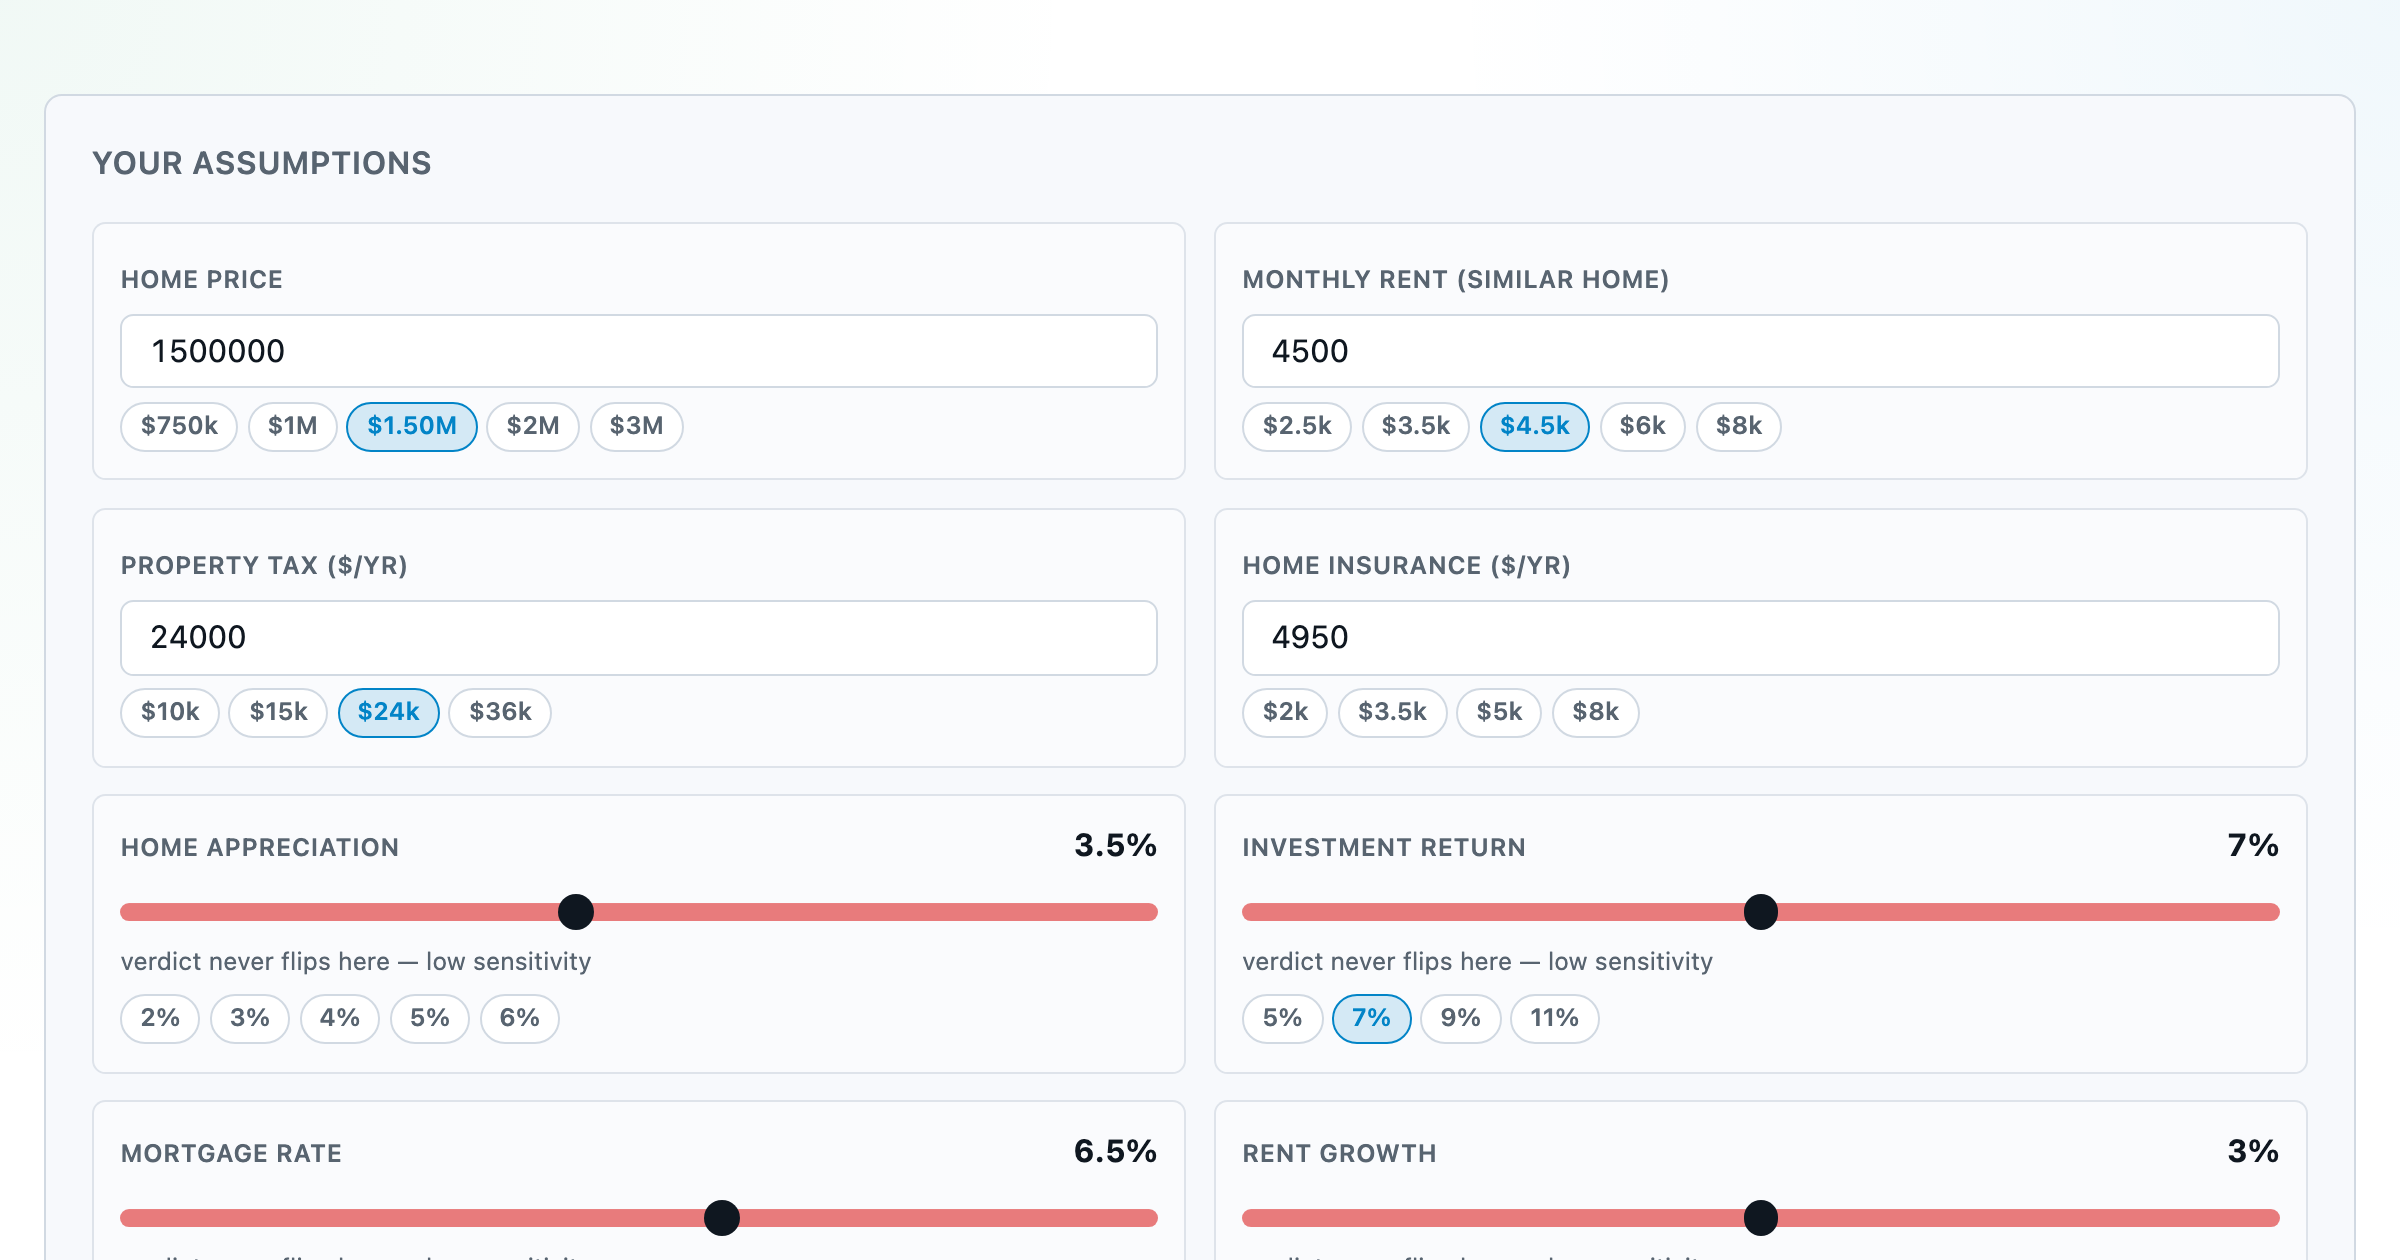
Should you rent or buy? Net-wealth verdict with sensitivity analysis of every assumption.
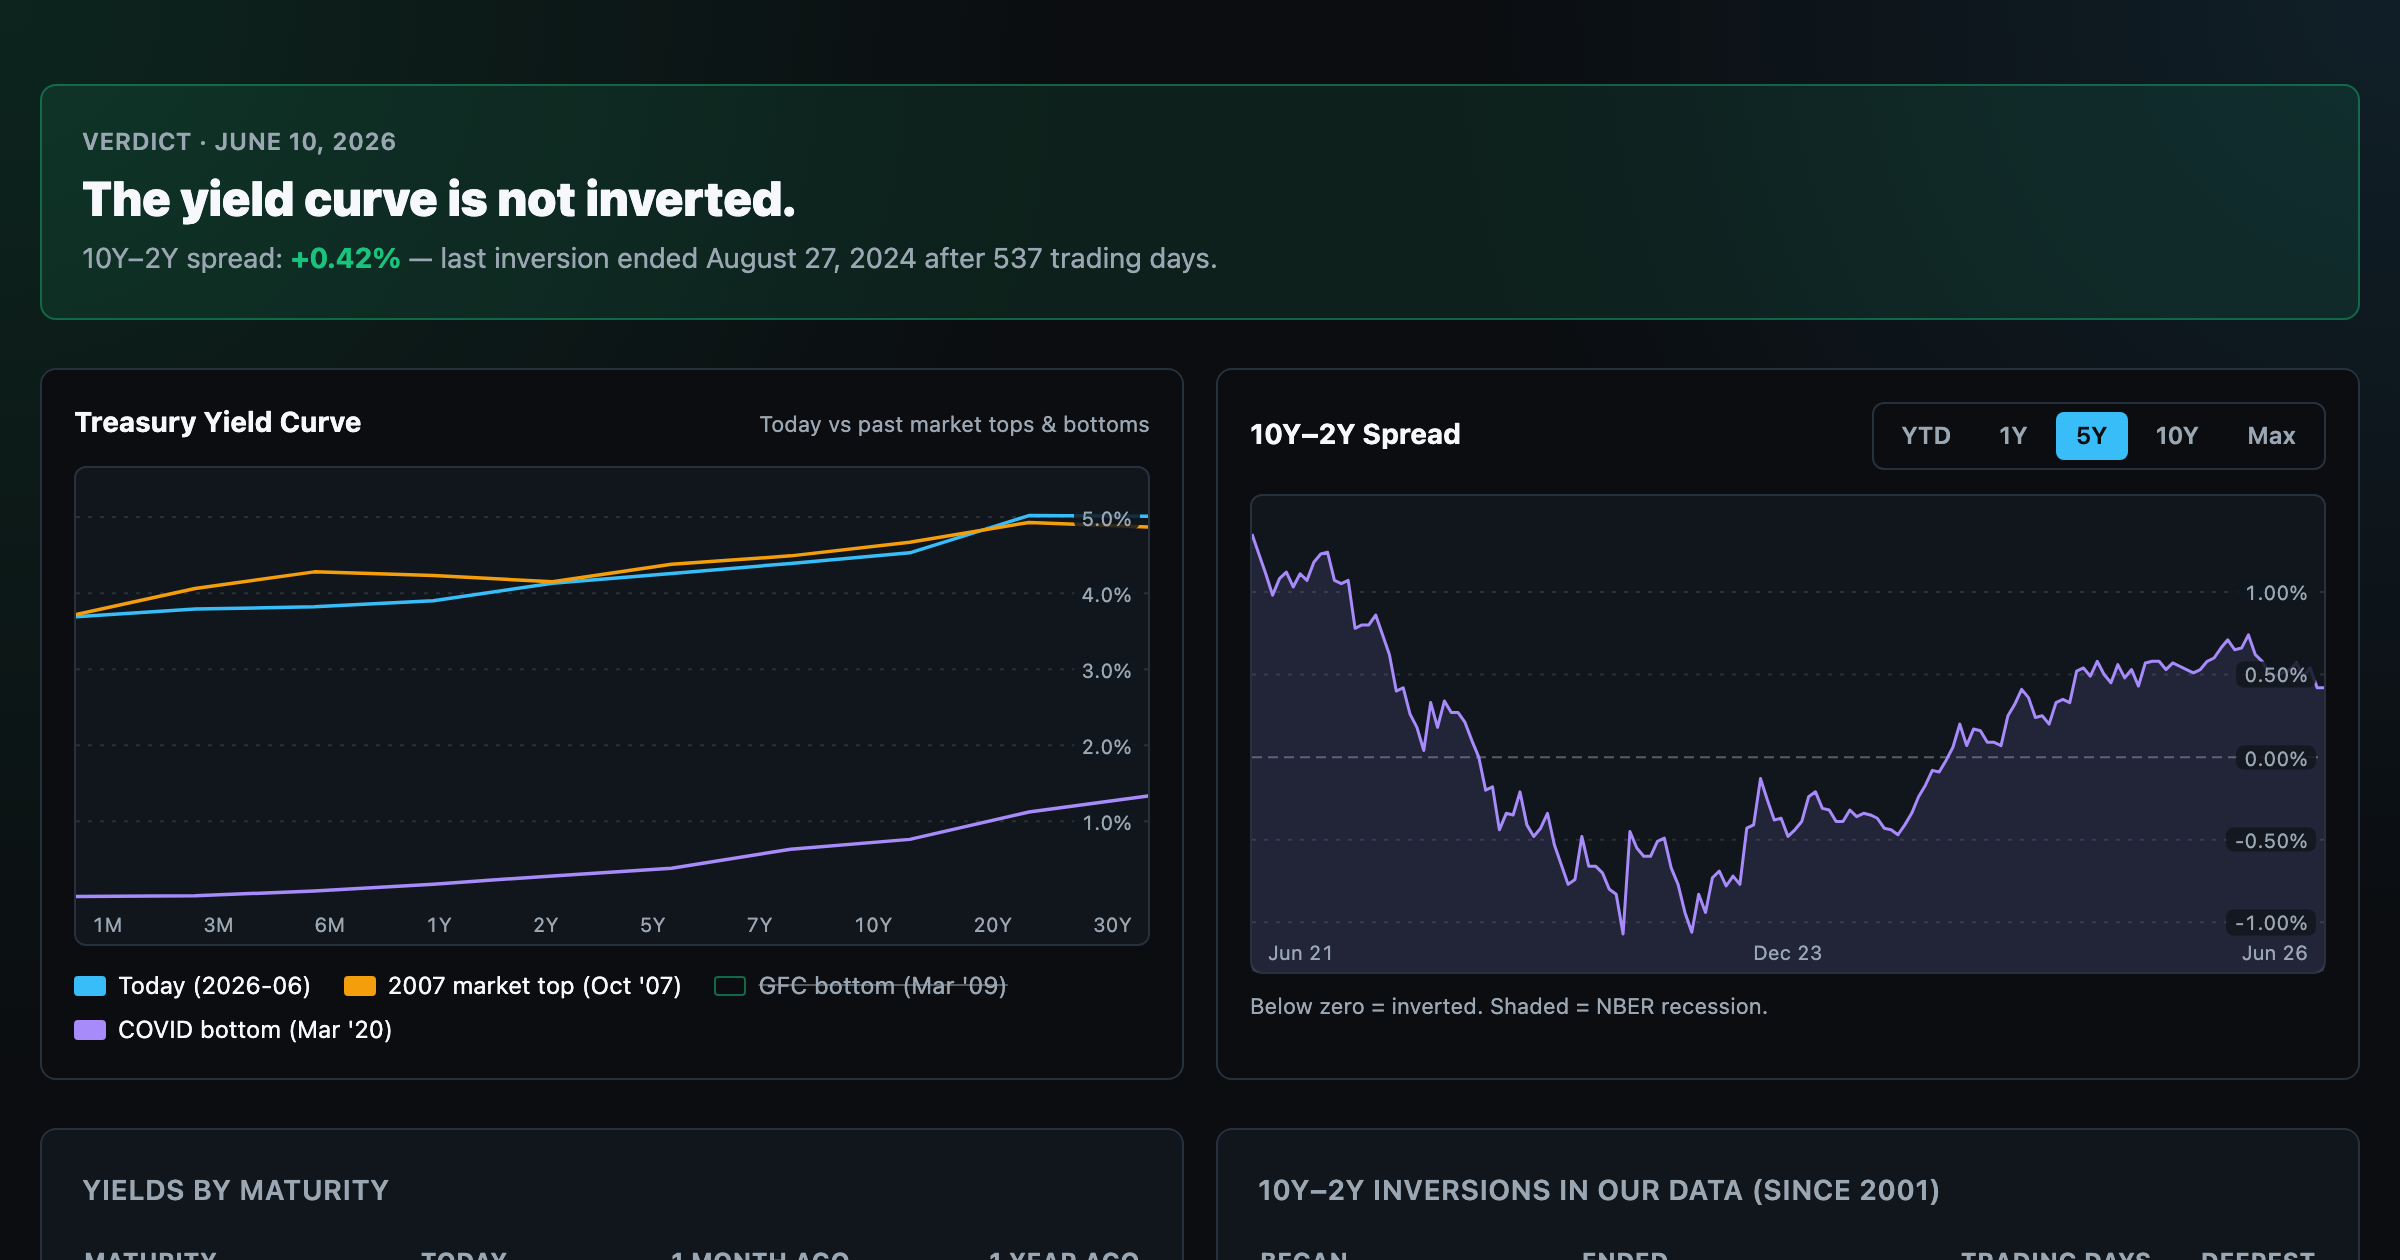
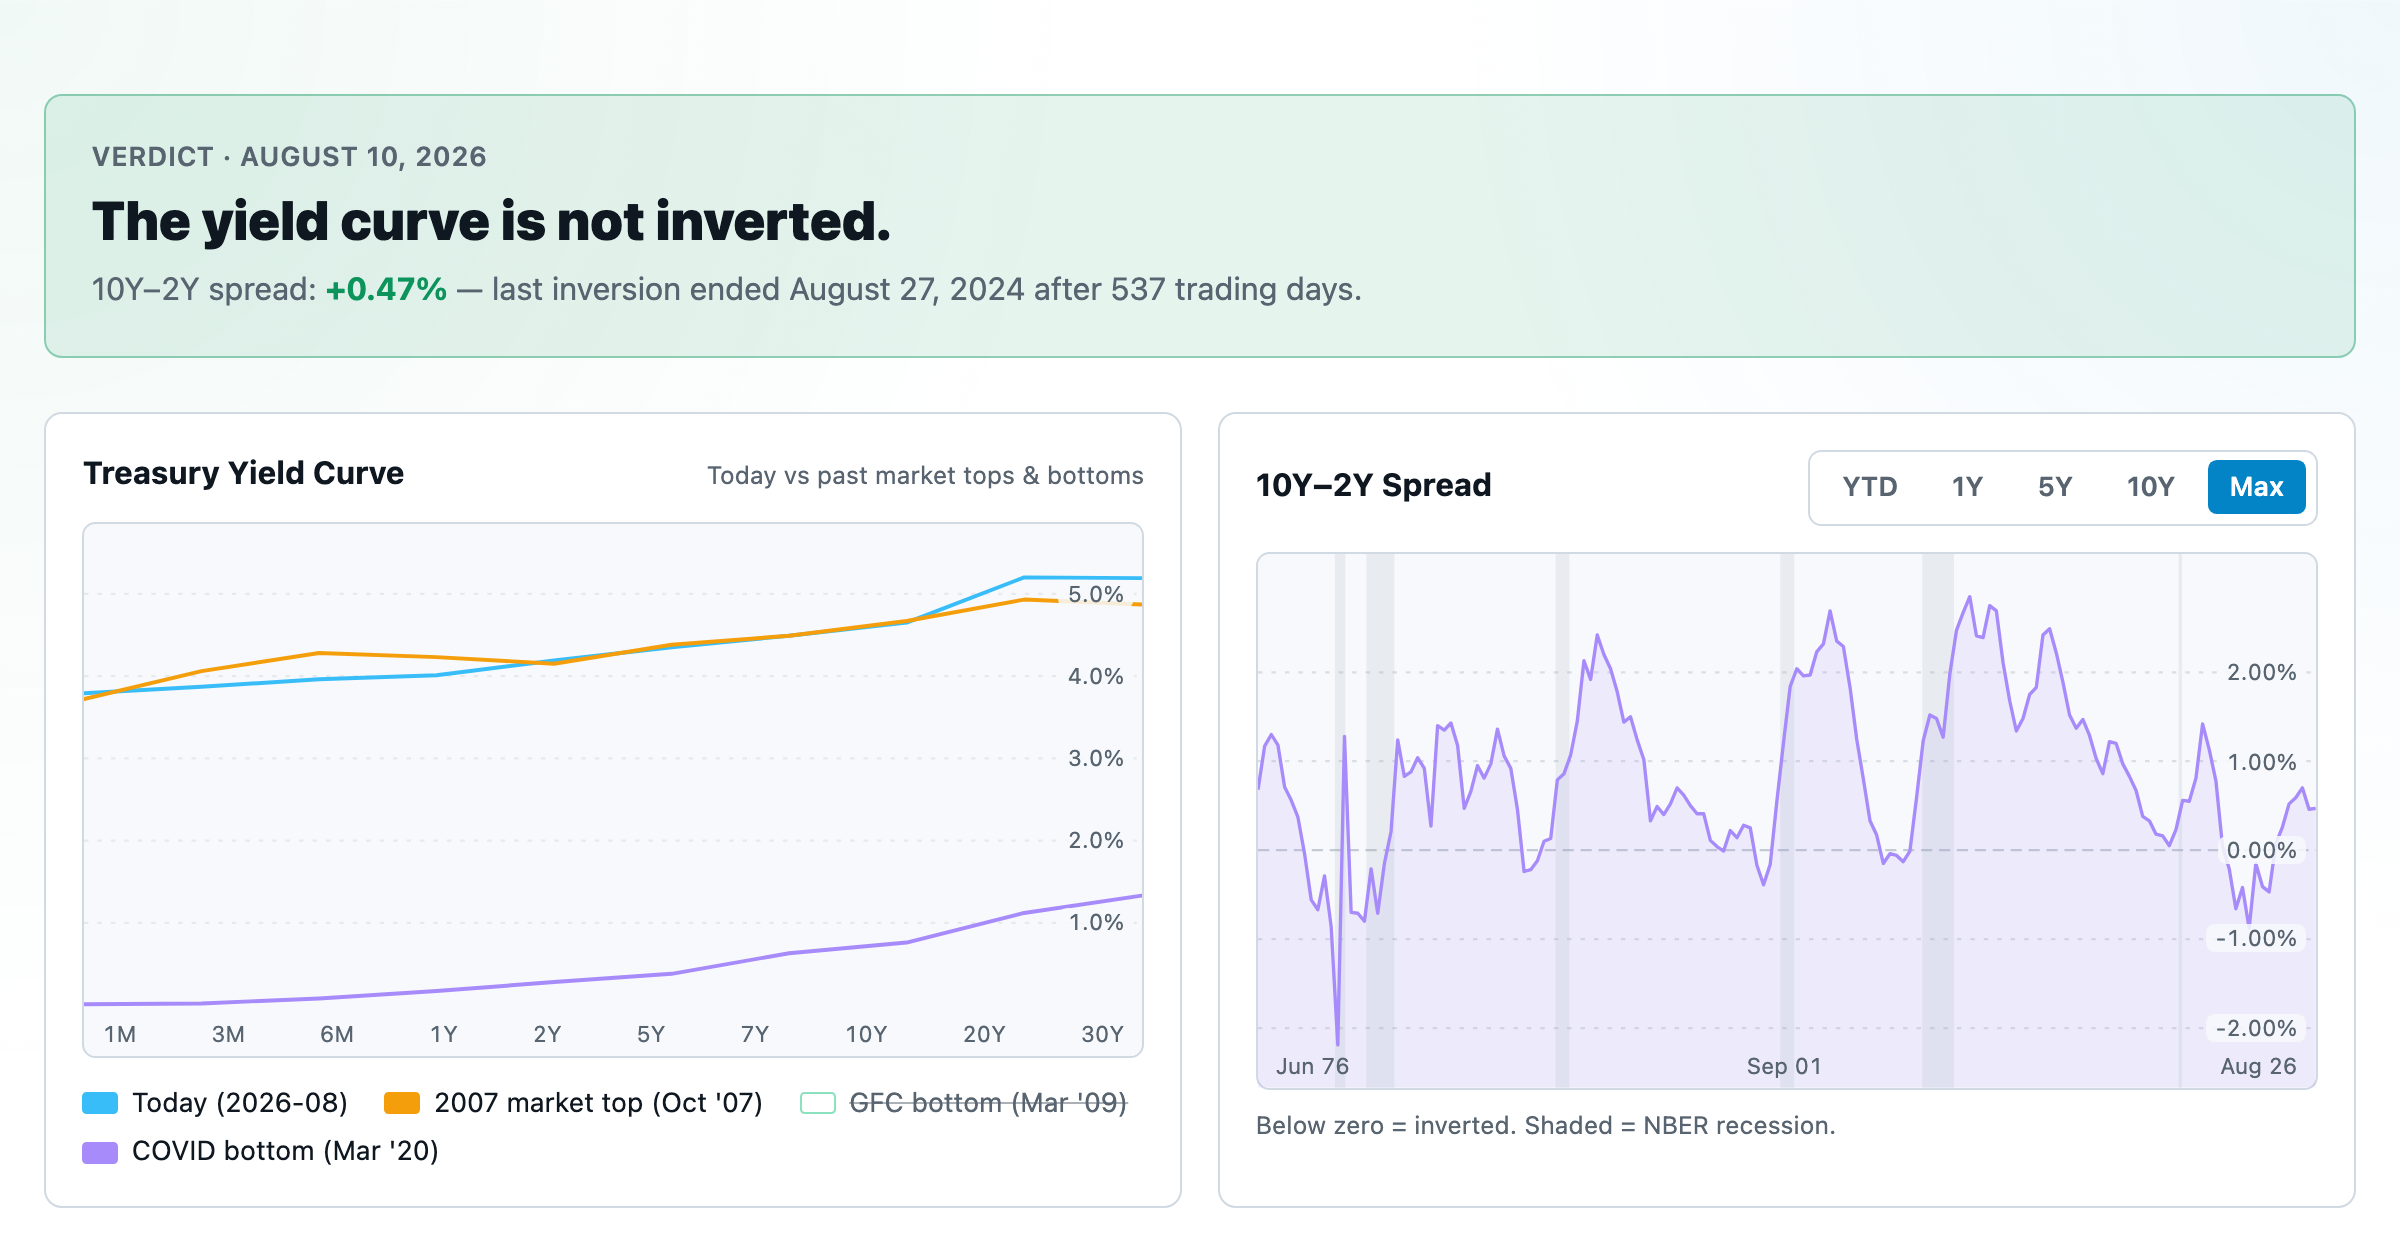
Live term structure, the 10Y–2Y spread, and every inversion episode.