
A $400,000
home with 20%
$80,000 down, $320,000 borrowed. down, at 6.76%
for 30 years
$400,000
20%
$80,000 down, $320,000 borrowed.6.76%
30 years
with 1.1%
$367/mo — $4,400 a year on this home.0.35%
$117/mo — $1,400 a year on this home.$0.00
A $320,000 mortgage at 6.76% over 30 years is $2,078/mo in principal & interest — $2,561/mo with property tax and insurance — and $427,951 in total interest over 30 yr. Change any figure above to see your monthly payment, principal-vs-interest split, balance paydown, and how extra payments shorten the loan.
Seeded with the 30-year fixed average of 6.76% — Freddie Mac's weekly survey for the week of Sep 10, 2026. See rates back to 1971 →
Monthly payment breakdown— first payment
- Principal$275/mo11%
- Interest$1,803/mo70%
- Tax$367/mo14%
- Insurance$117/mo5%
Principal vs interest shown for the first payment — the principal share grows every month.
Where your money goes— over the whole loan
- Principal$320,00043%
- Interest$427,95157%
Payment composition by year— equity built vs money gone for good
Each month: equity built vs money gone— principal vs interest + tax + insurance
"Gone for good" = interest + property tax + insurance — money that never comes back. Equity/mo is the principal you pay off; it rises every month as the balance shrinks, and from month 275 your payment builds more than it burns.
Loan balance over time— remaining principal
Amortization schedule, by year
| Year | Principal paid | Interest paid | Balance |
|---|---|---|---|
| 1 | $3,404 | $21,528 | $316,596 |
| 2 | $3,641 | $21,290 | $312,955 |
| 3 | $3,895 | $21,037 | $309,060 |
| 4 | $4,167 | $20,765 | $304,893 |
| 5 | $4,457 | $20,474 | $300,436 |
| 6 | $4,768 | $20,164 | $295,667 |
| 7 | $5,101 | $19,831 | $290,567 |
| 8 | $5,456 | $19,475 | $285,110 |
| 9 | $5,837 | $19,095 | $279,273 |
| 10 | $6,244 | $18,688 | $273,029 |
| 11 | $6,679 | $18,252 | $266,350 |
| 12 | $7,145 | $17,787 | $259,205 |
| 13 | $7,643 | $17,288 | $251,562 |
| 14 | $8,176 | $16,755 | $243,385 |
| 15 | $8,747 | $16,185 | $234,639 |
| 16 | $9,356 | $15,575 | $225,282 |
| 17 | $10,009 | $14,923 | $215,273 |
| 18 | $10,707 | $14,225 | $204,566 |
| 19 | $11,454 | $13,478 | $193,113 |
| 20 | $12,252 | $12,679 | $180,861 |
| 21 | $13,107 | $11,825 | $167,754 |
| 22 | $14,021 | $10,911 | $153,733 |
| 23 | $14,998 | $9,933 | $138,735 |
| 24 | $16,044 | $8,887 | $122,691 |
| 25 | $17,163 | $7,769 | $105,527 |
| 26 | $18,360 | $6,572 | $87,167 |
| 27 | $19,640 | $5,291 | $67,527 |
| 28 | $21,010 | $3,922 | $46,517 |
| 29 | $22,475 | $2,457 | $24,042 |
| 30 | $24,042 | $889 | $0.00 |
Methodology
Payments use the standard fixed-rate formula and assume a constant interest rate for the life of the loan. Property tax and homeowners insurance are estimated as an annual percentage of the home's value (US averages: ~1.1% tax, ~0.35% insurance) and added to the monthly payment as escrow — they don't affect the loan amortization. PMI and HOA dues are not included and vary by lender and location. "Extra / month" is applied to principal each month, which shortens the term and cuts total interest; the schedule is aggregated by year. Figures are estimates for planning, not a loan offer or financial advice.
FAQ#
- How is a monthly mortgage payment calculated?
- It uses the standard fixed-rate amortization formula — a level monthly principal-and-interest payment over the full term. For example, a $320,000 loan at 6.76% over 30 years works out to $2,078/month in principal and interest.
- What's included in the monthly payment?
- Principal and interest on the loan, plus optional escrow for property tax and homeowners insurance (estimated as a percentage of the home's value). PMI and HOA dues are not included — they vary by lender and location.
- How do extra payments save money?
- Any amount you add toward principal each month is applied directly to the loan balance, which shortens the term and cuts total interest. Set an extra-payment amount above to see exactly how many months and how much interest you'd save.
More visualizations
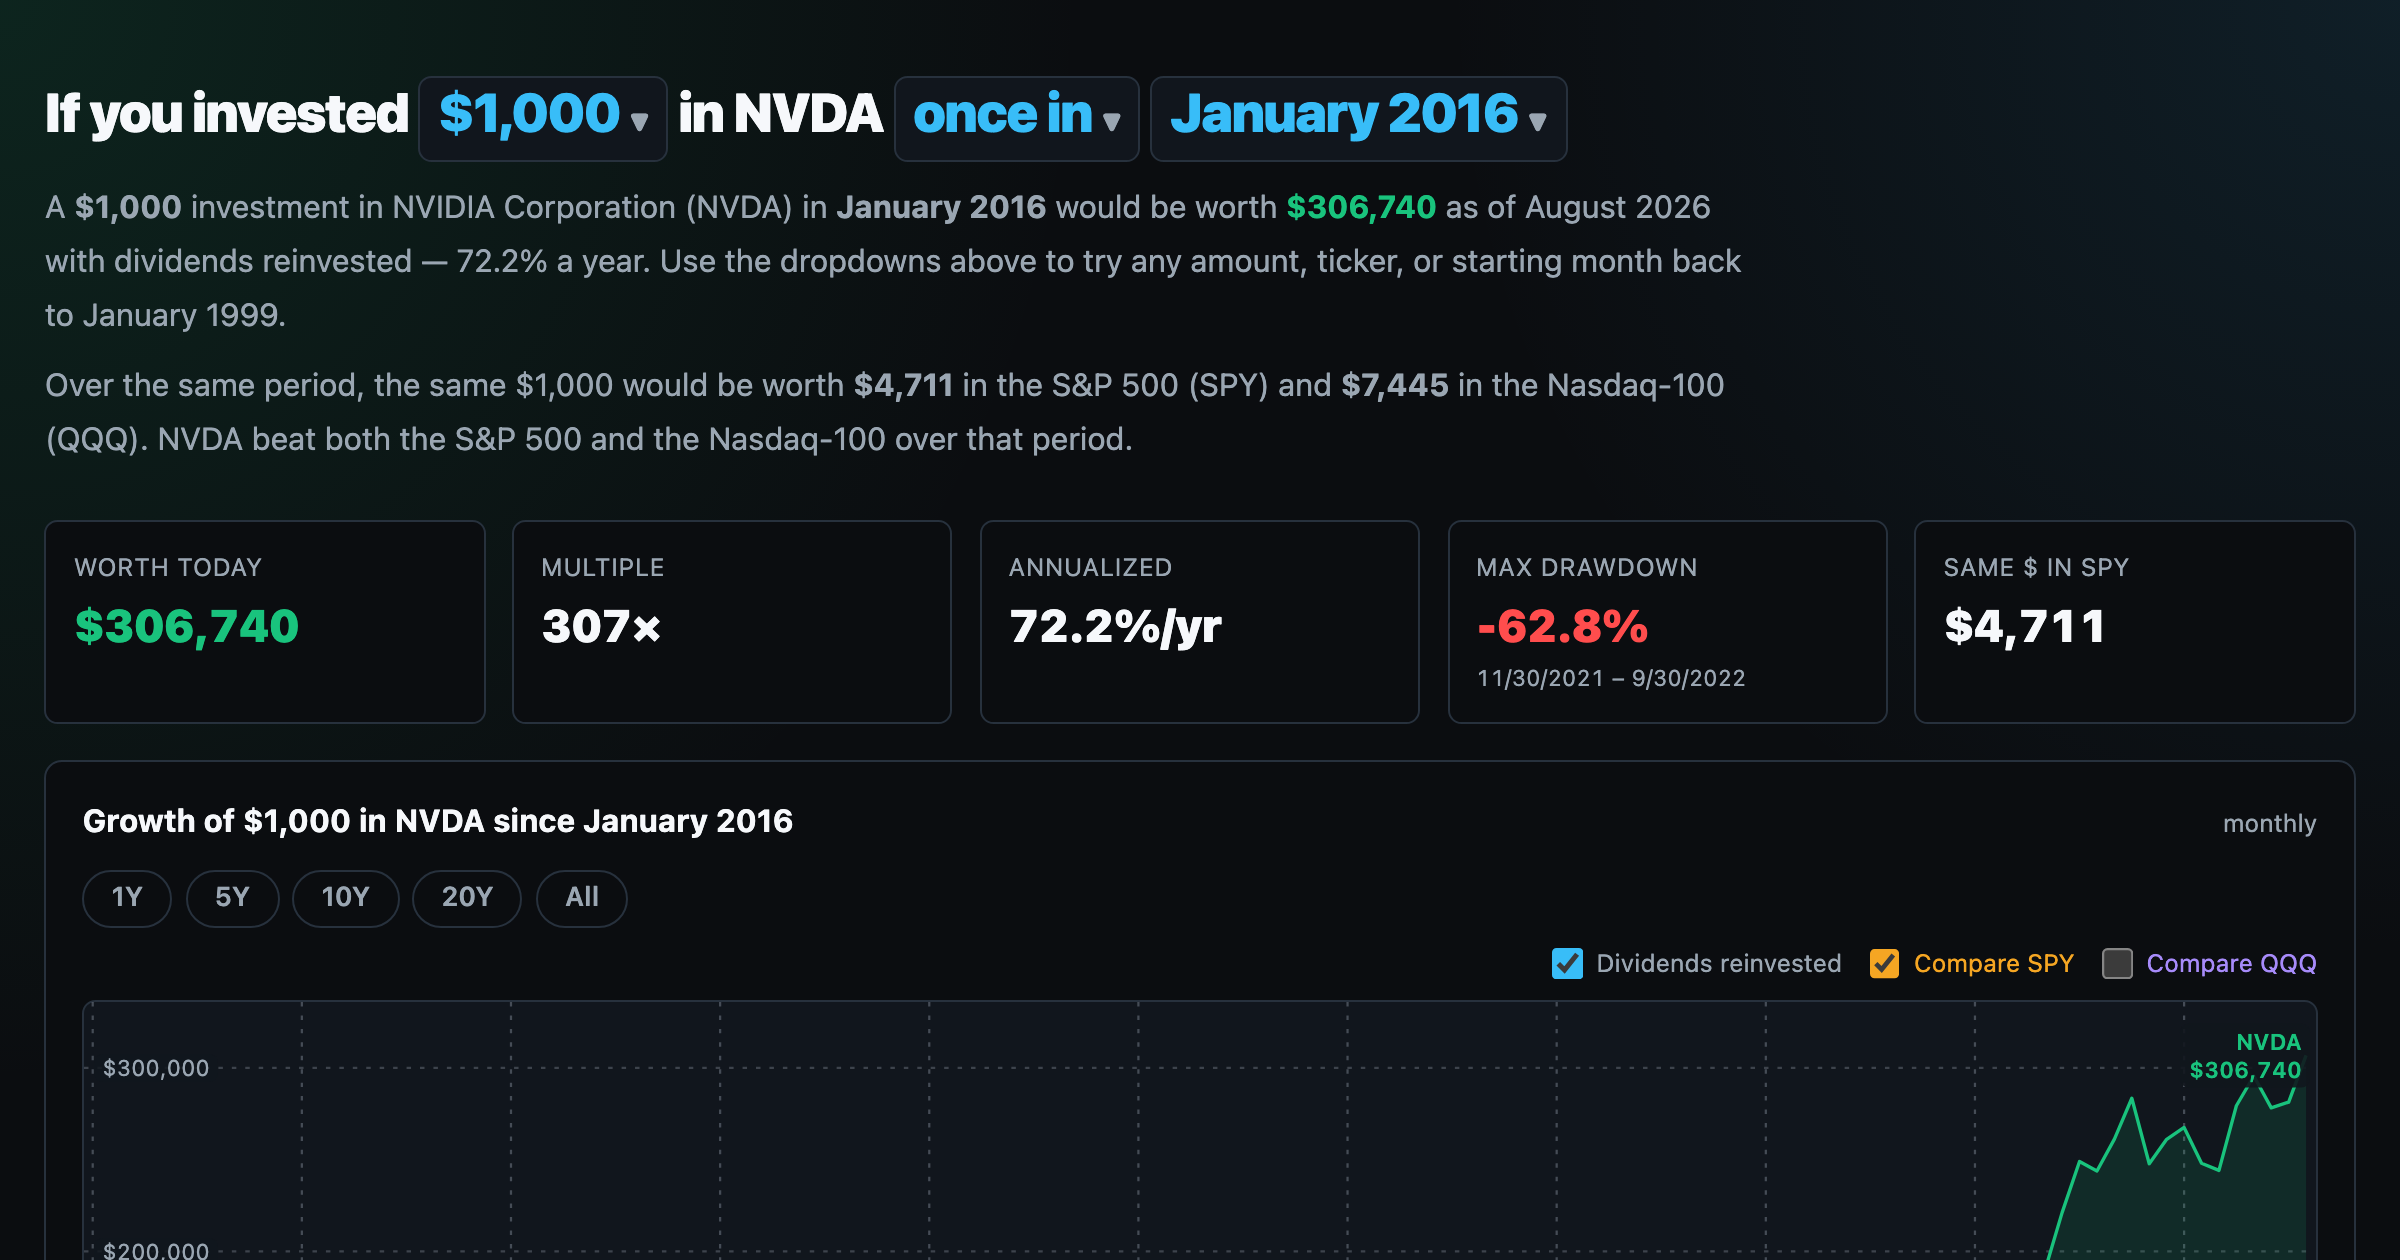
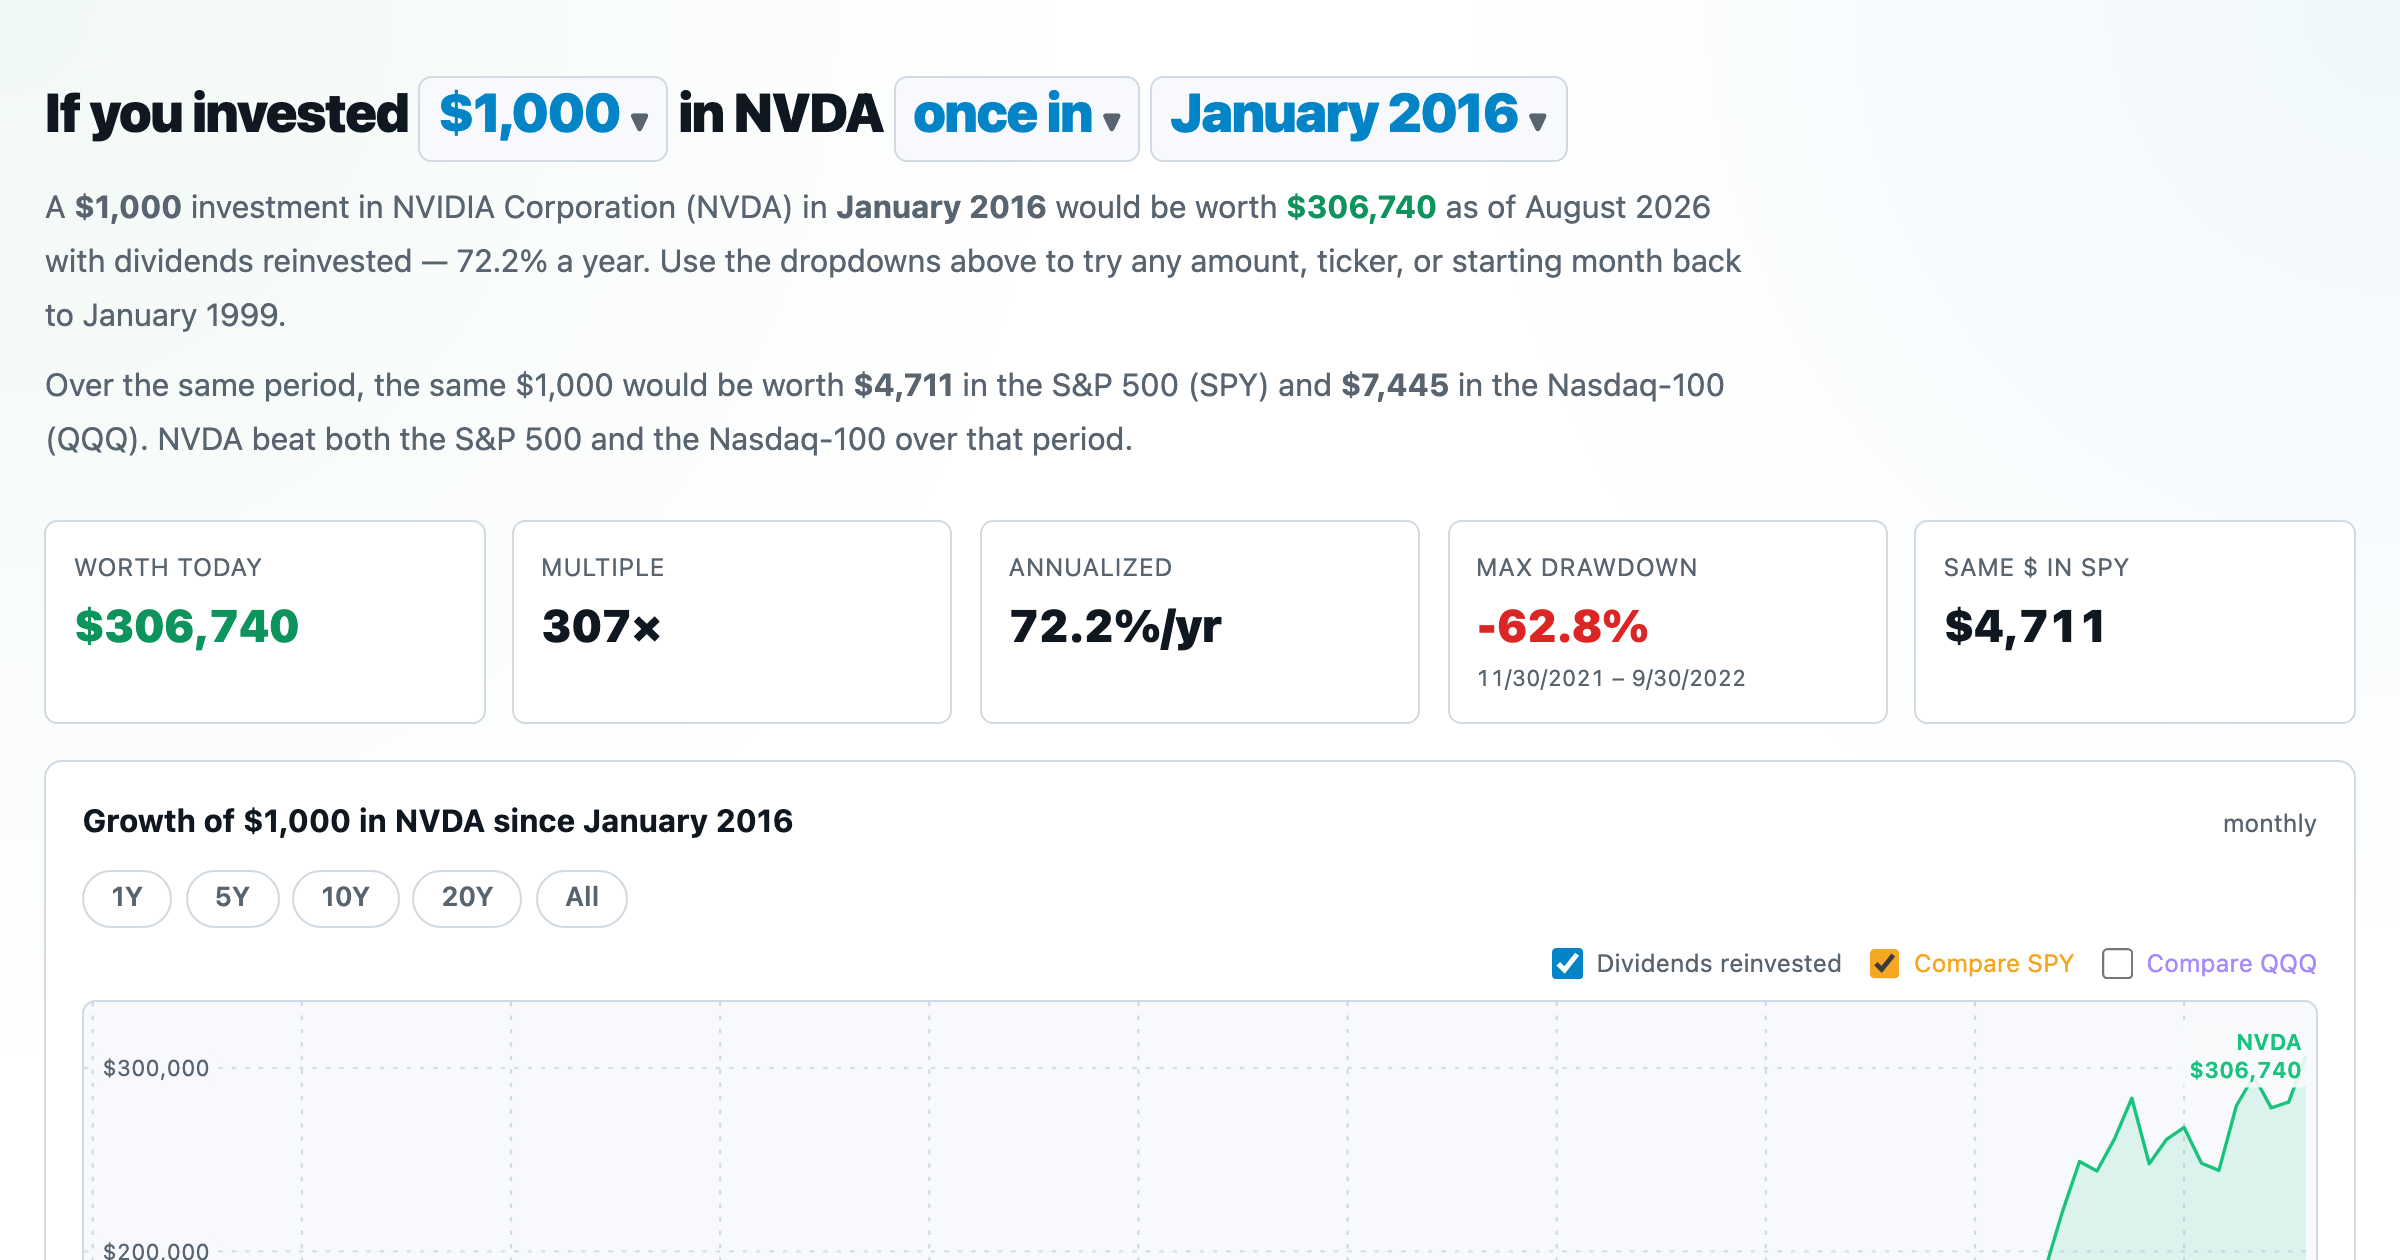
What $1,000 in any stock or ETF would be worth today.

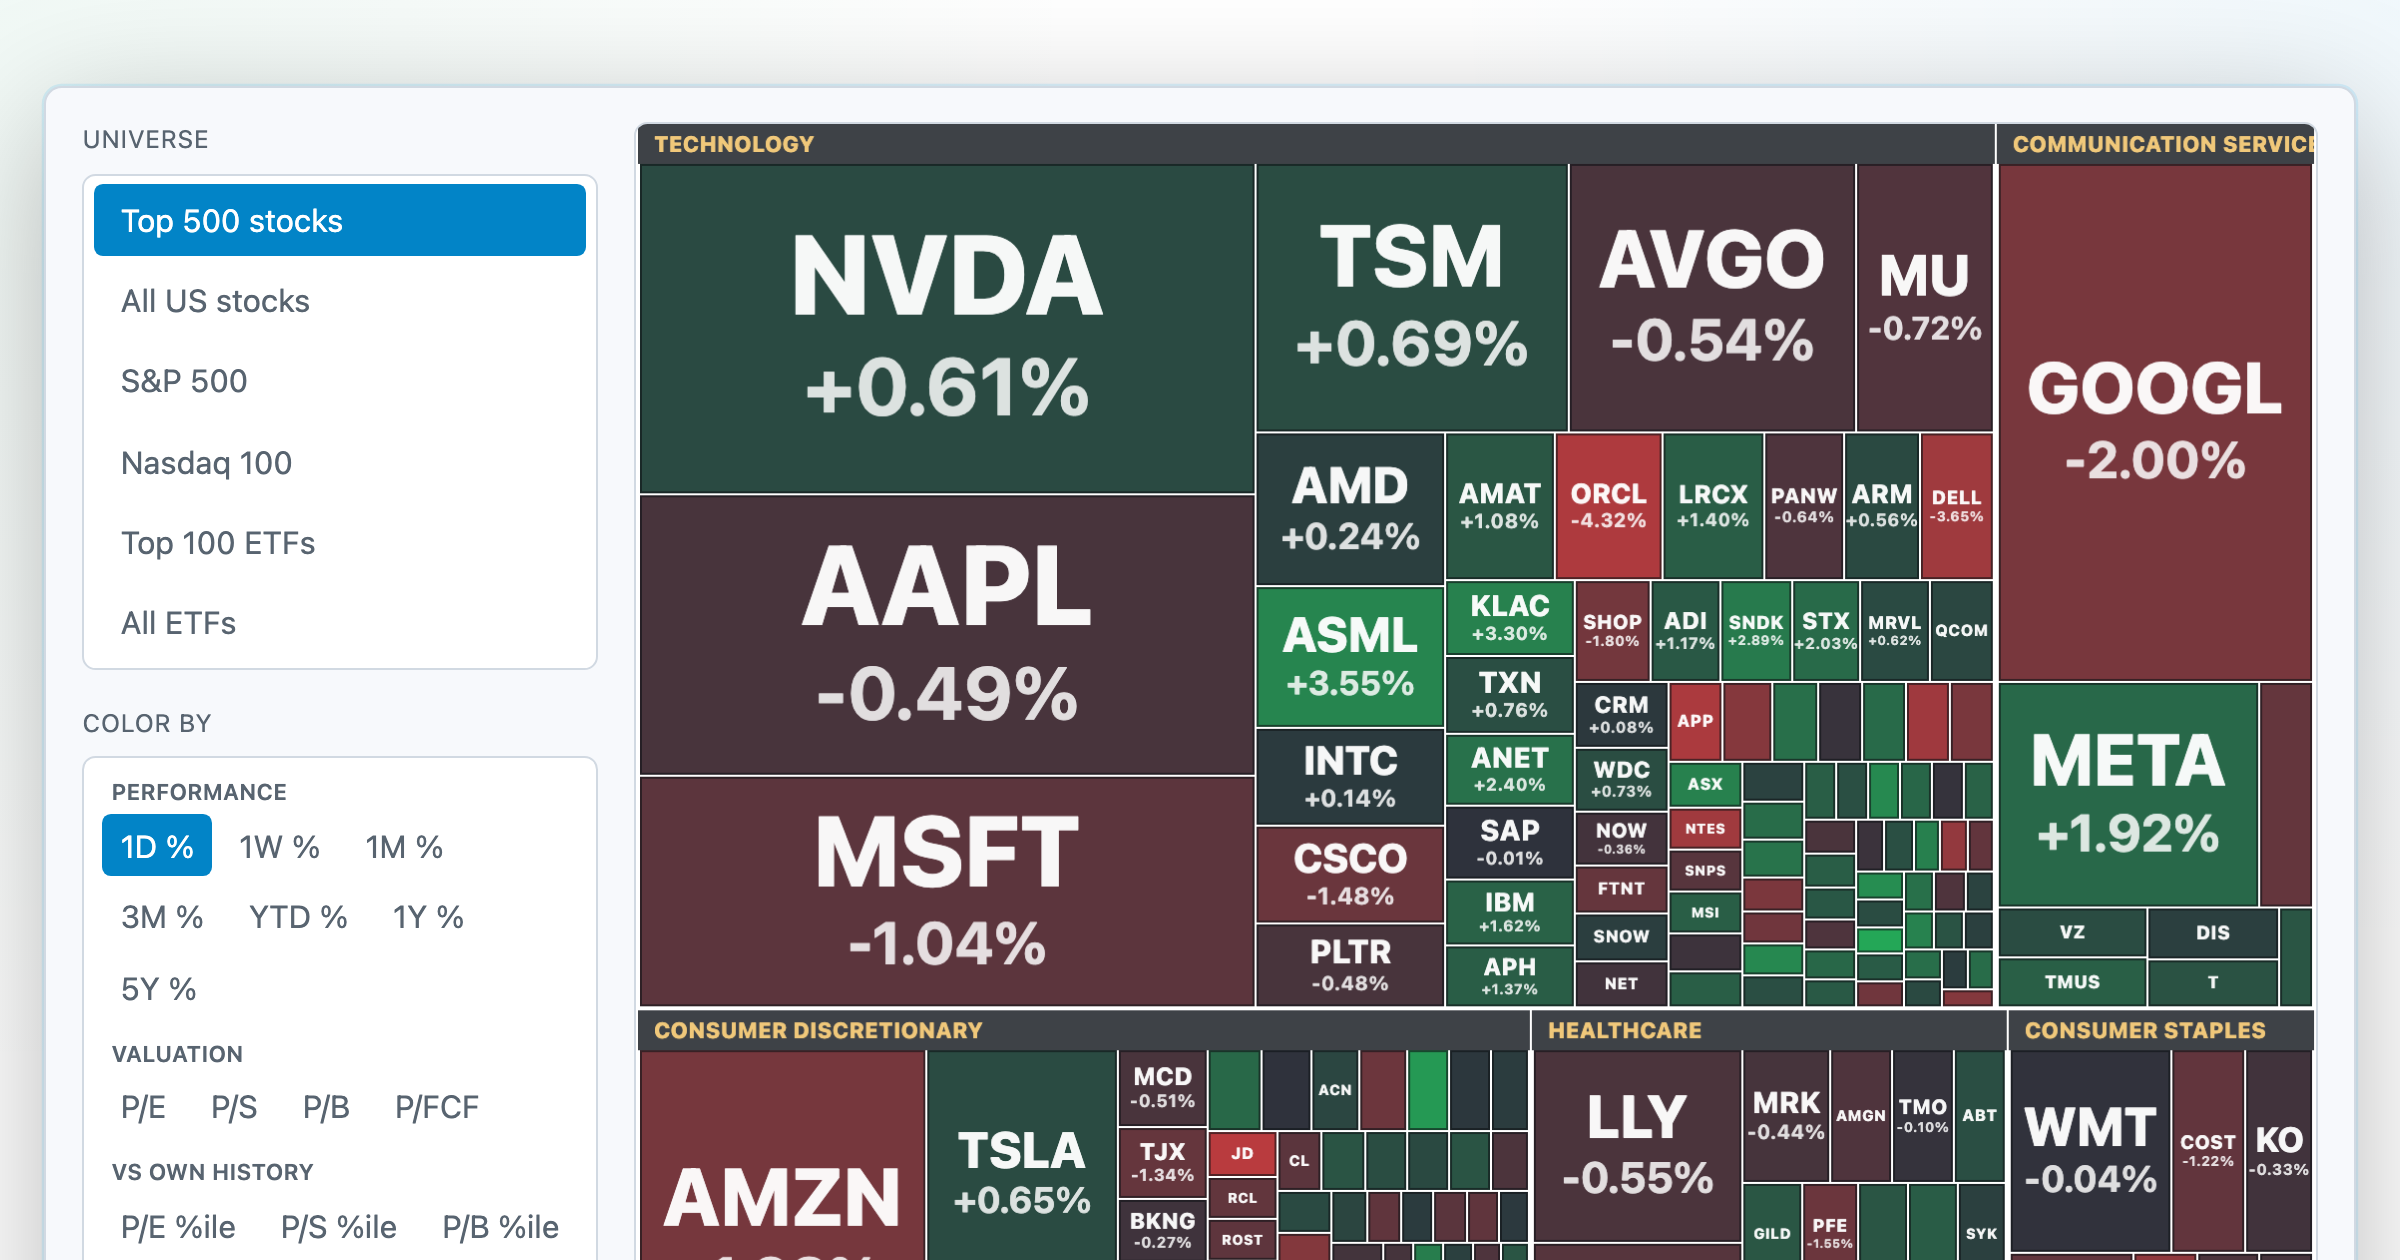
Every S&P 500 company sized by market cap — color by return or valuation.
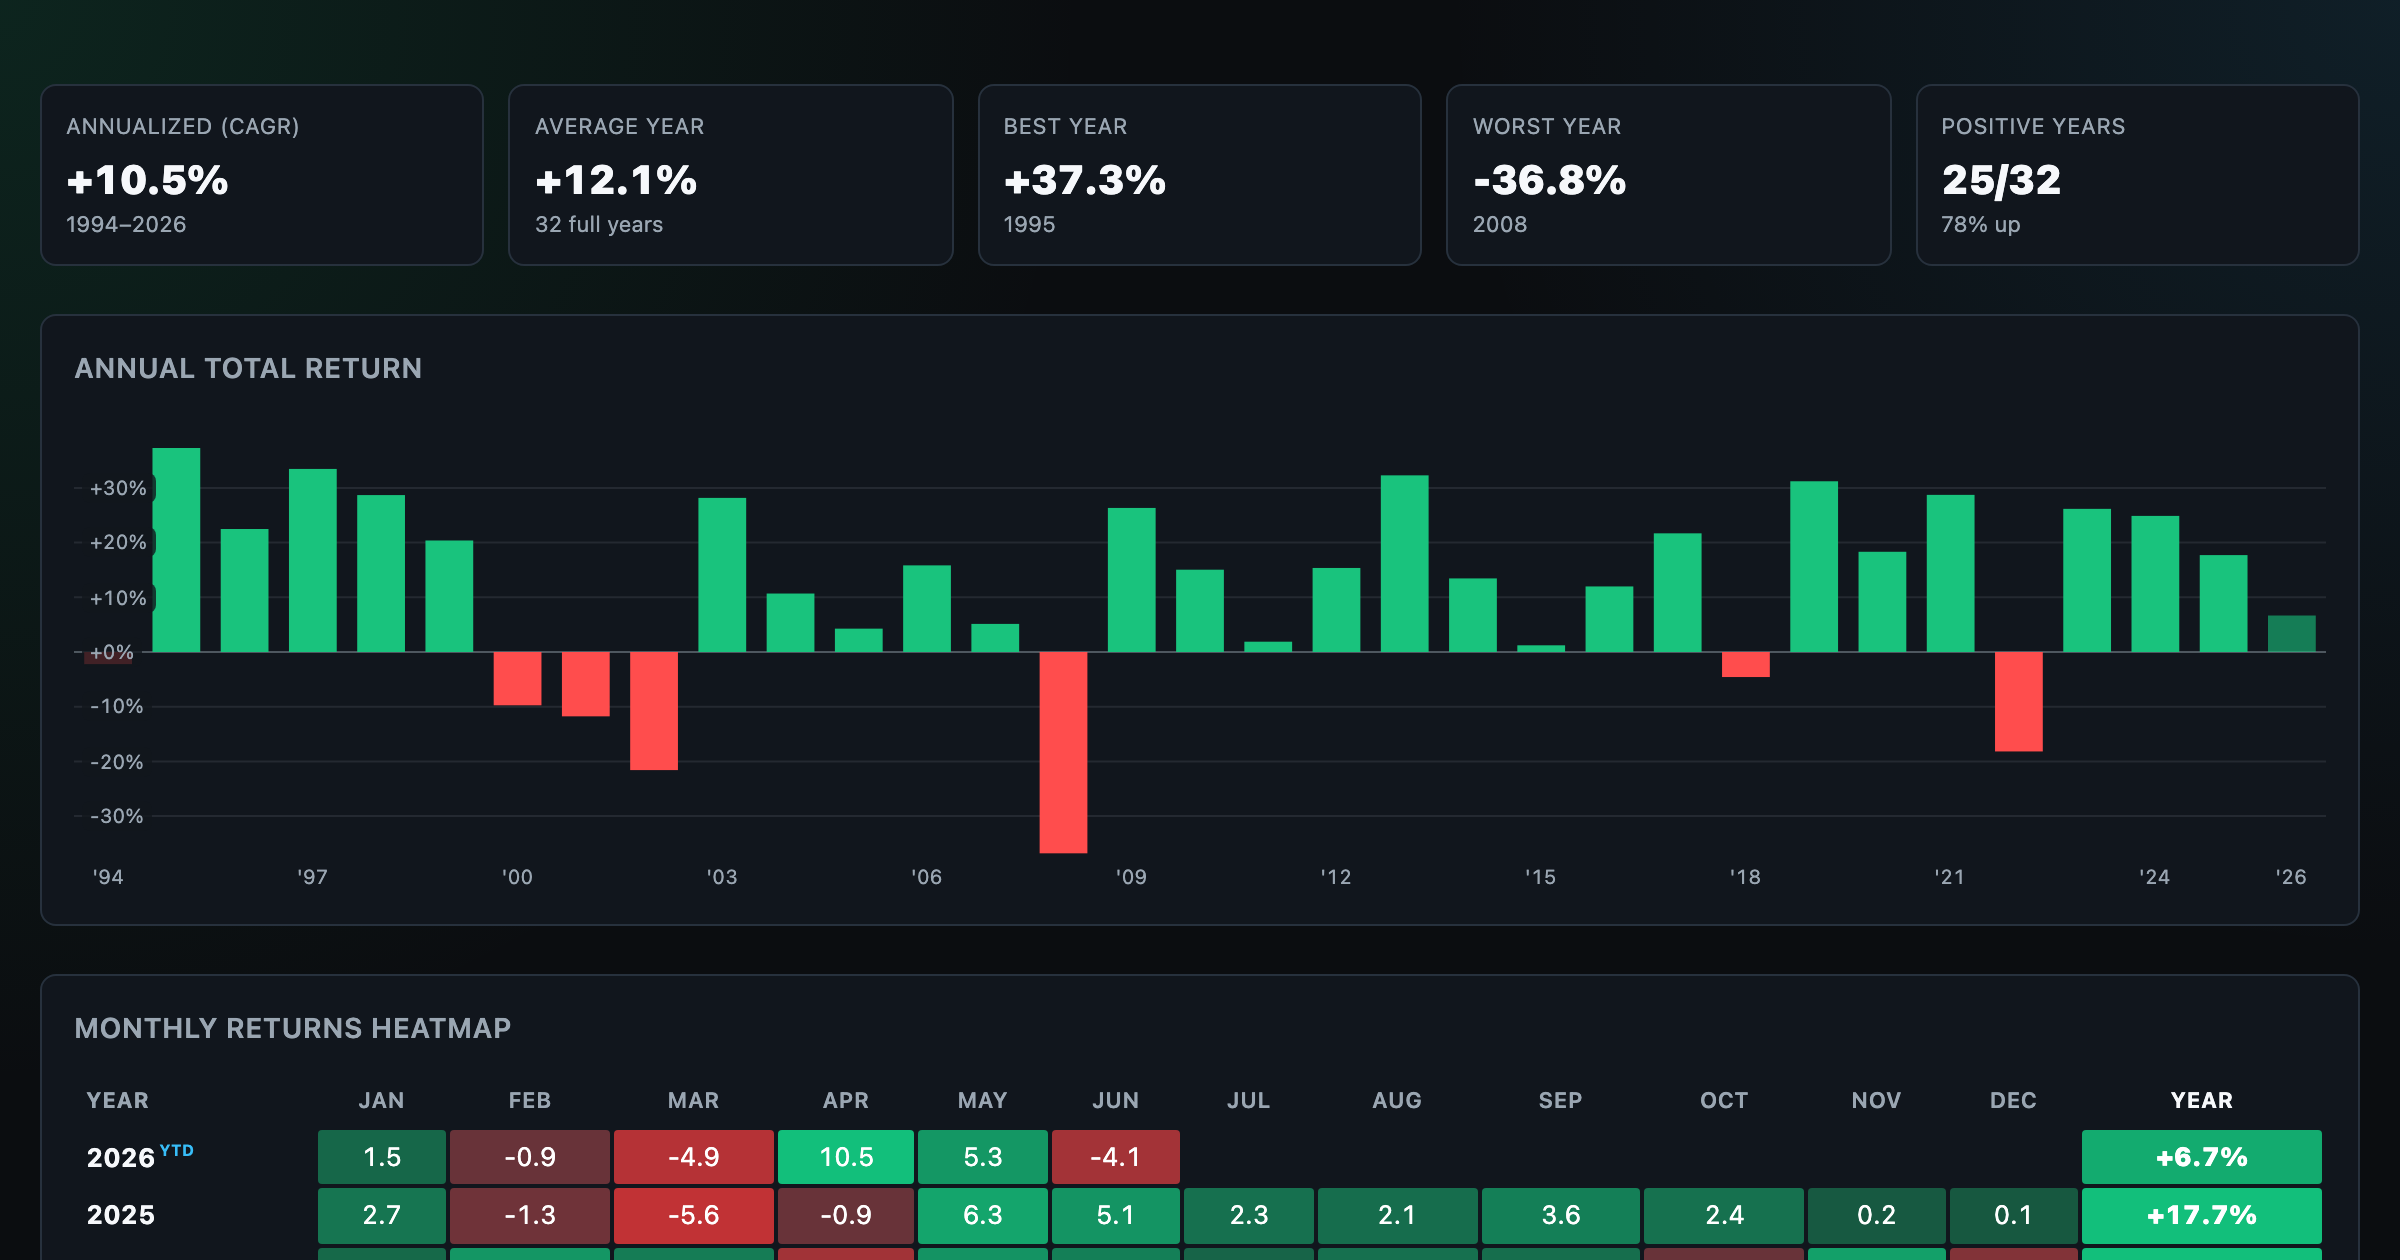
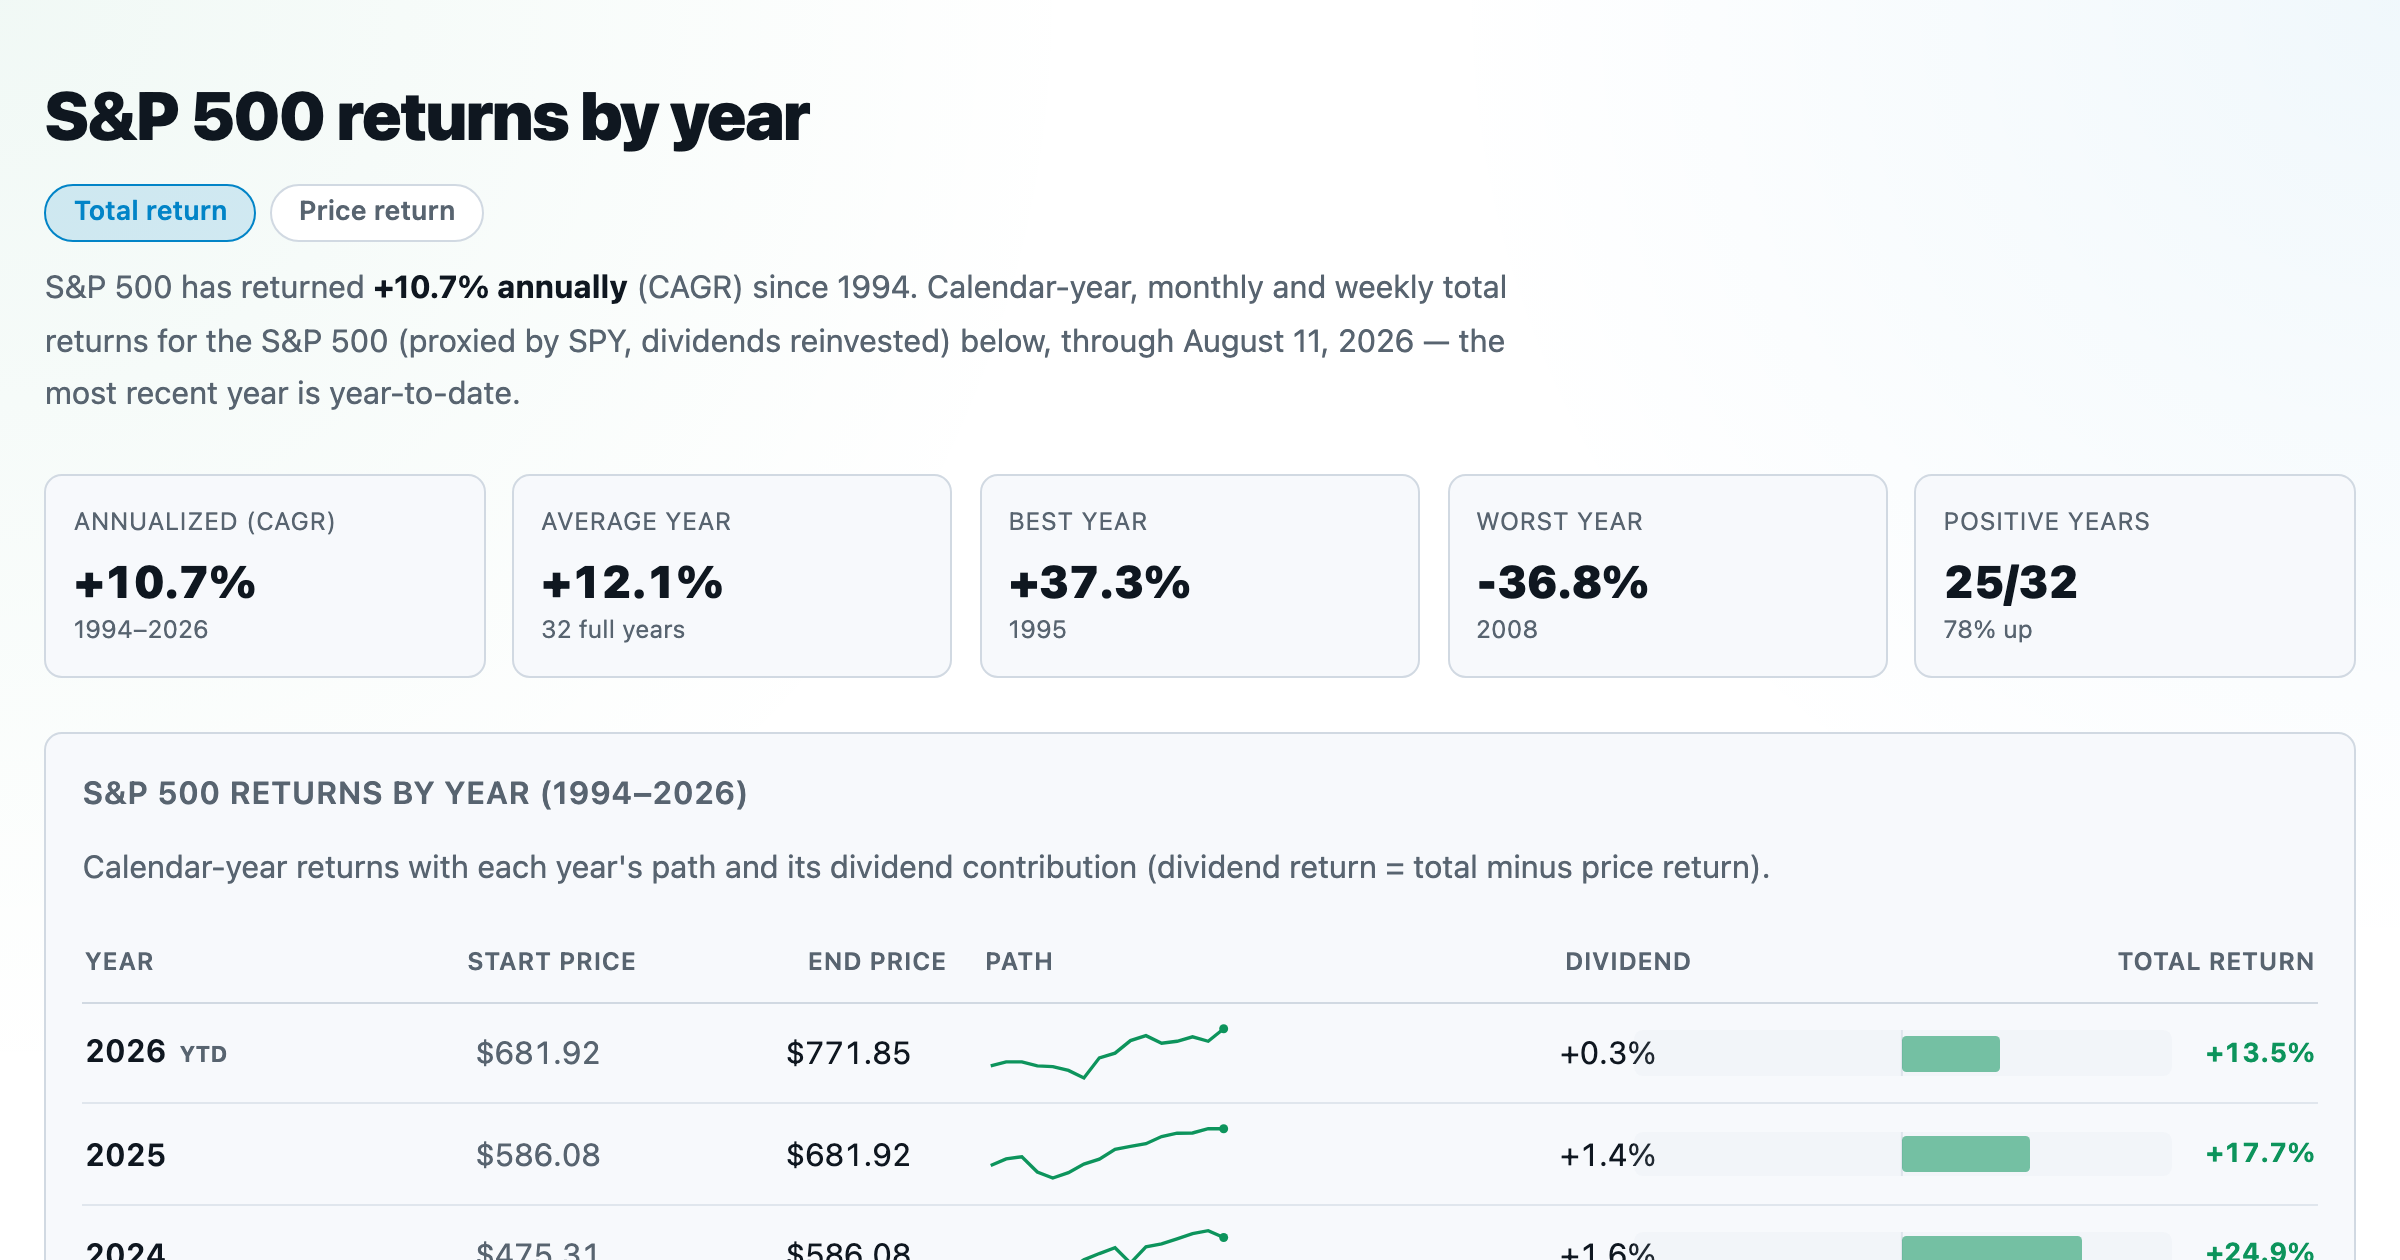
S&P 500 returns by year, month, week and trailing period — total or price return.
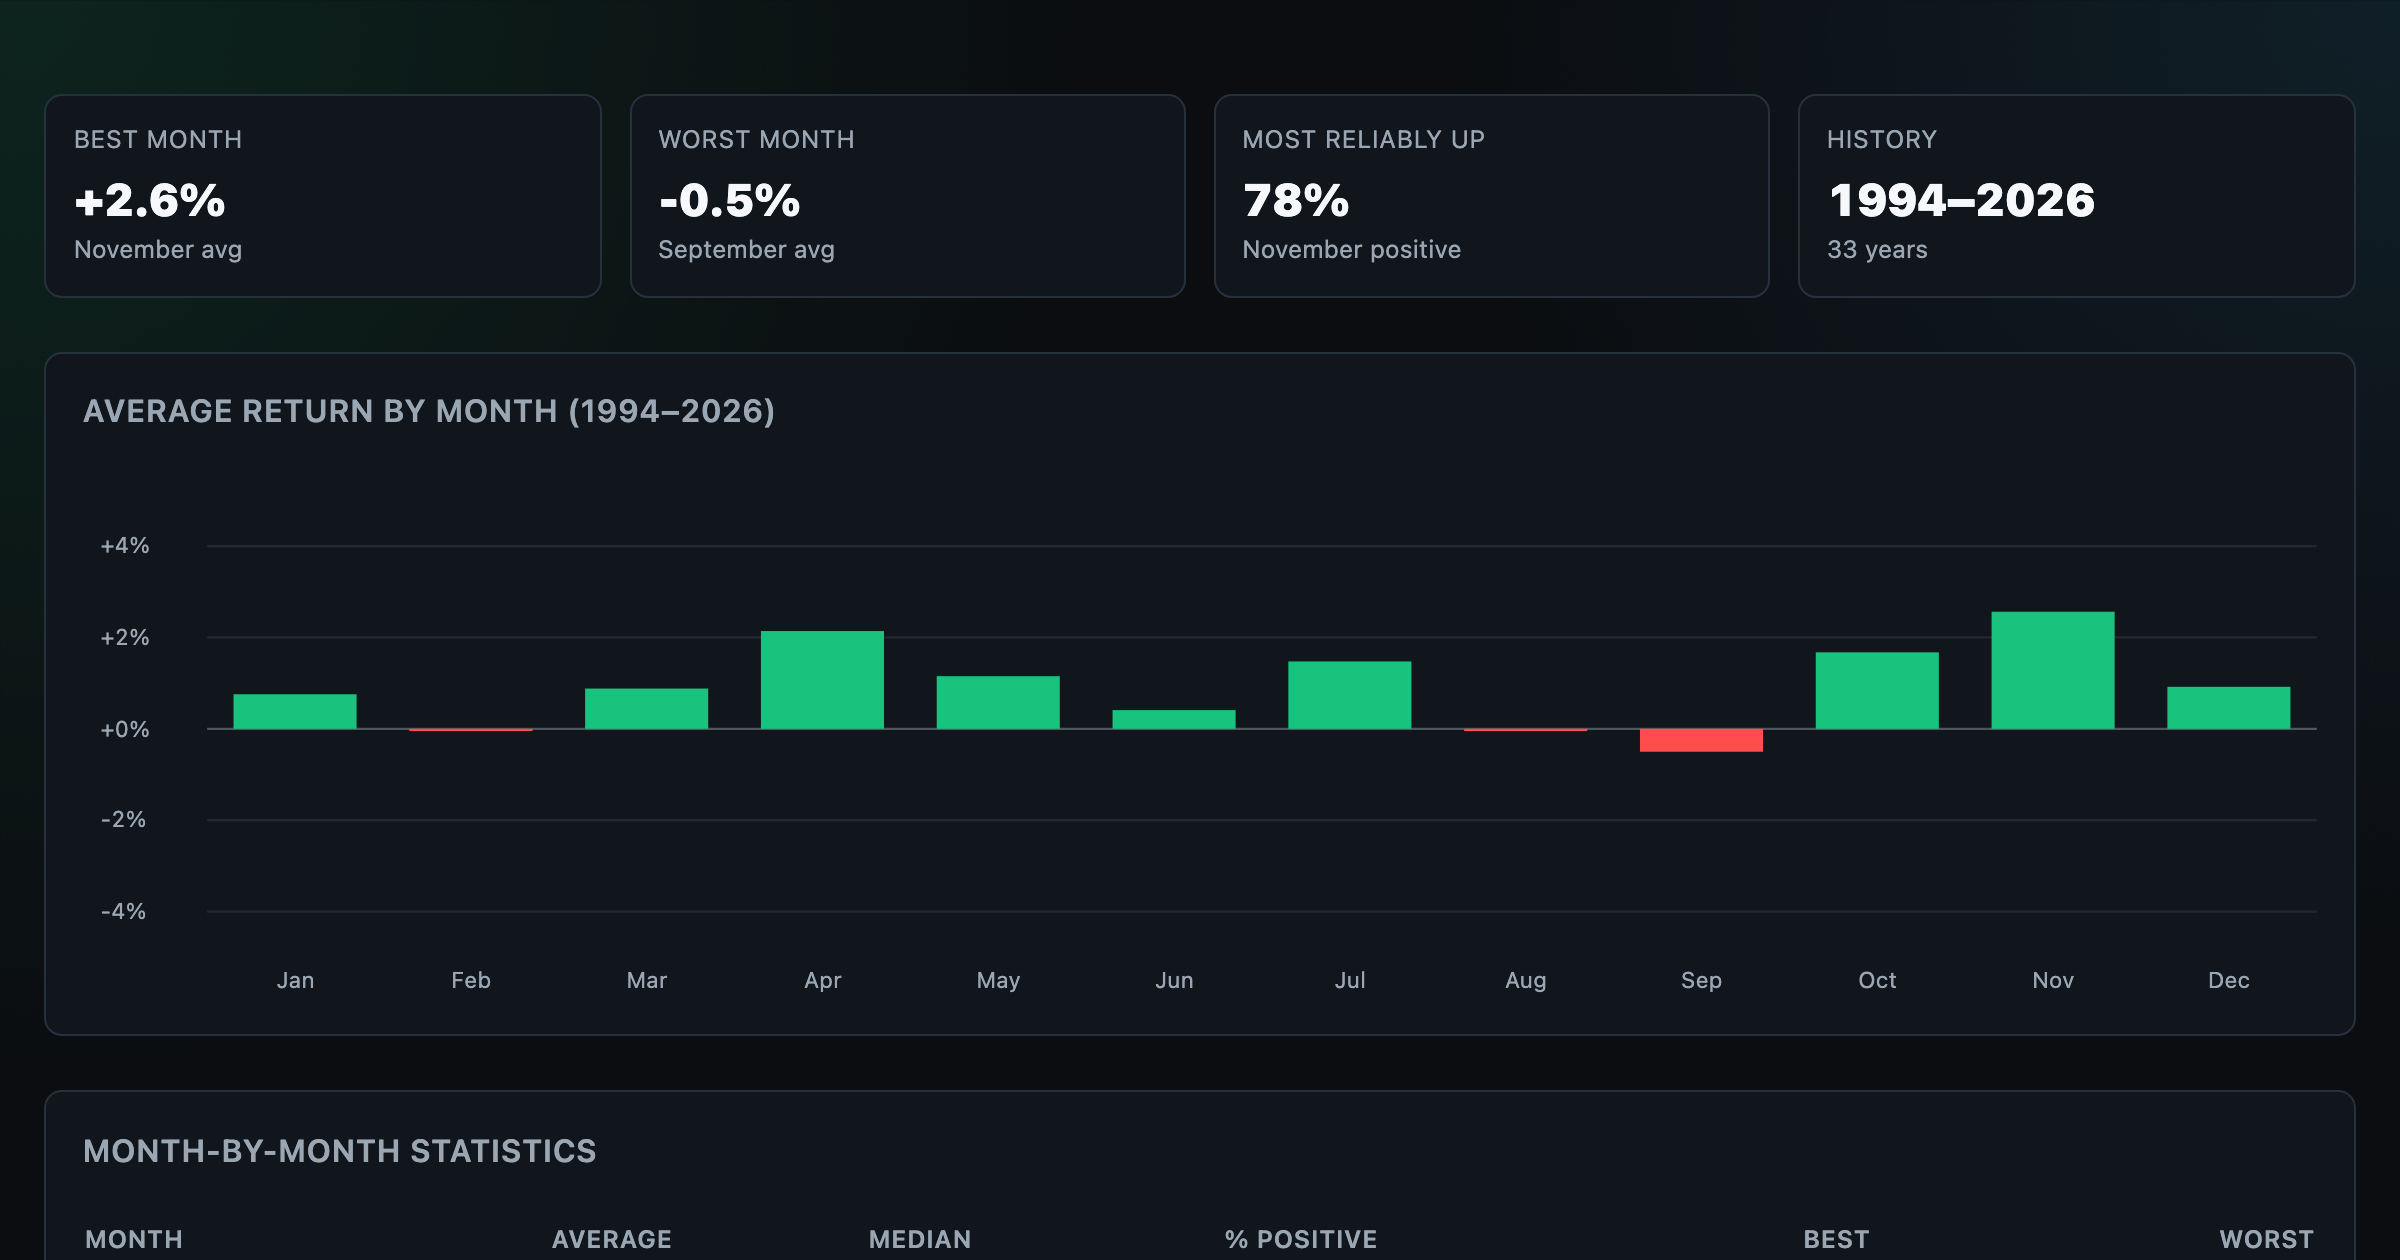
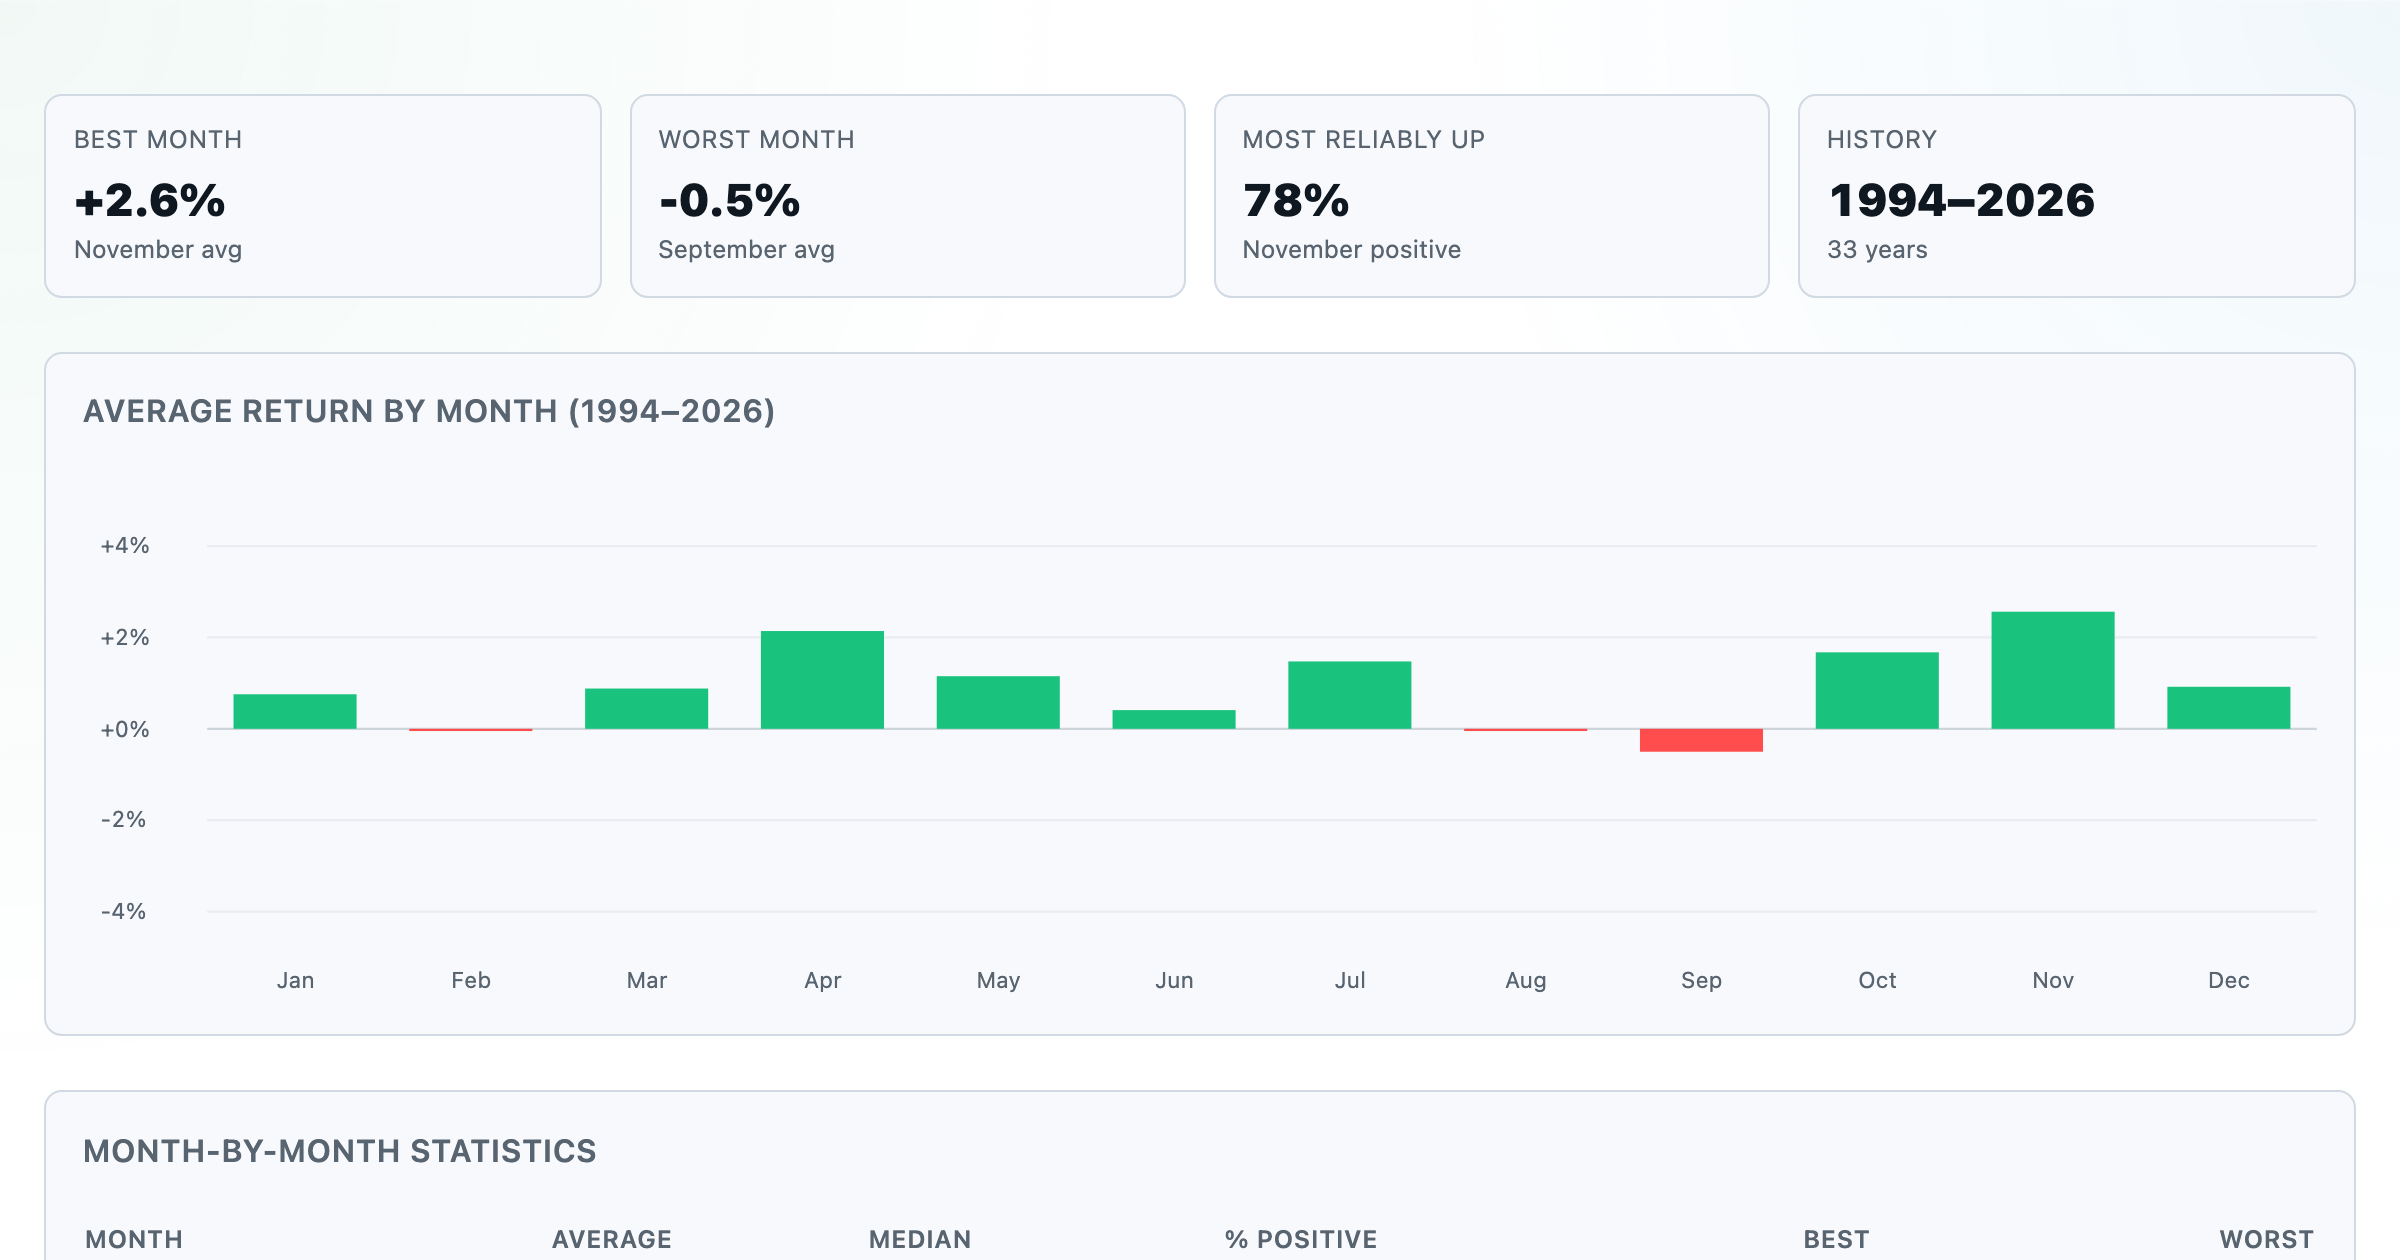
Which month is best for stocks? Average return of every calendar month, for any ticker.
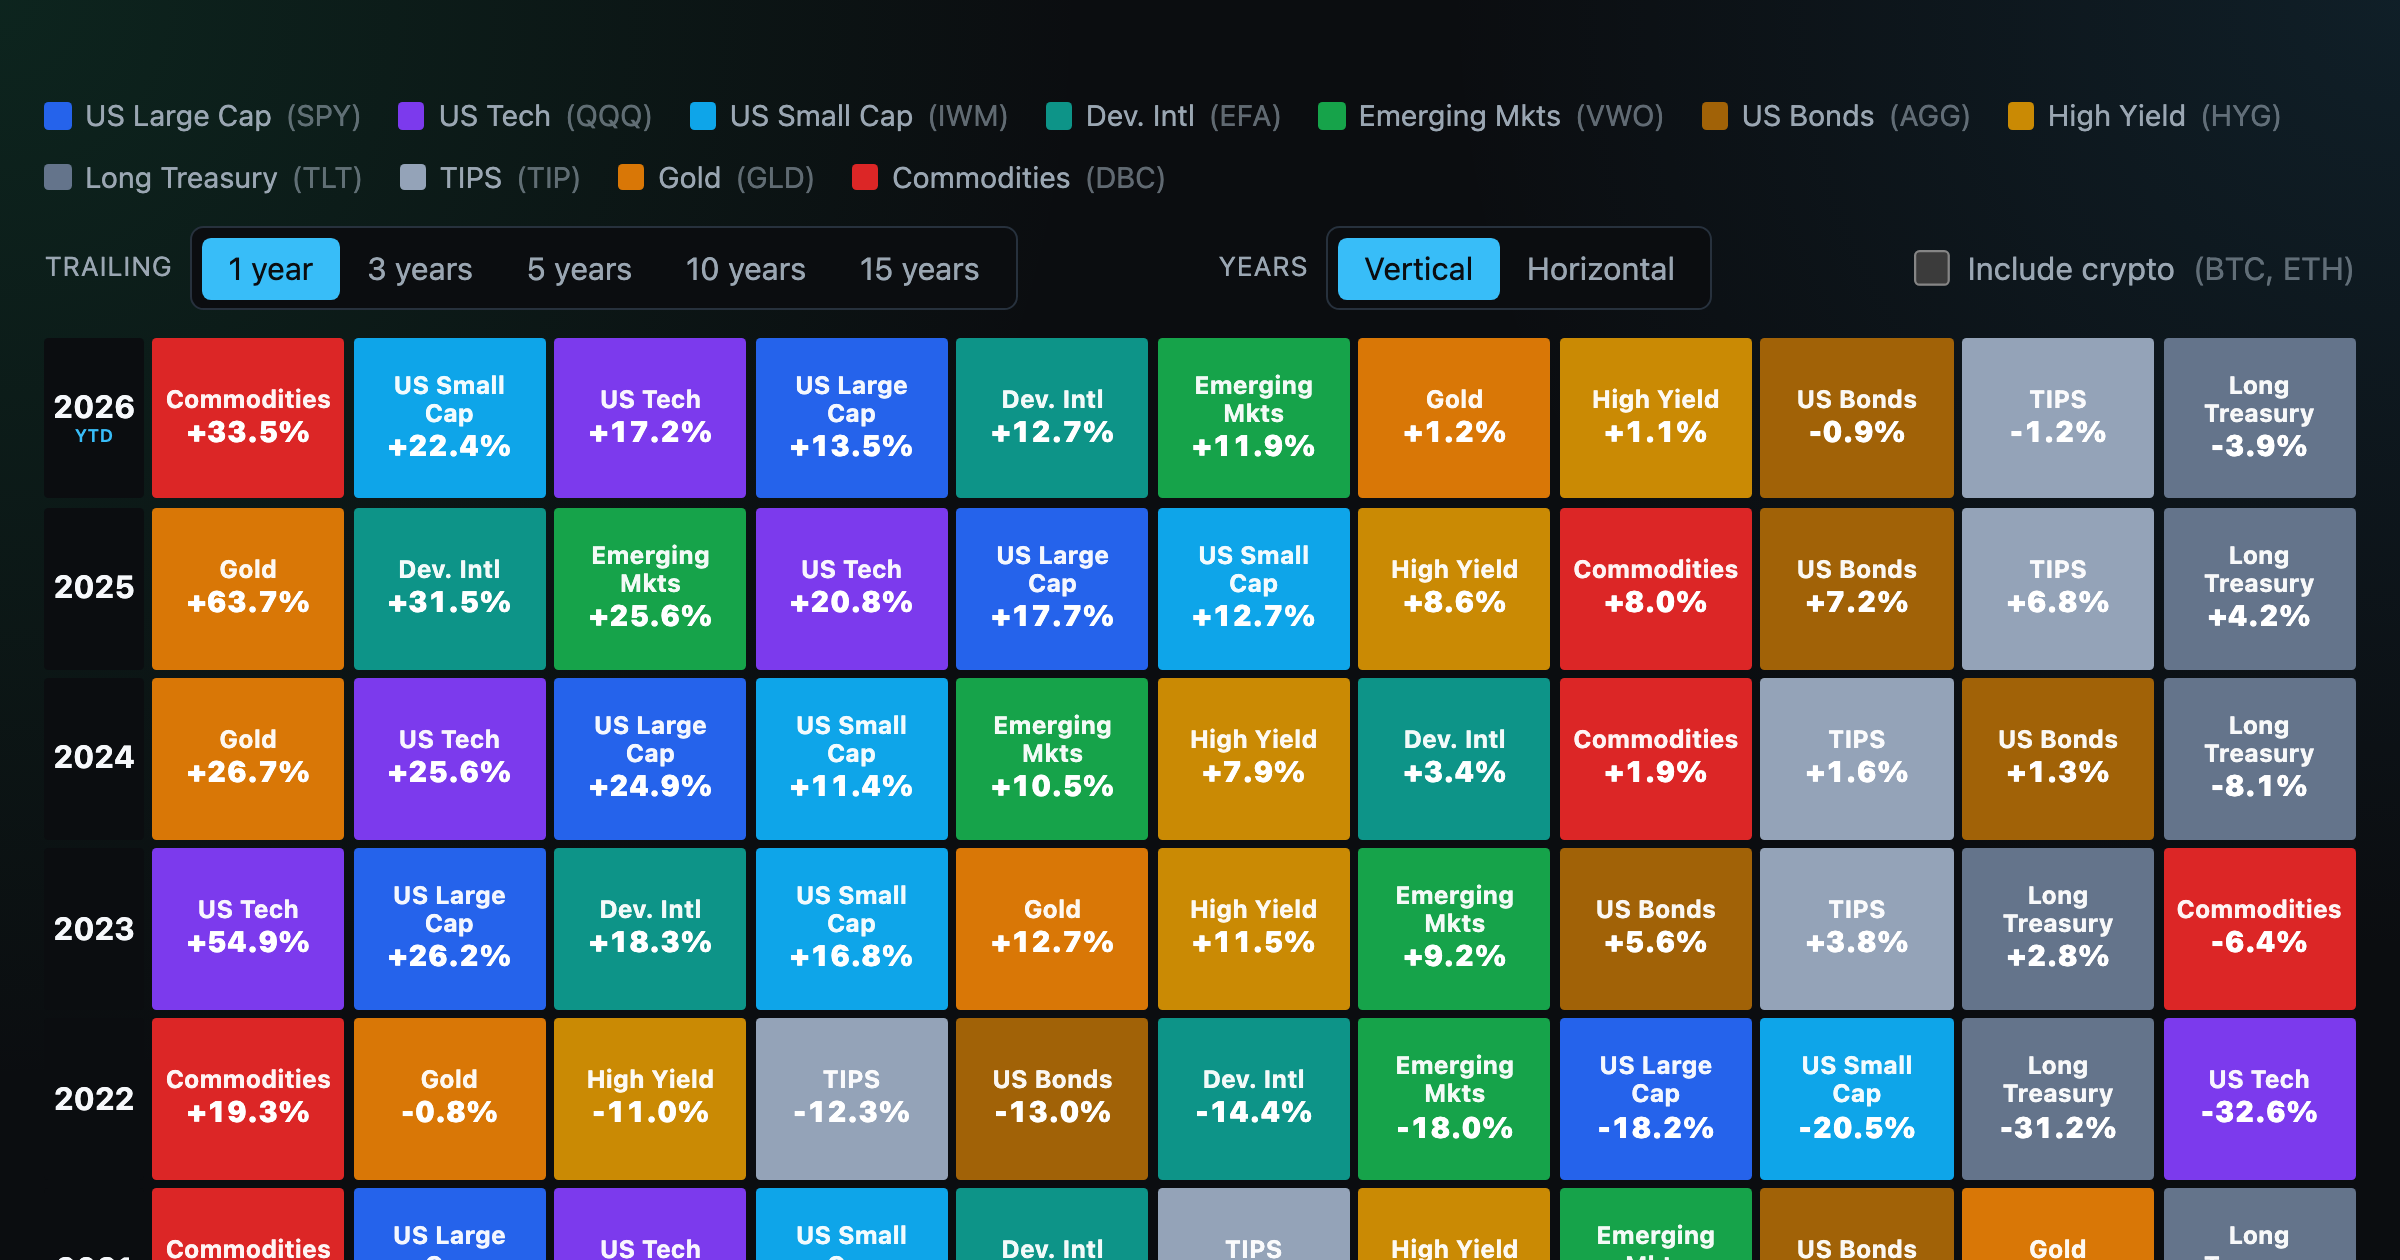
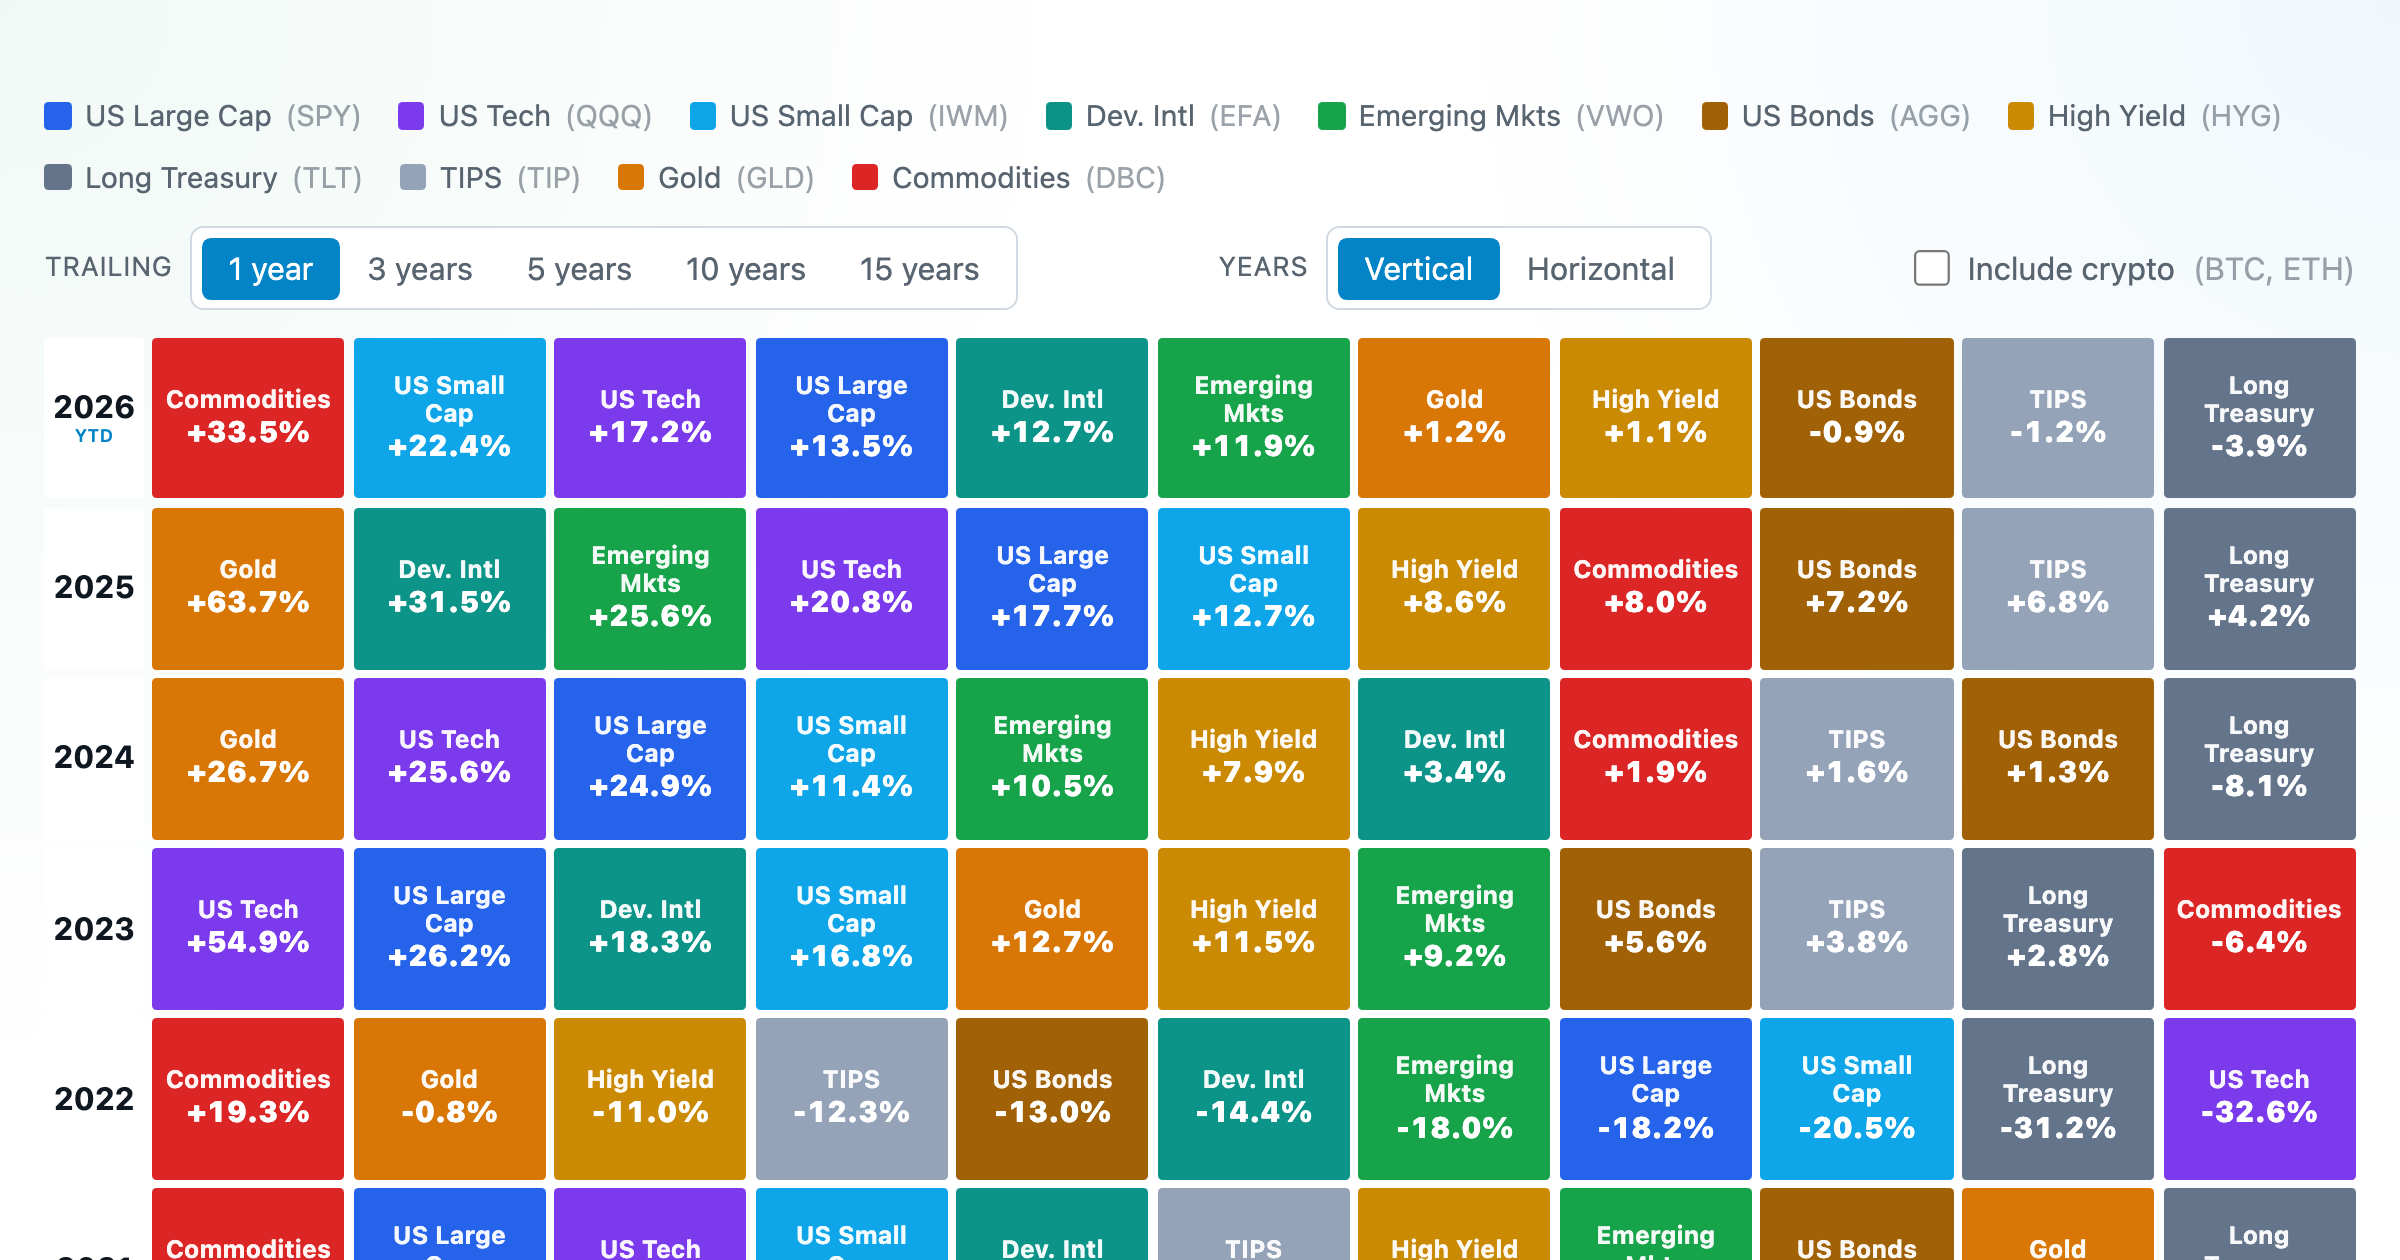
Asset-class returns ranked year by year — the Callan chart / asset allocation quilt.
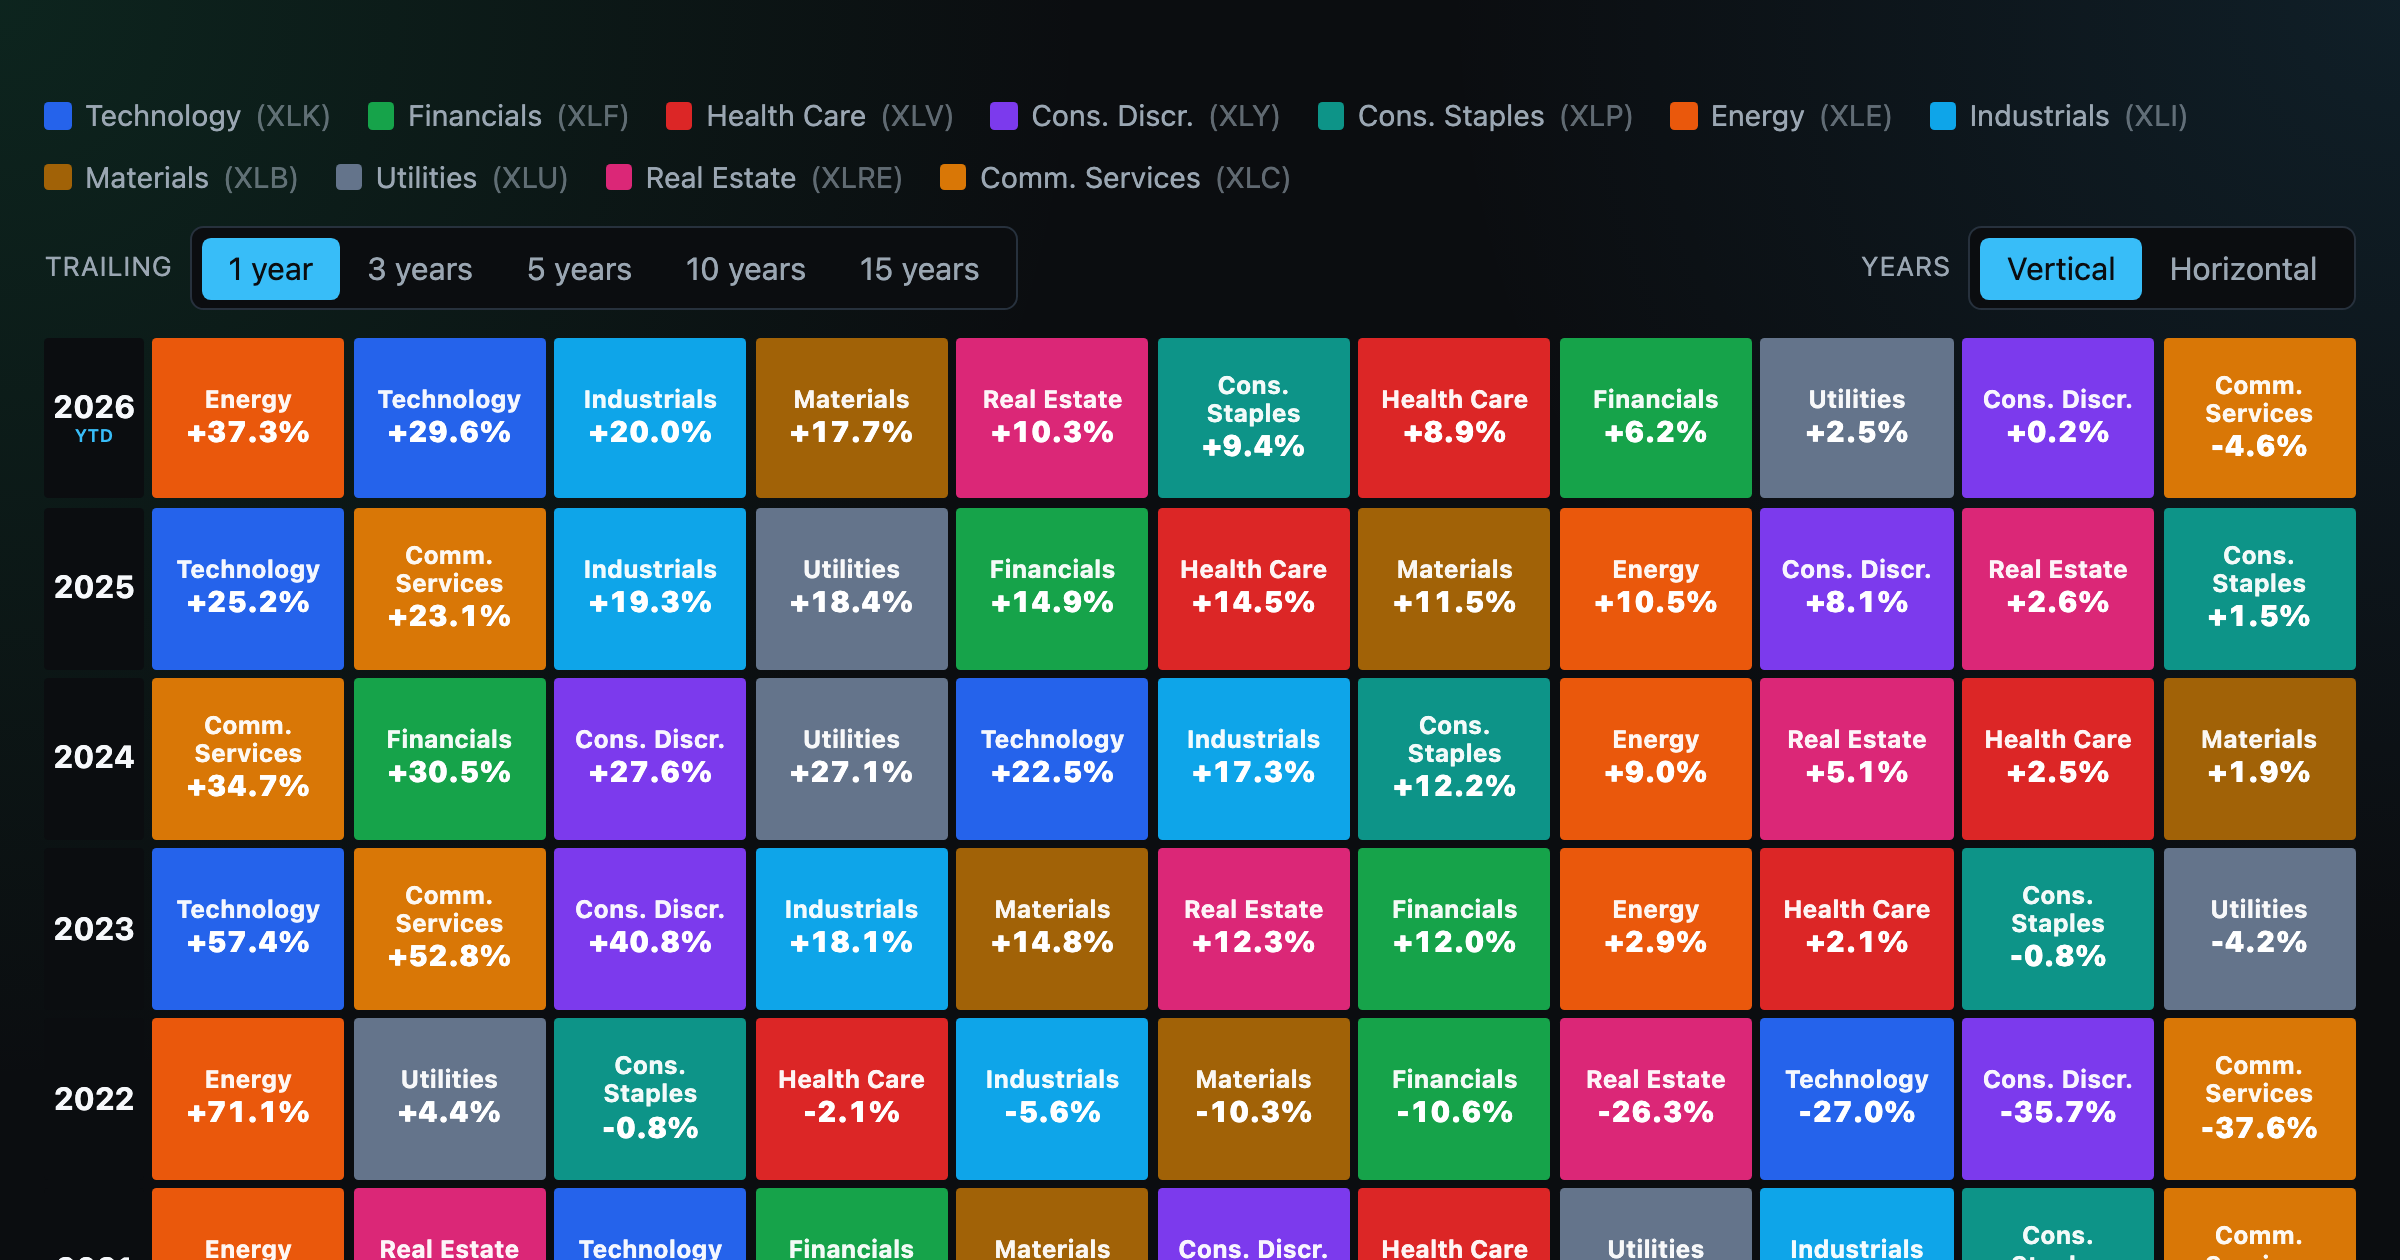
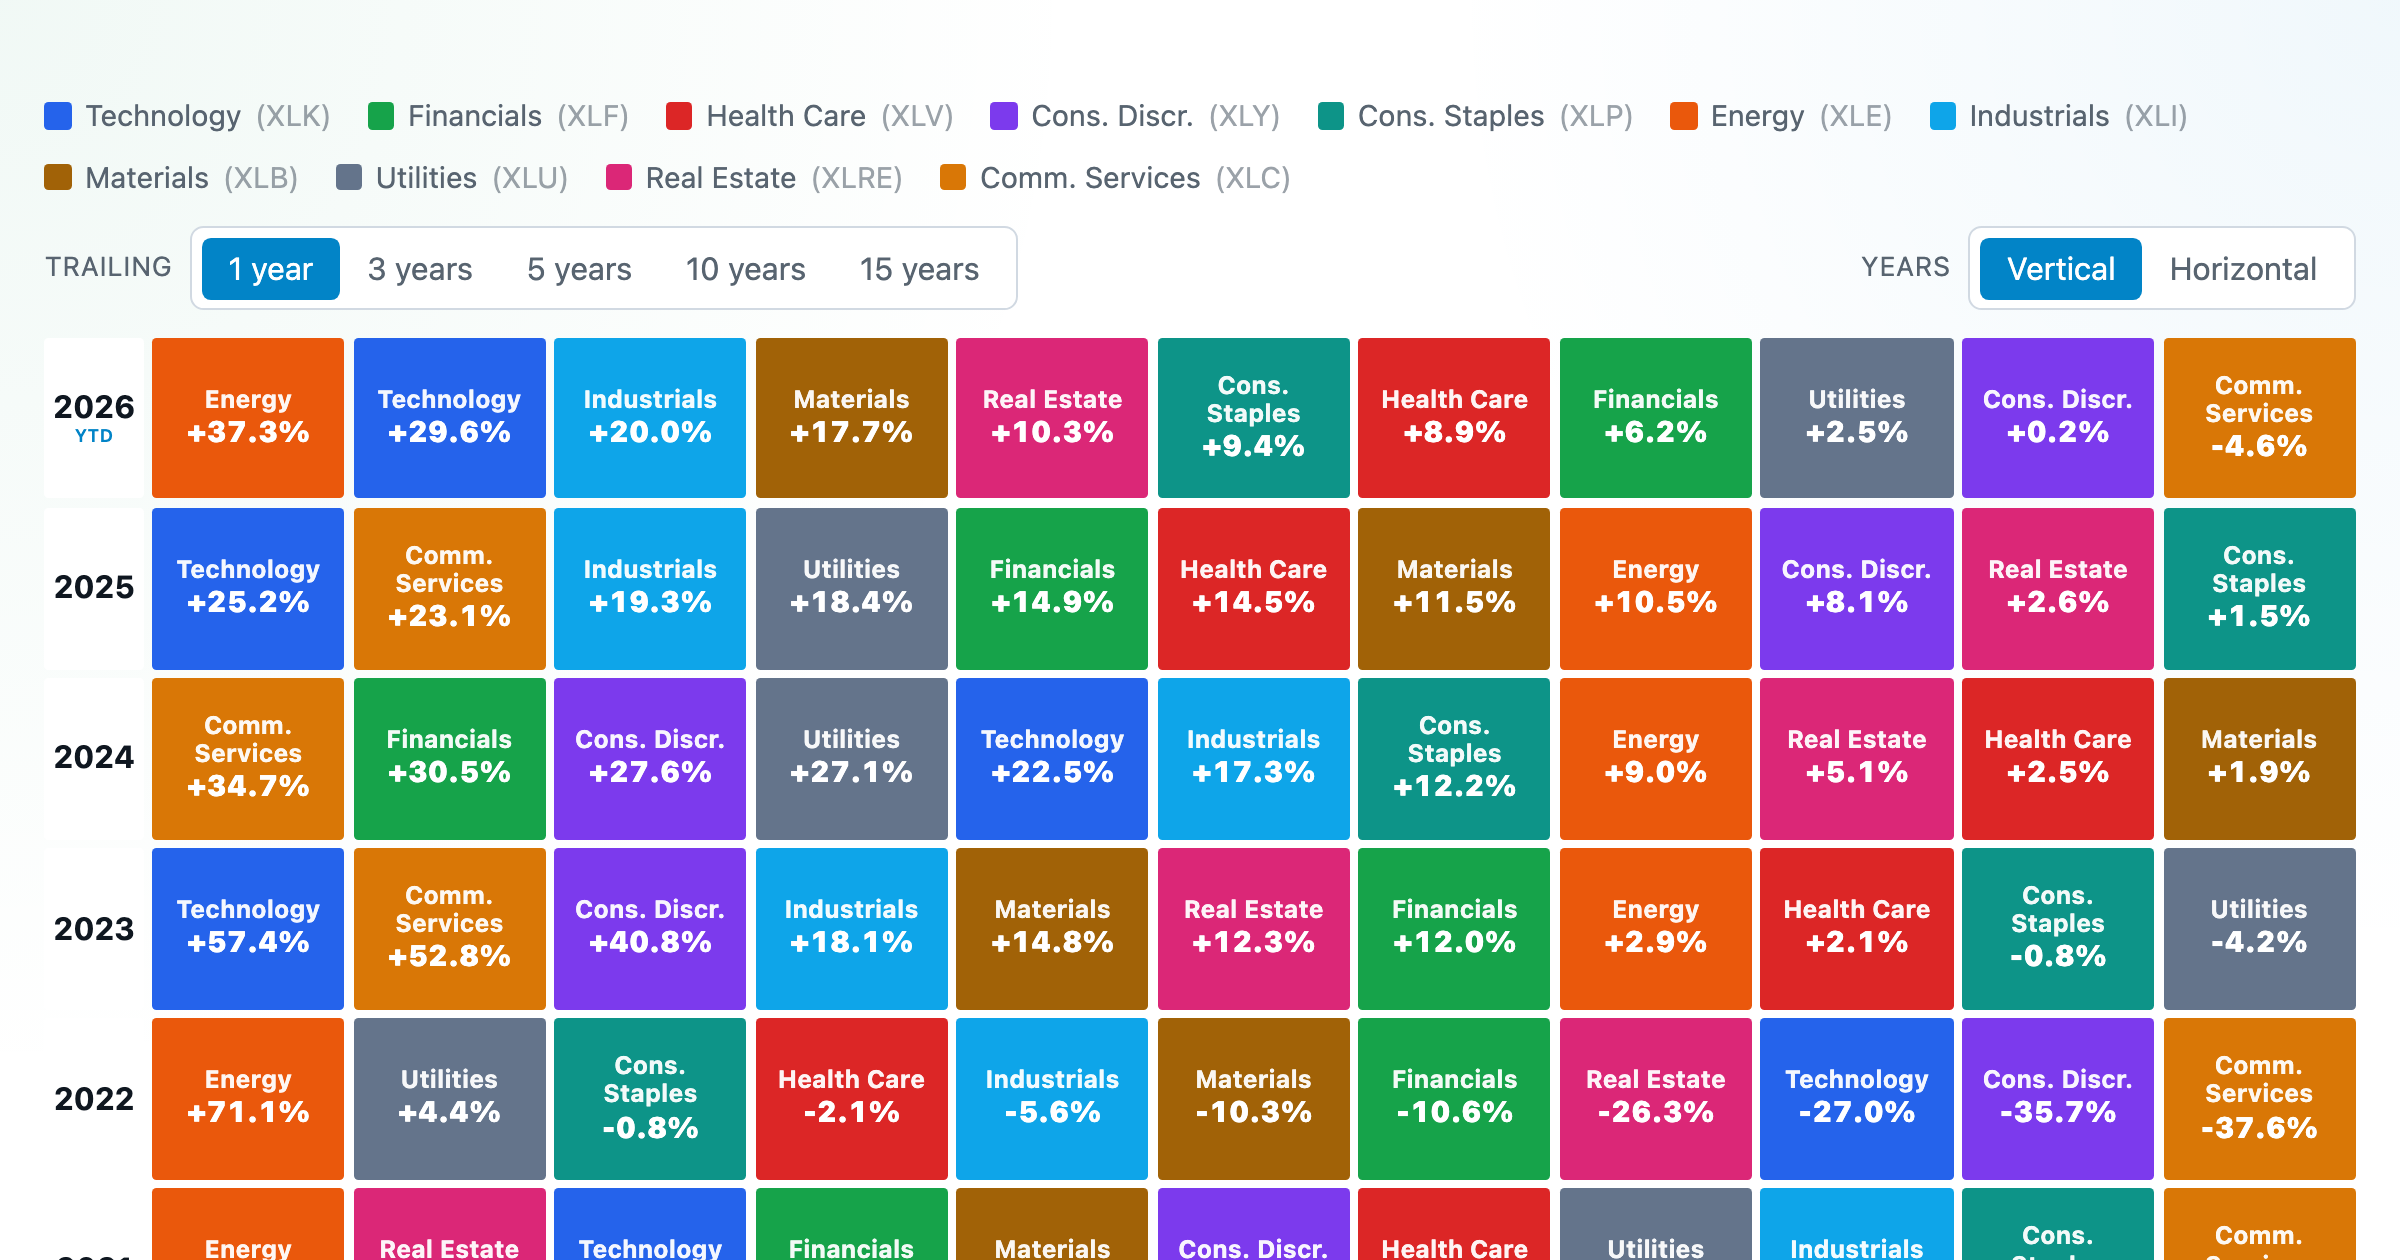
The 11 S&P 500 sectors ranked year by year — a sector quilt chart, back to 1999.
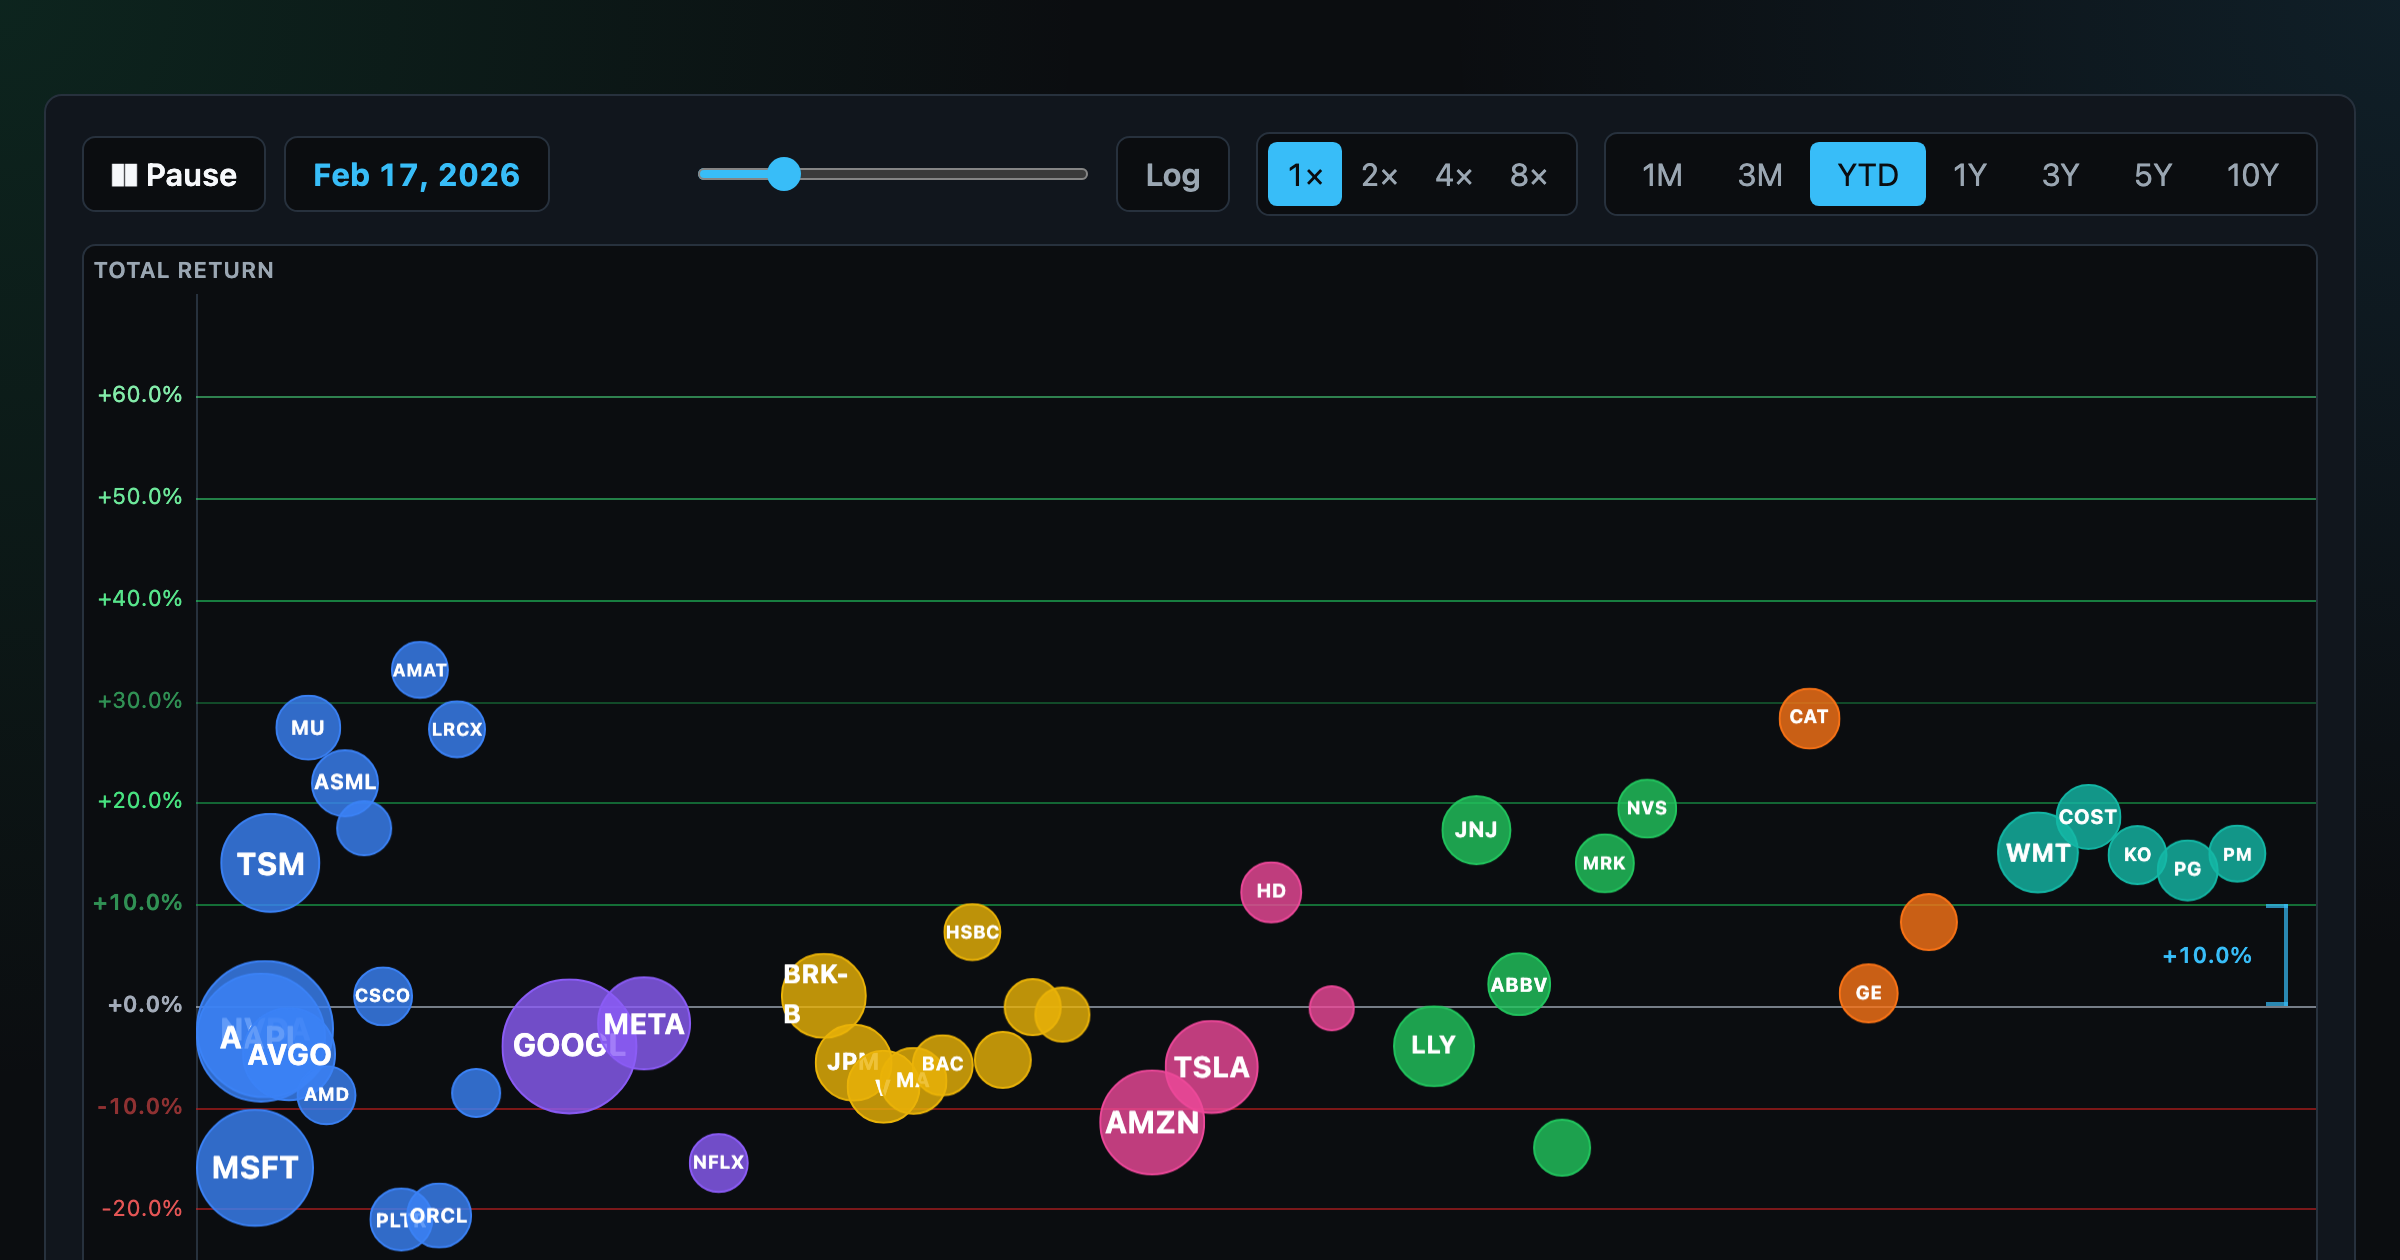
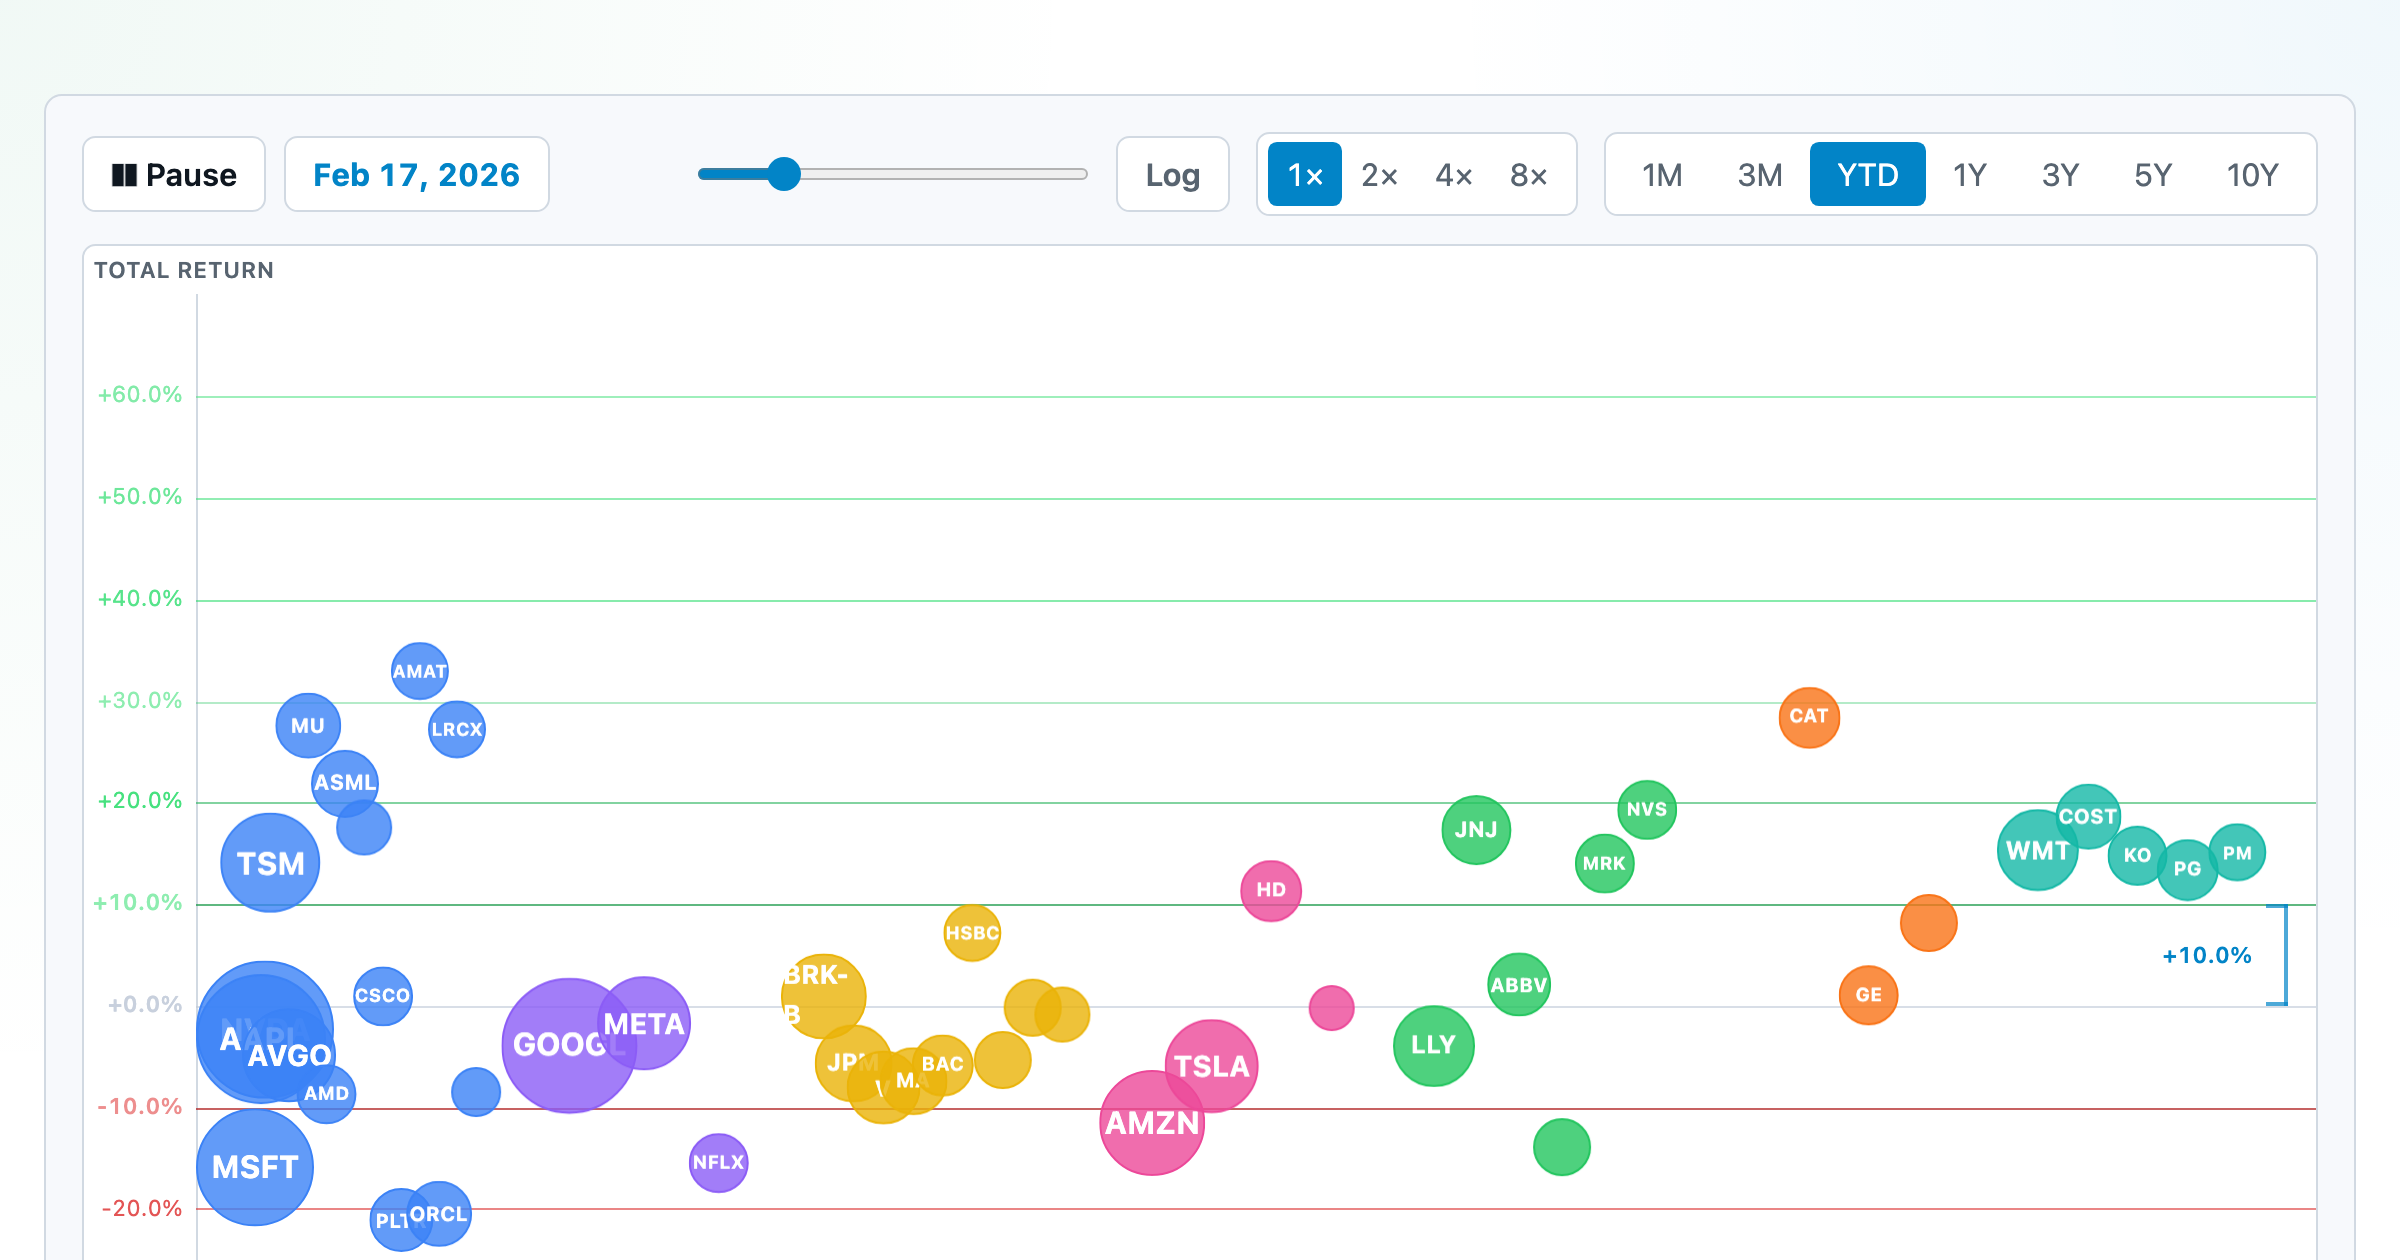
The biggest US companies as animated bubbles, rising and falling with their total return over time.
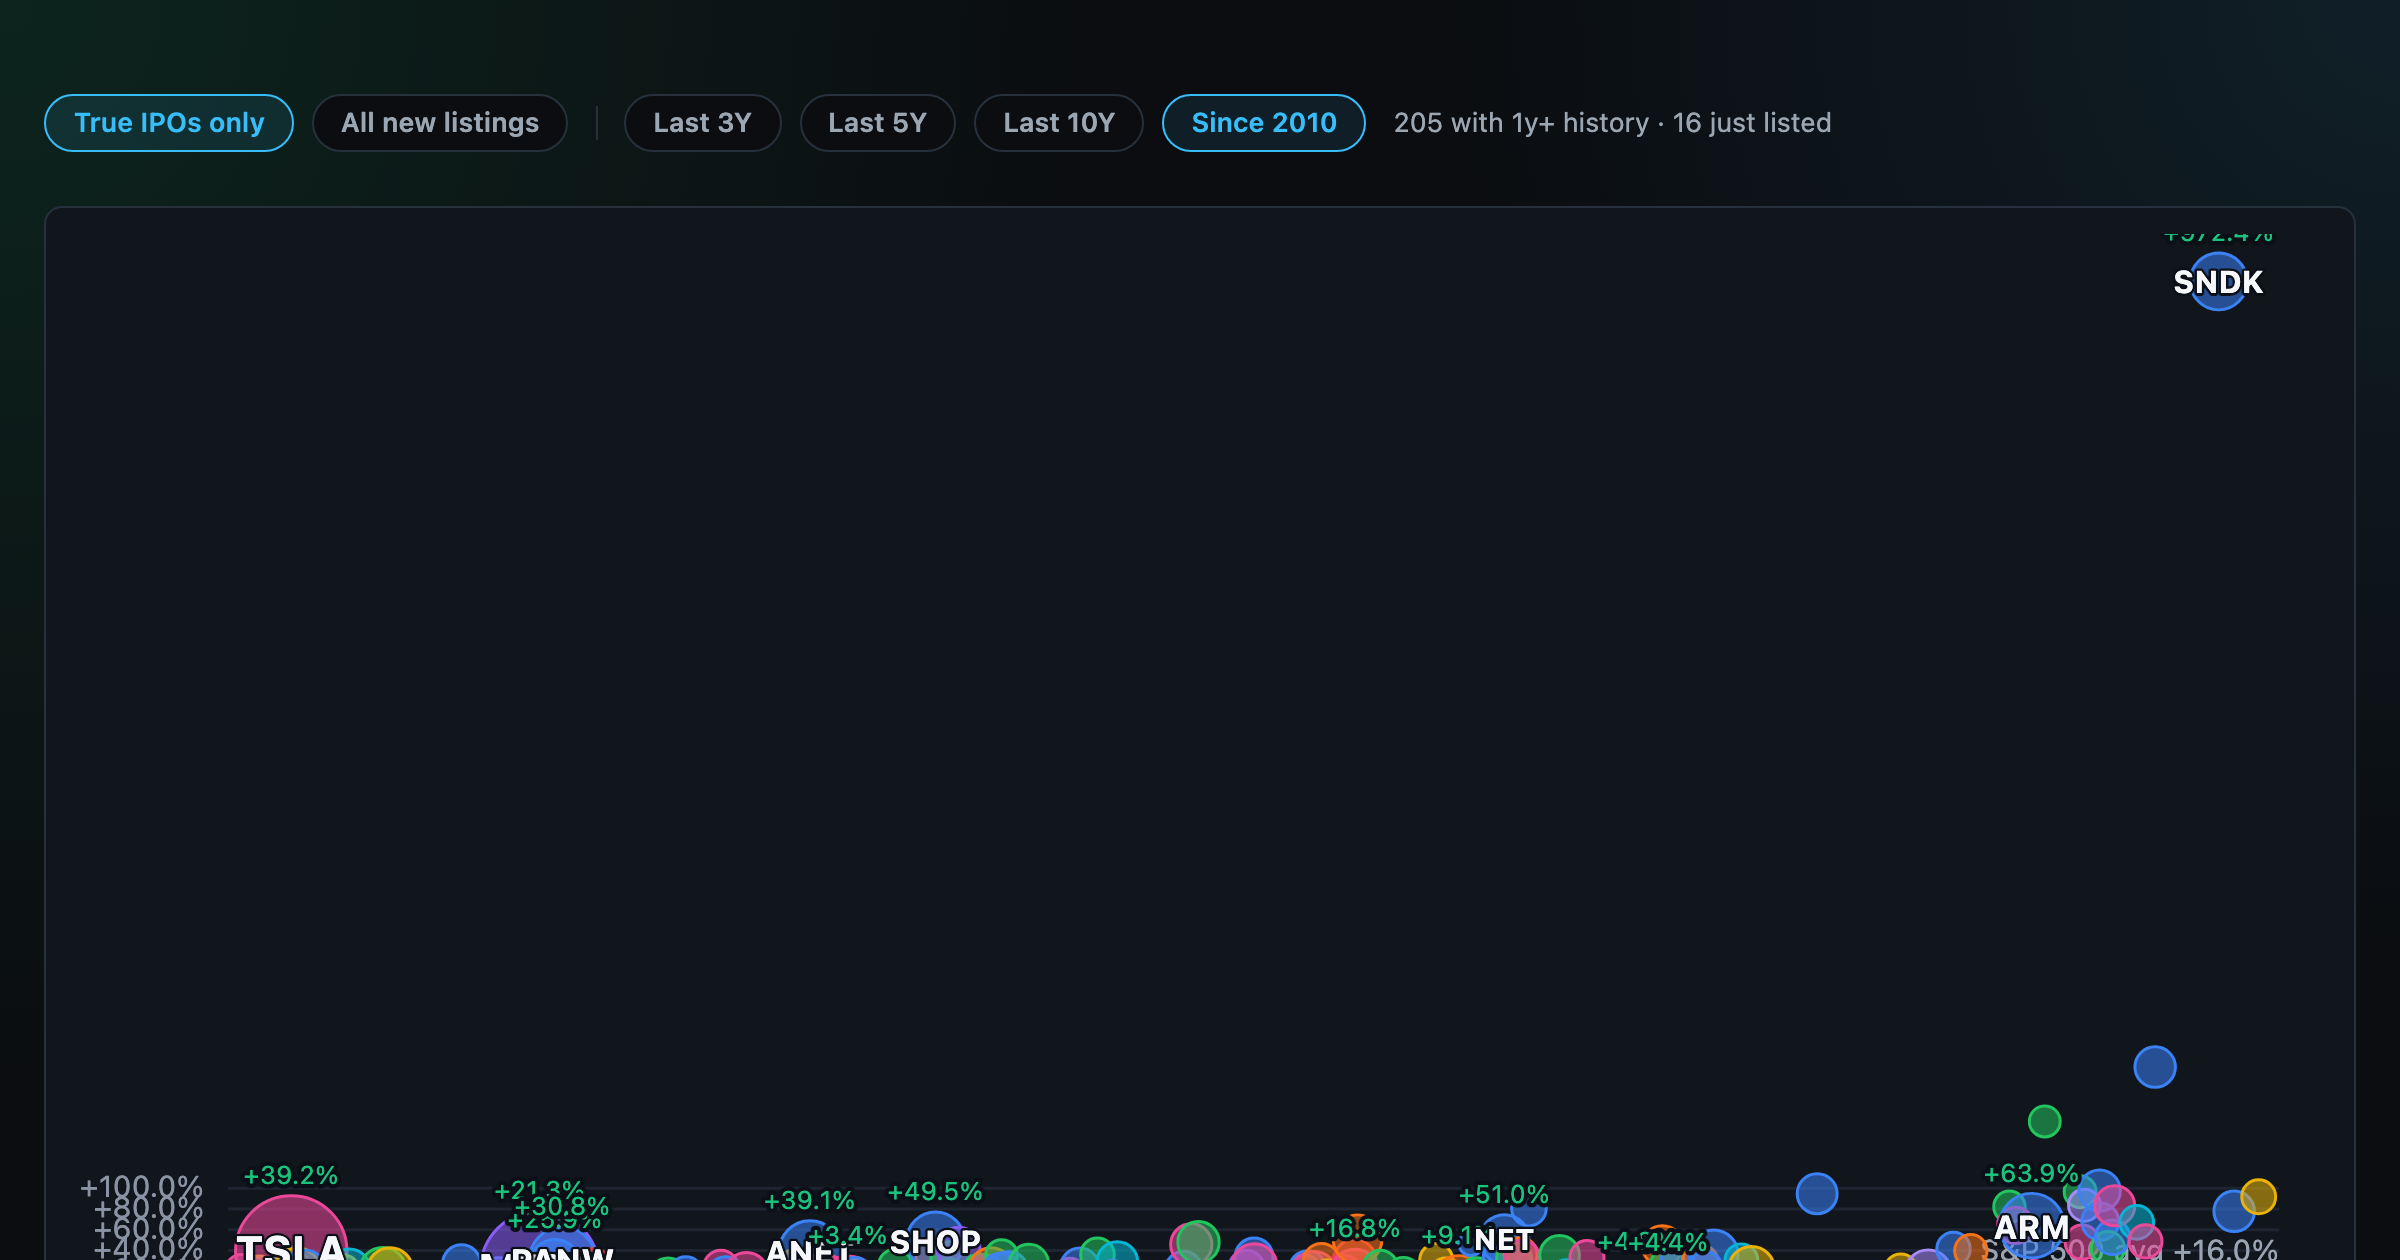
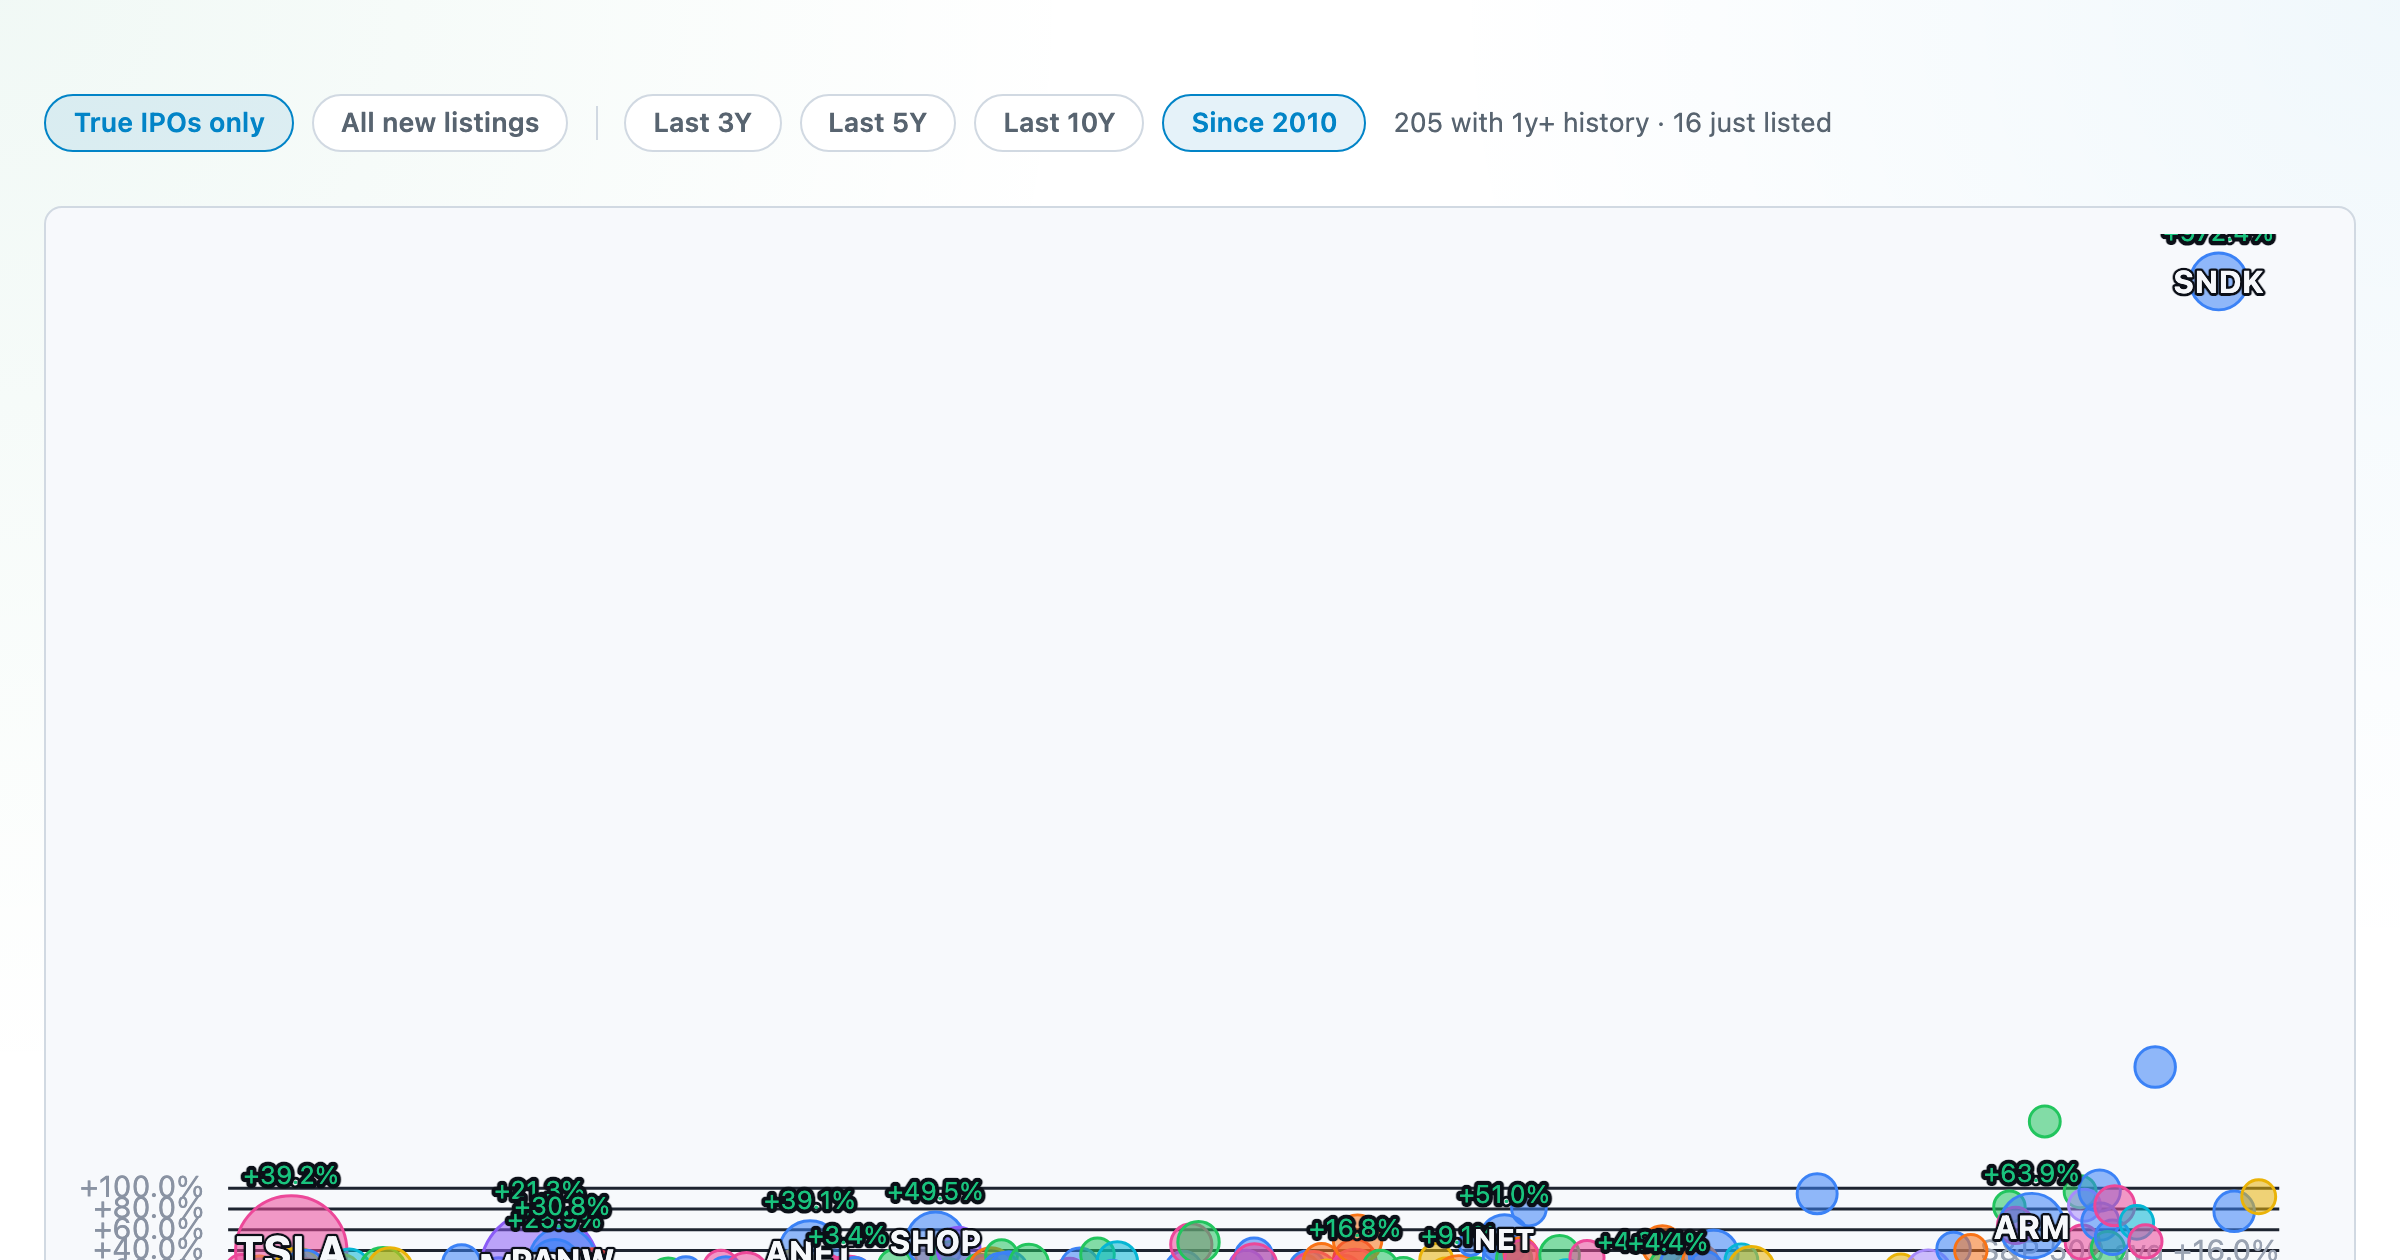
How recent stock-market debuts have performed since listing — annualized, vs the S&P 500, by IPO vs spin-off.
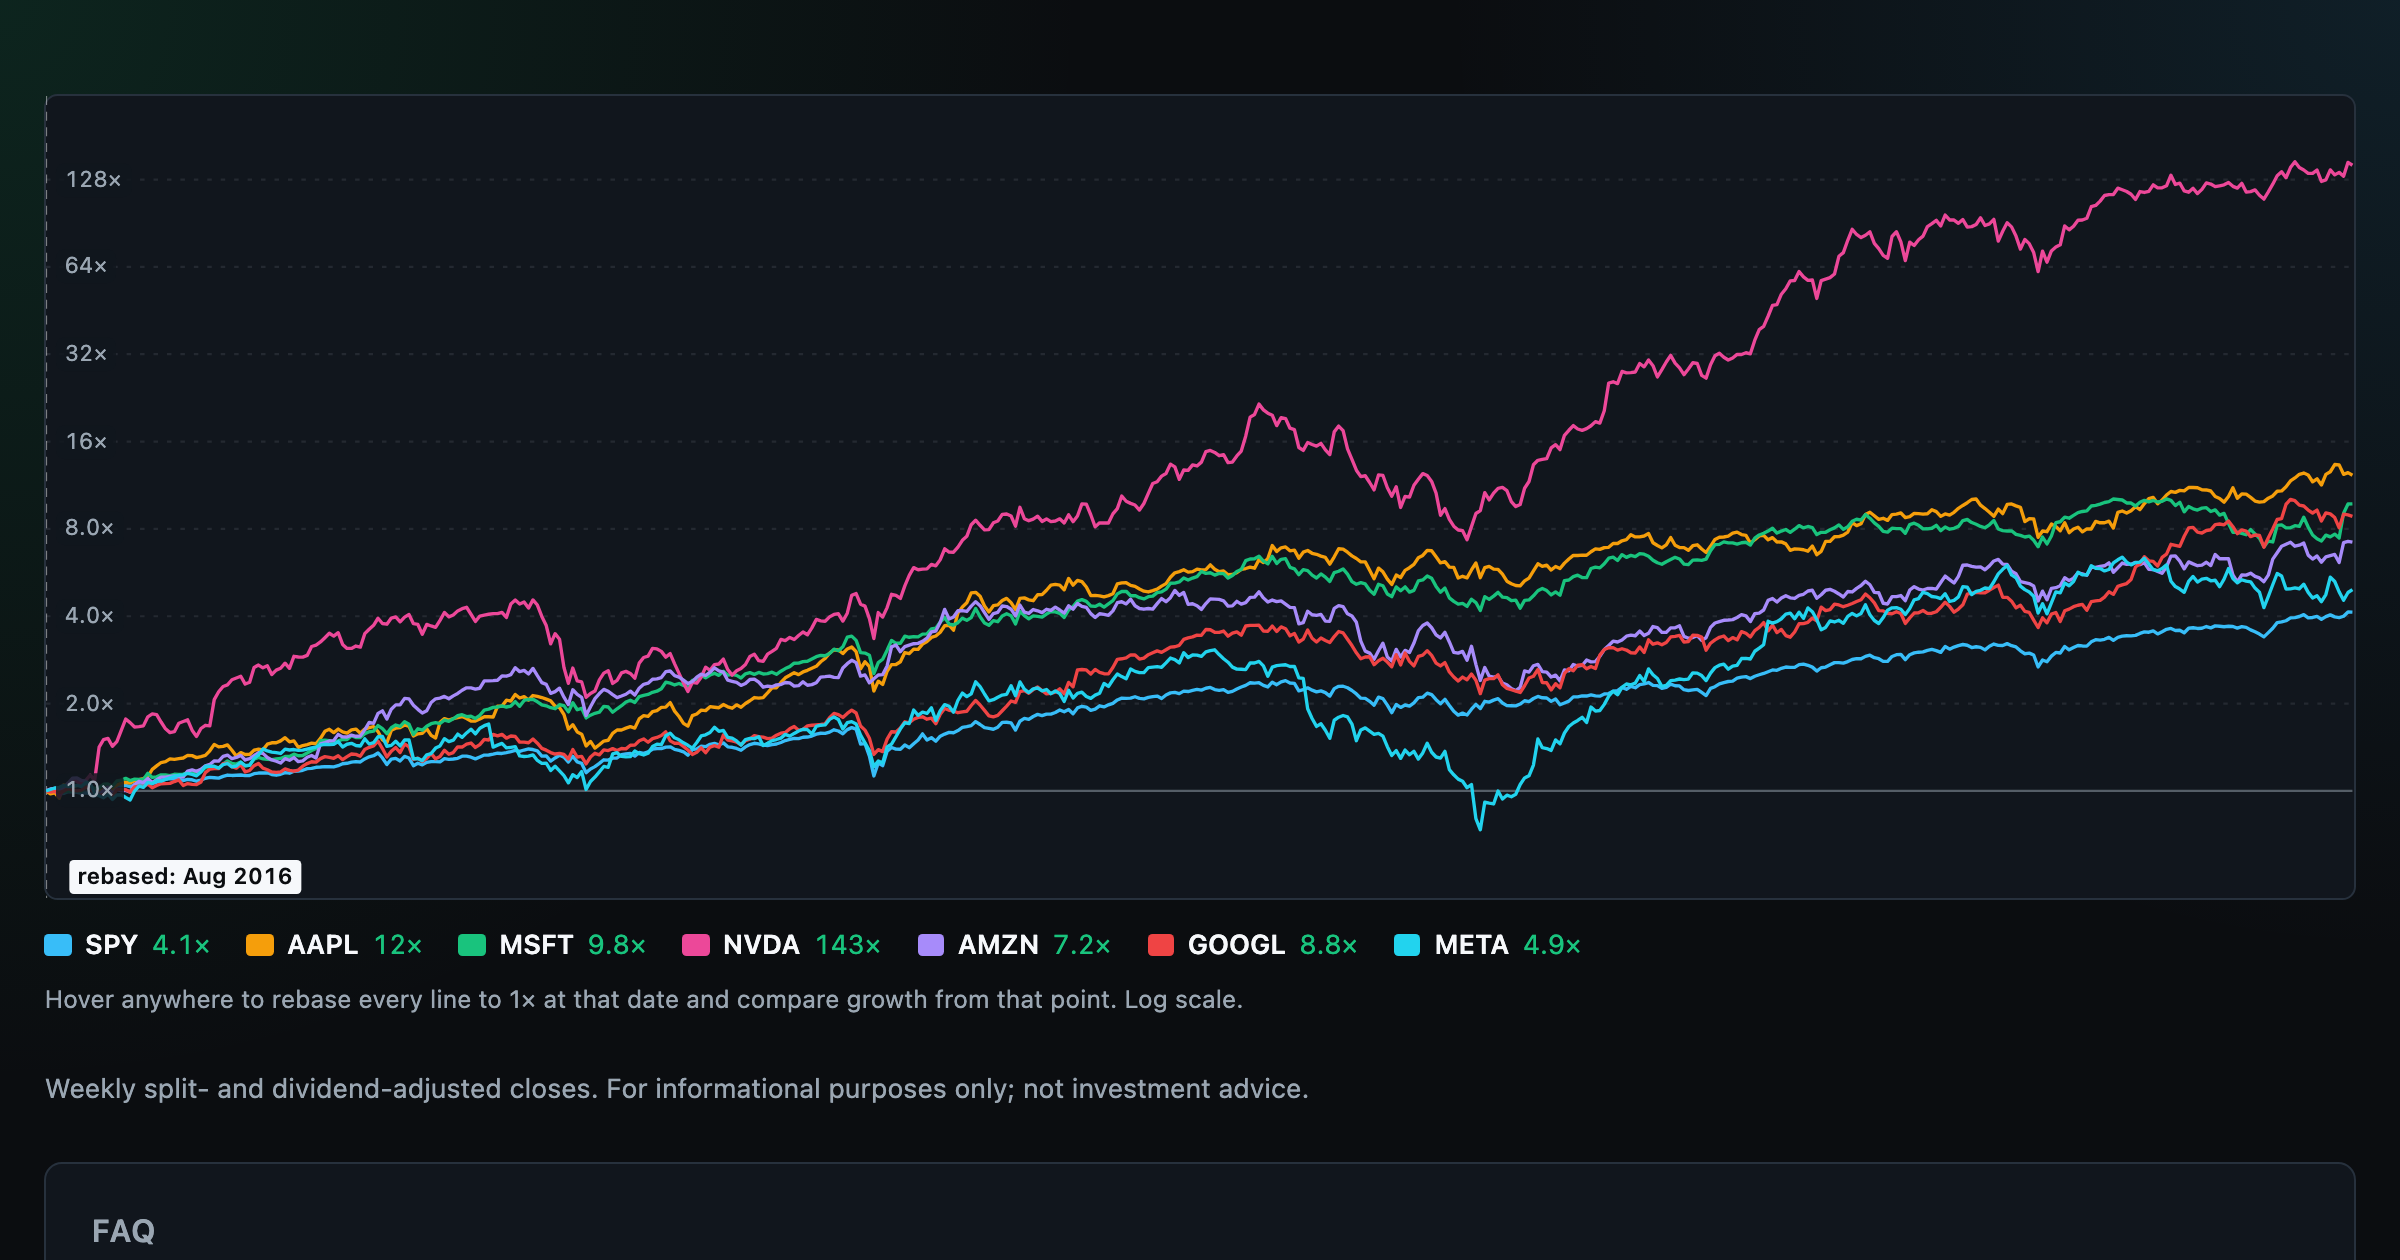
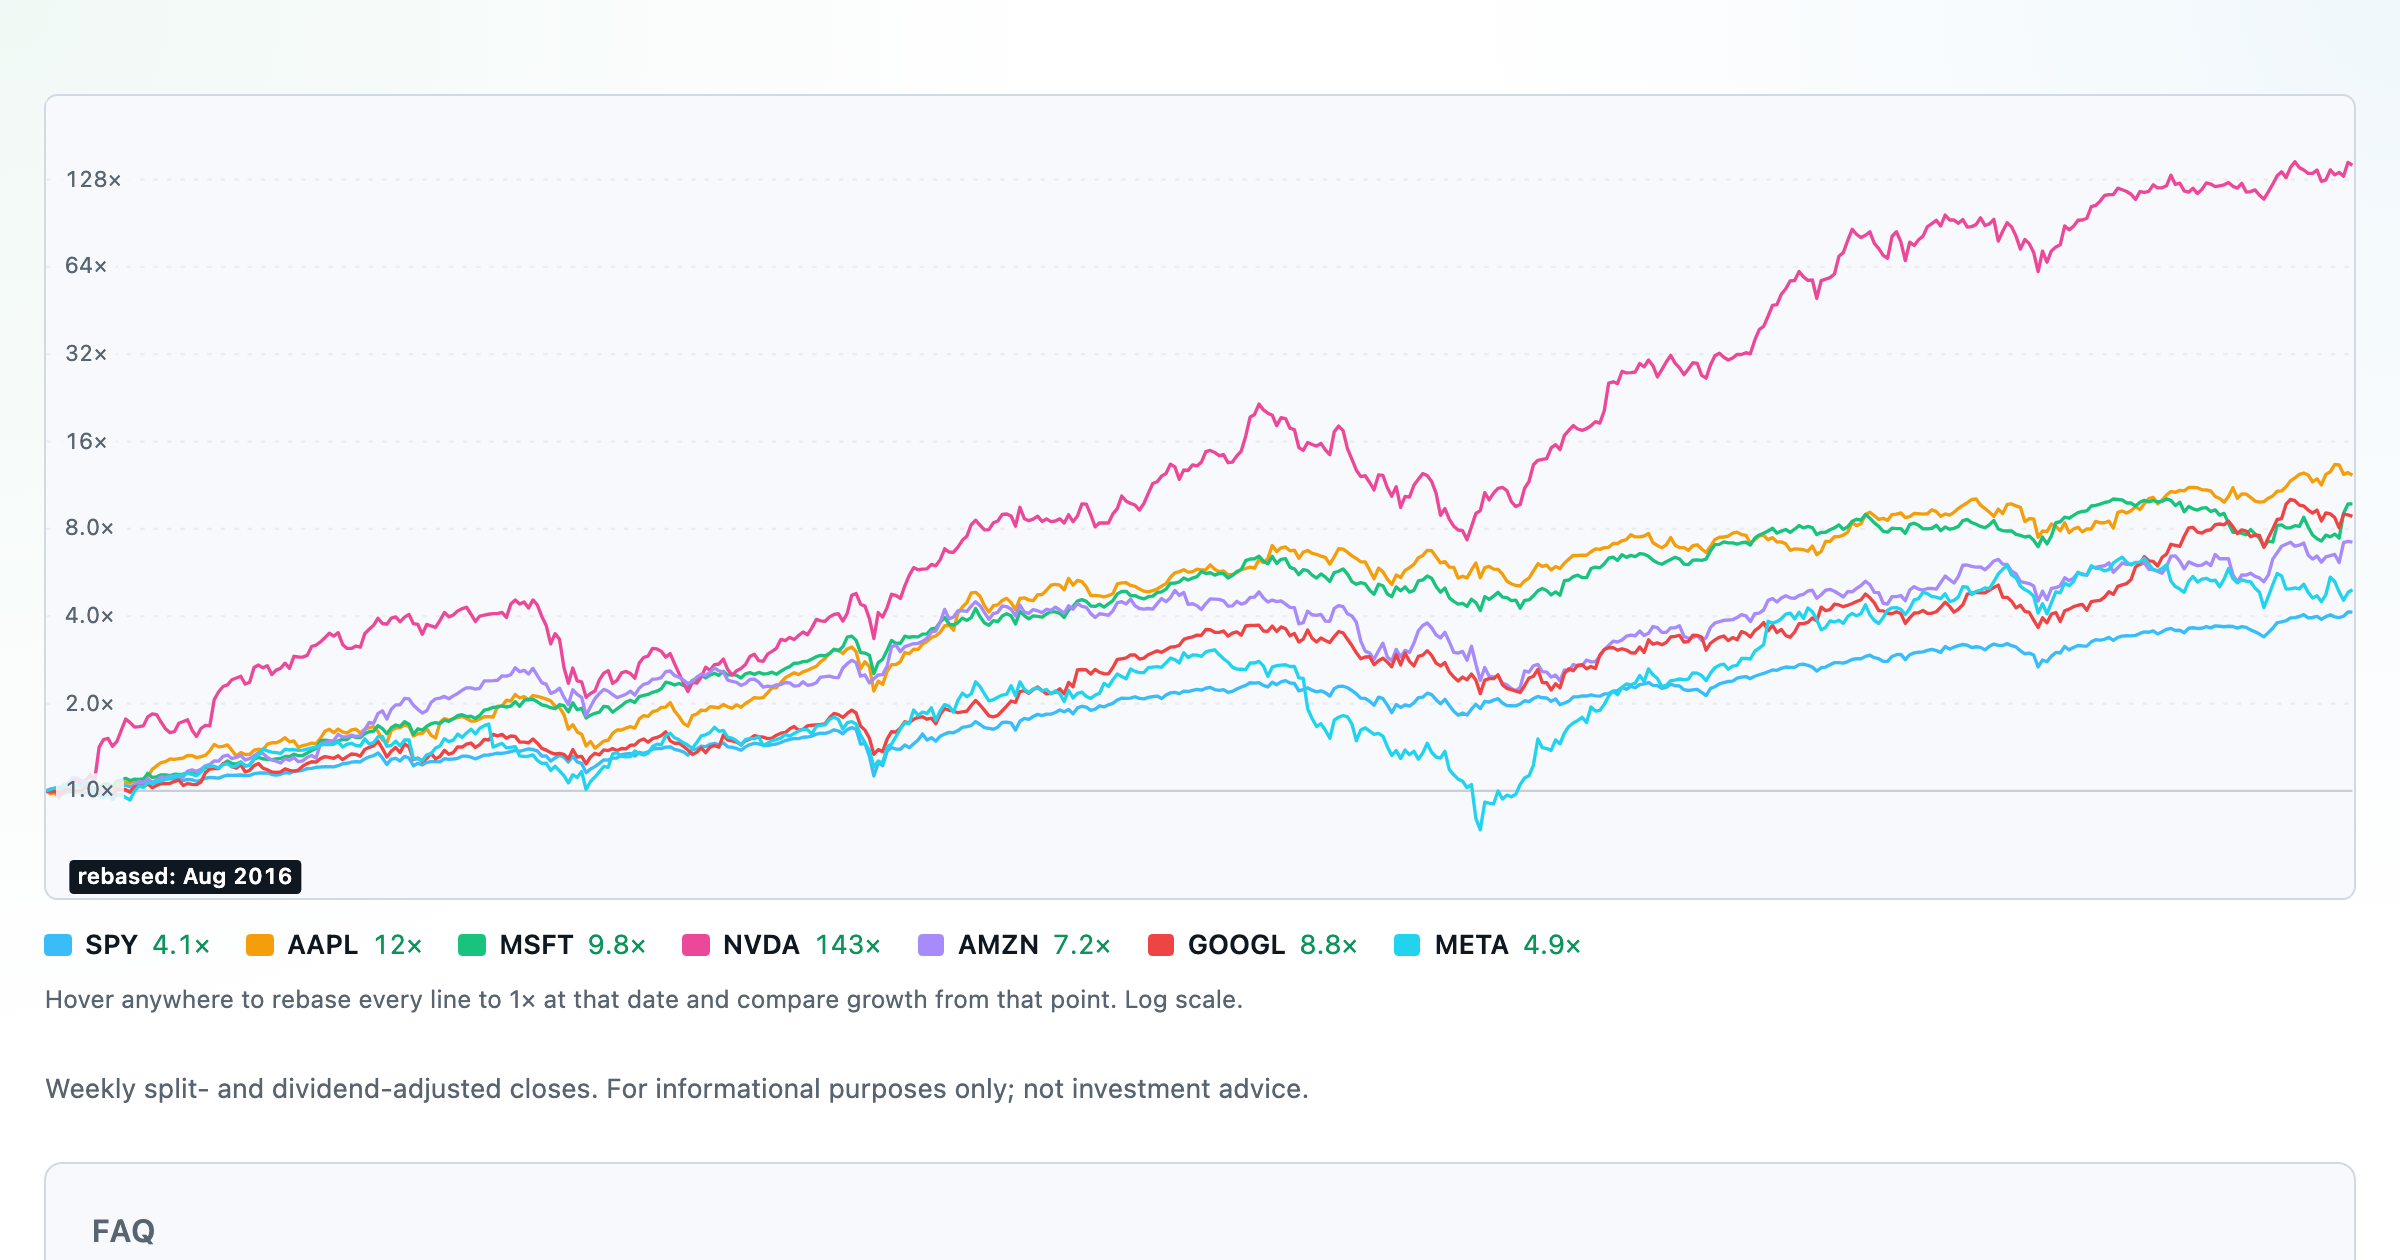
Compare megacaps vs the S&P 500, rebased to 1× at any date you hover.
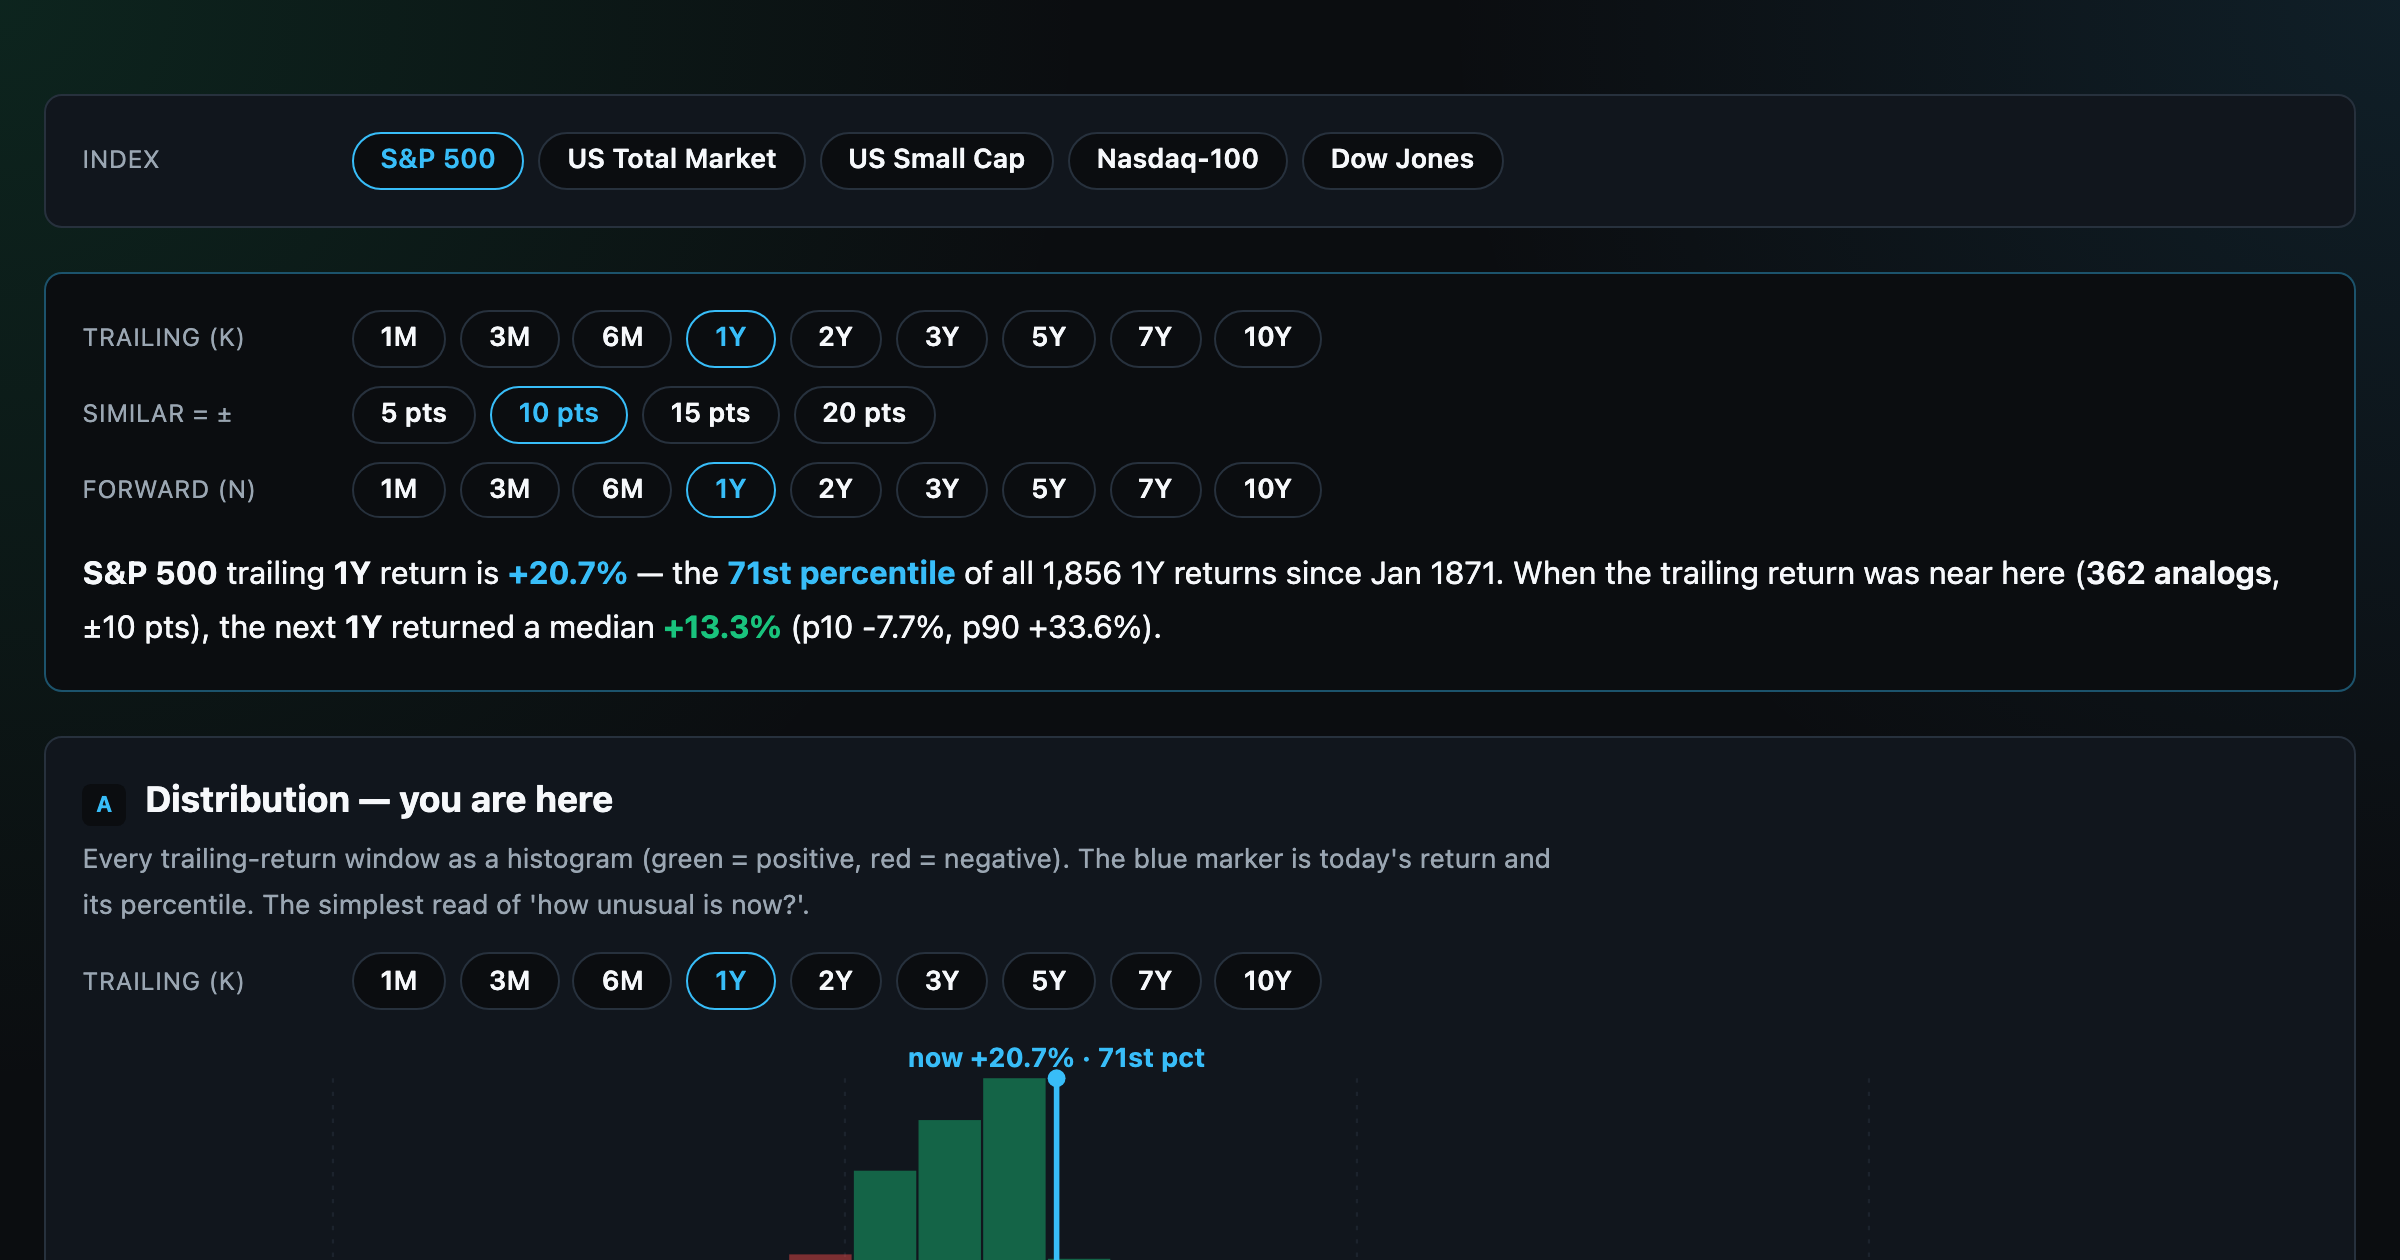
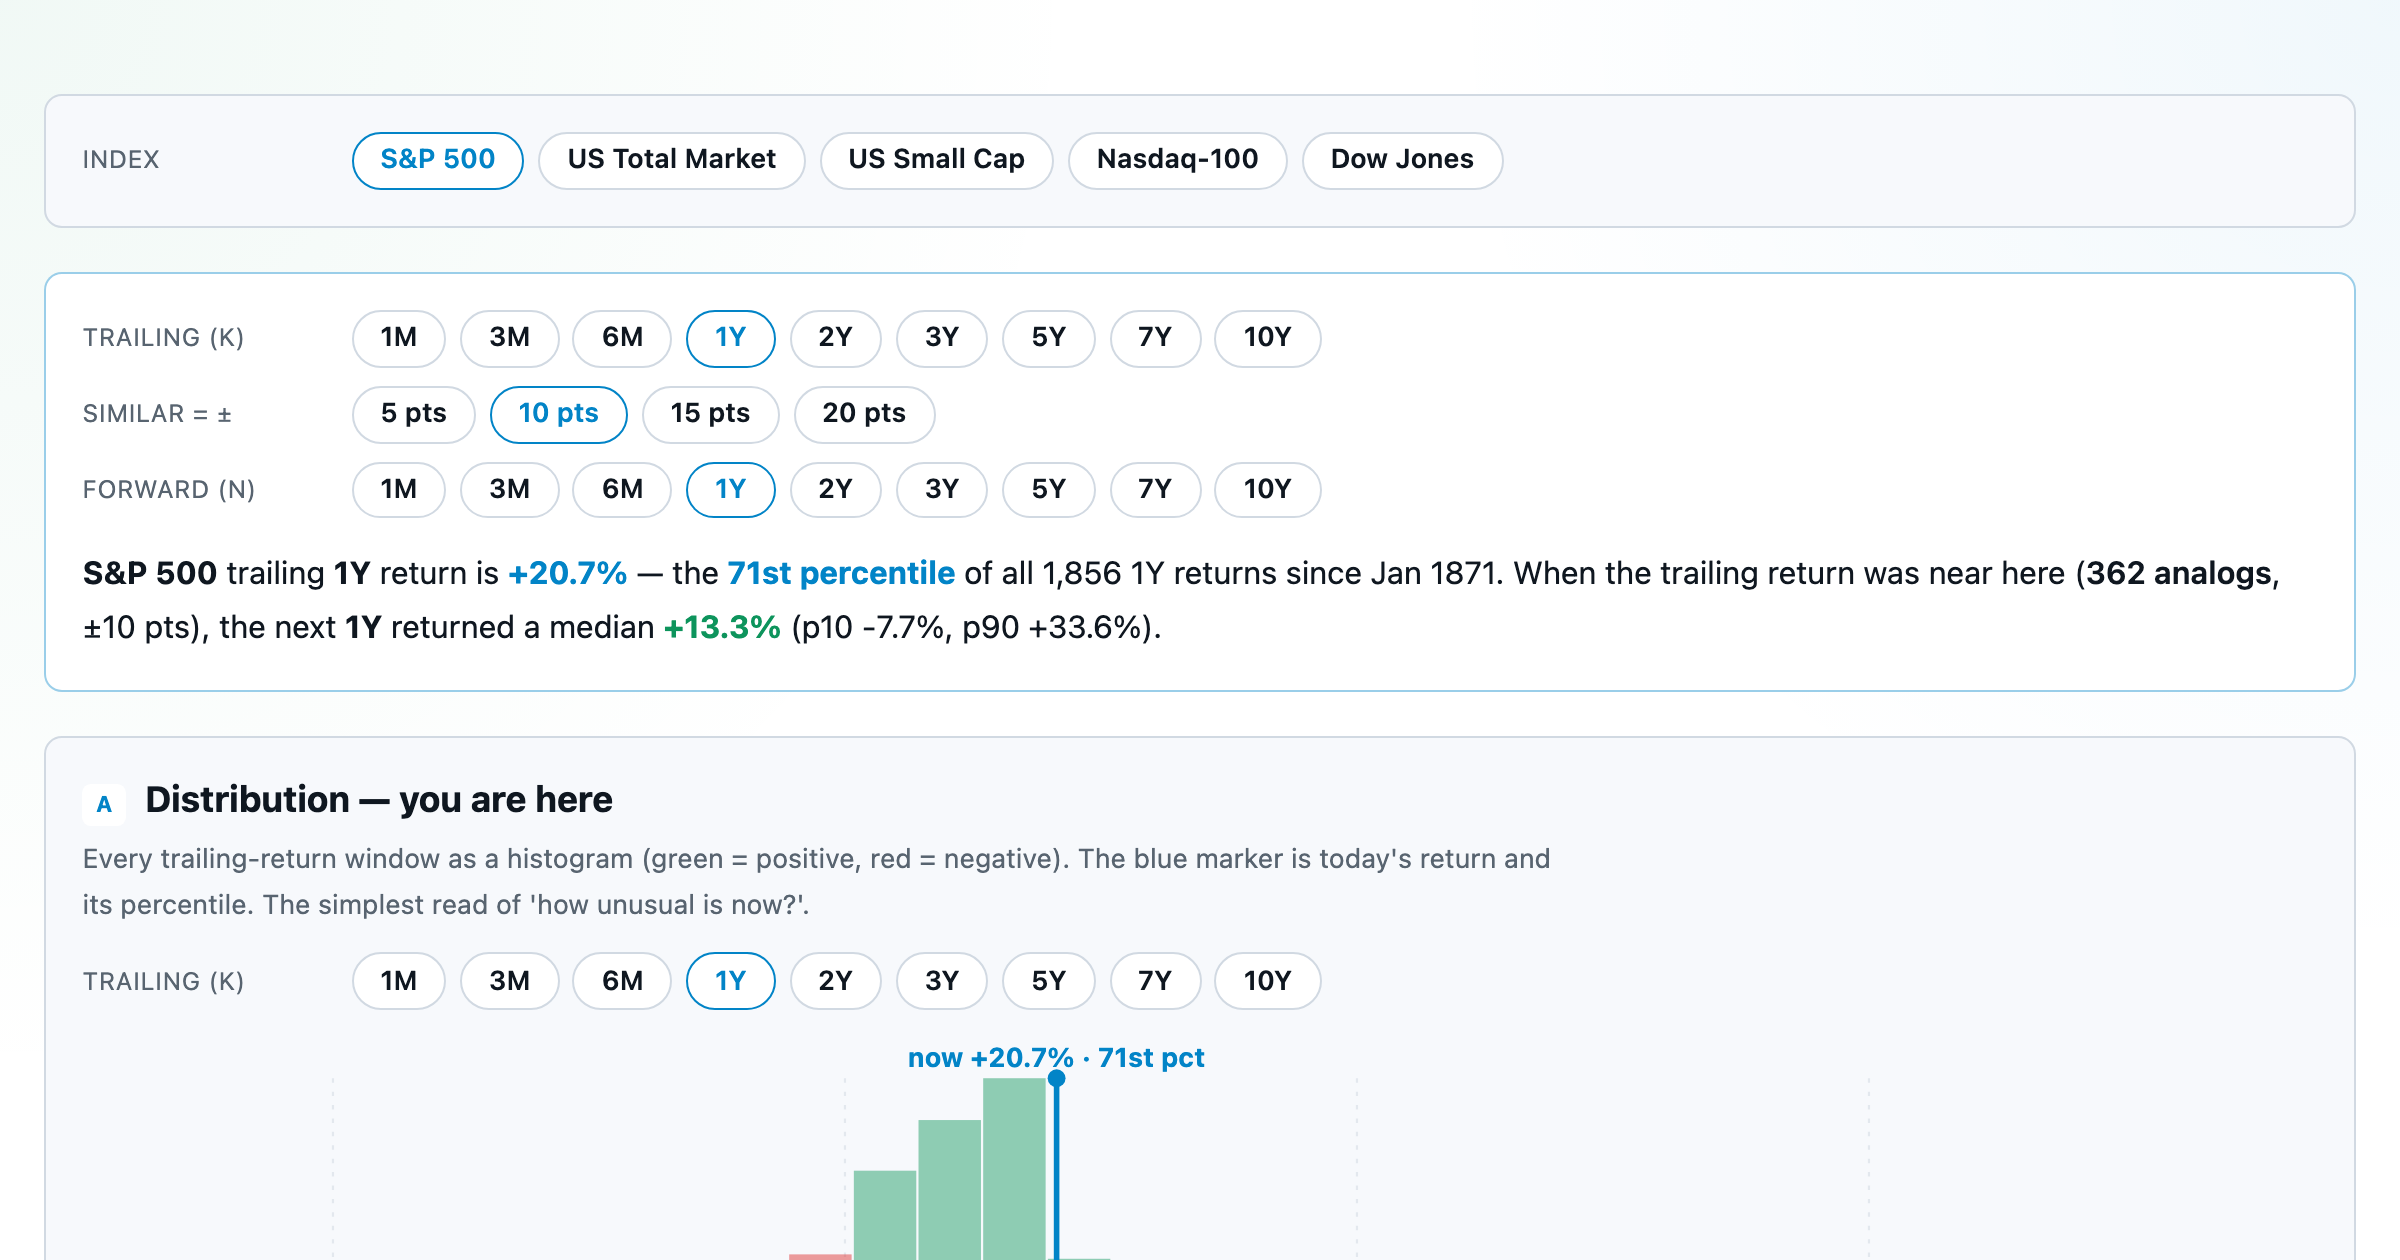
Where today's S&P 500 return ranks against all history — and the forward returns that followed similar moments.
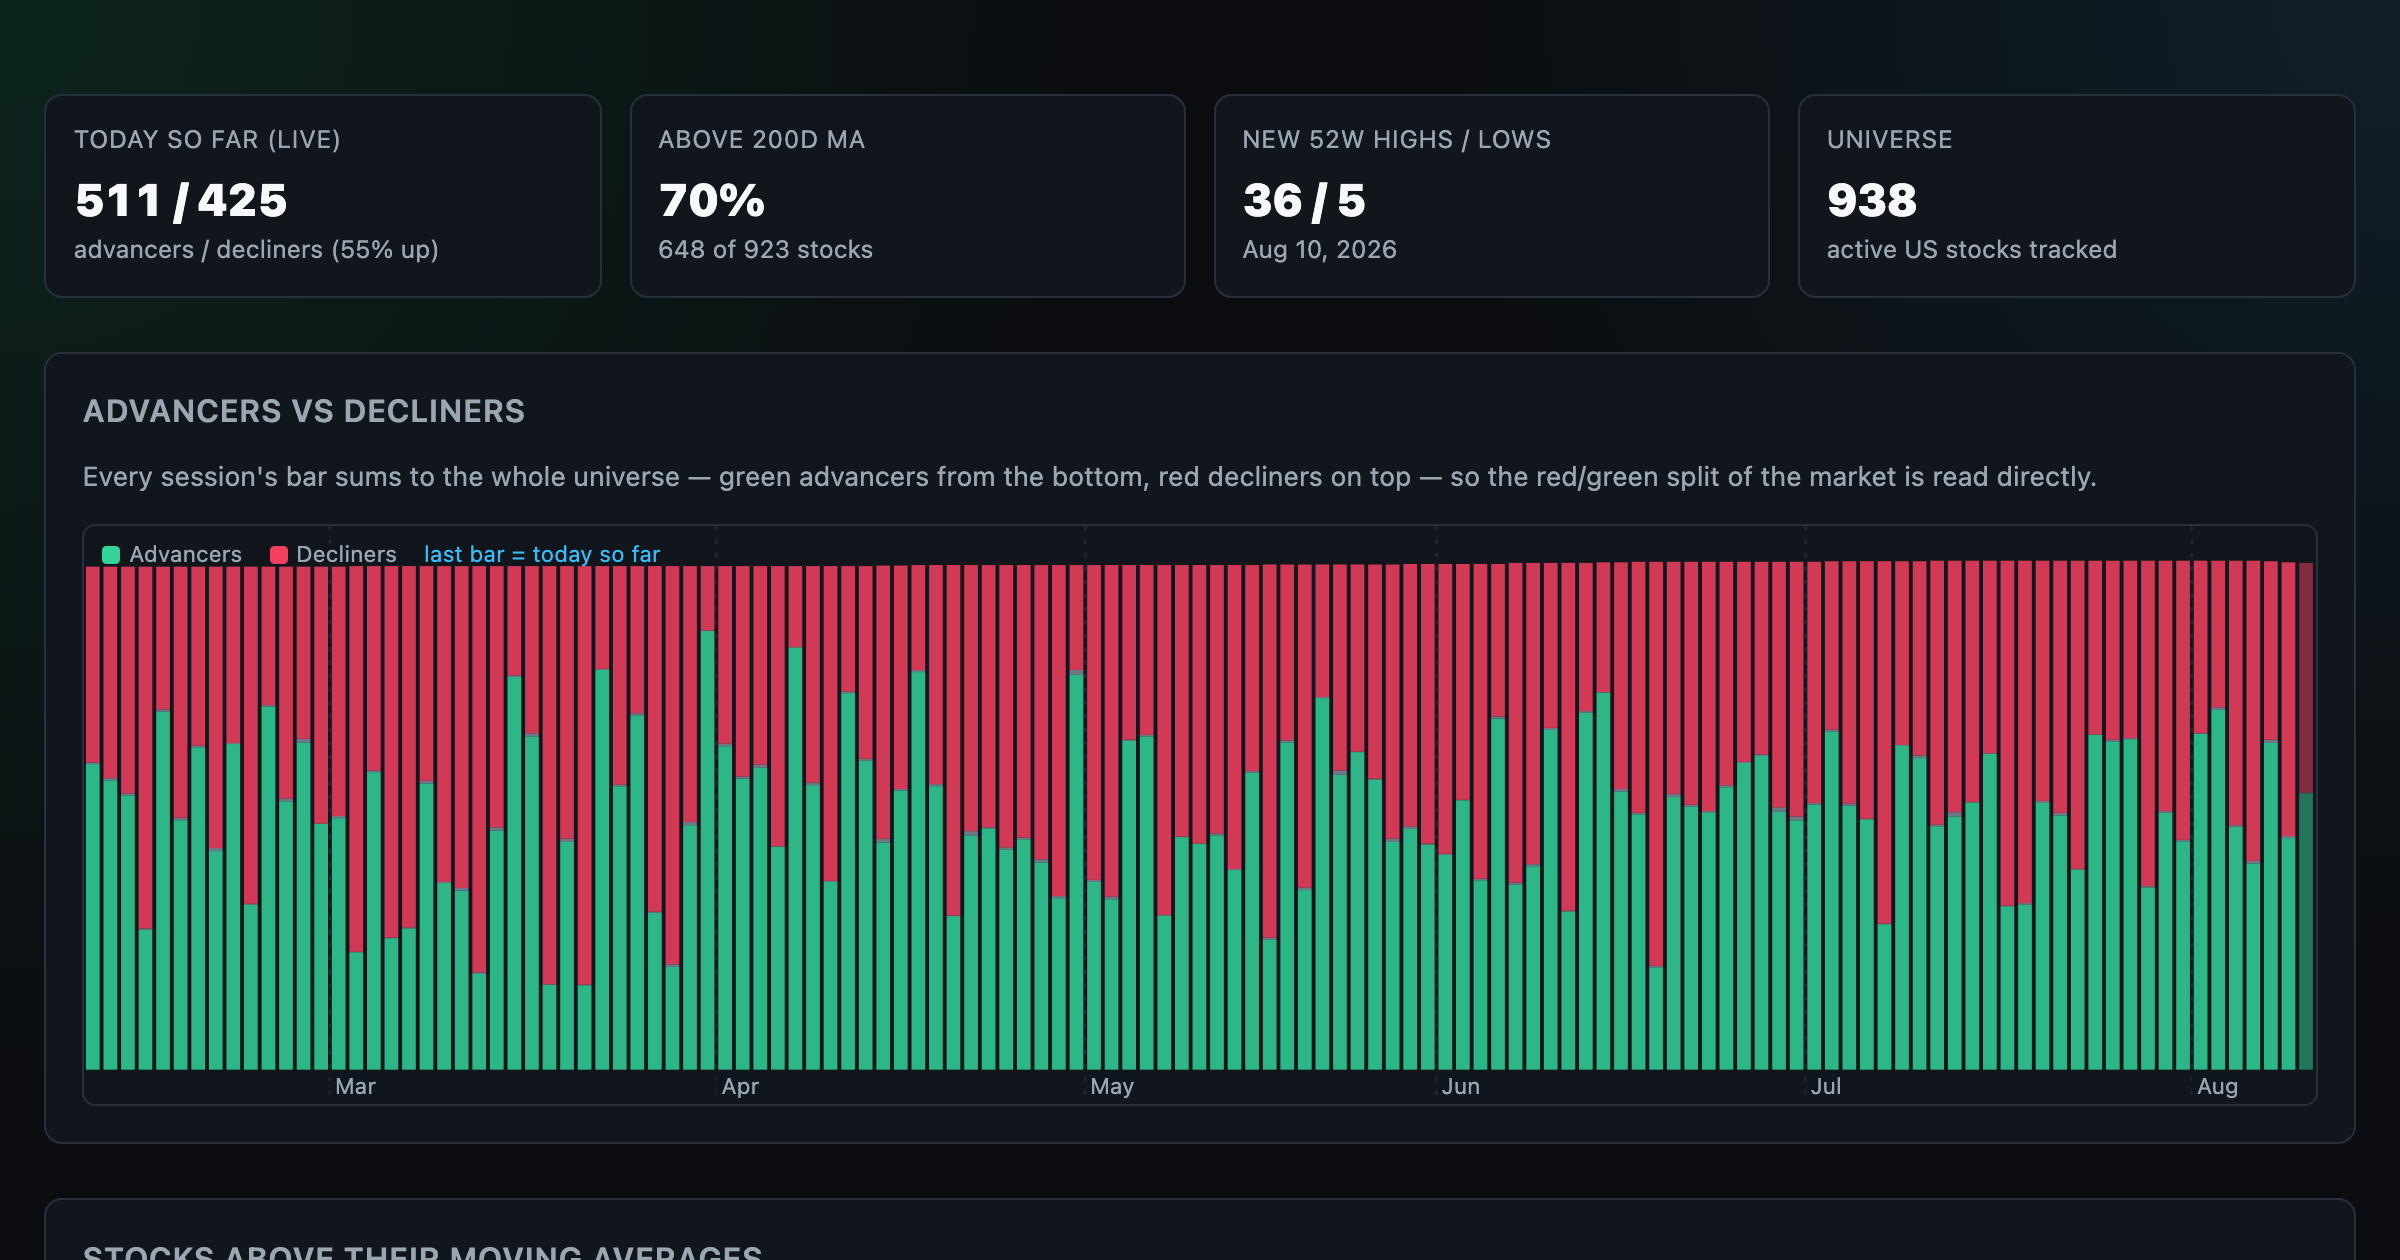
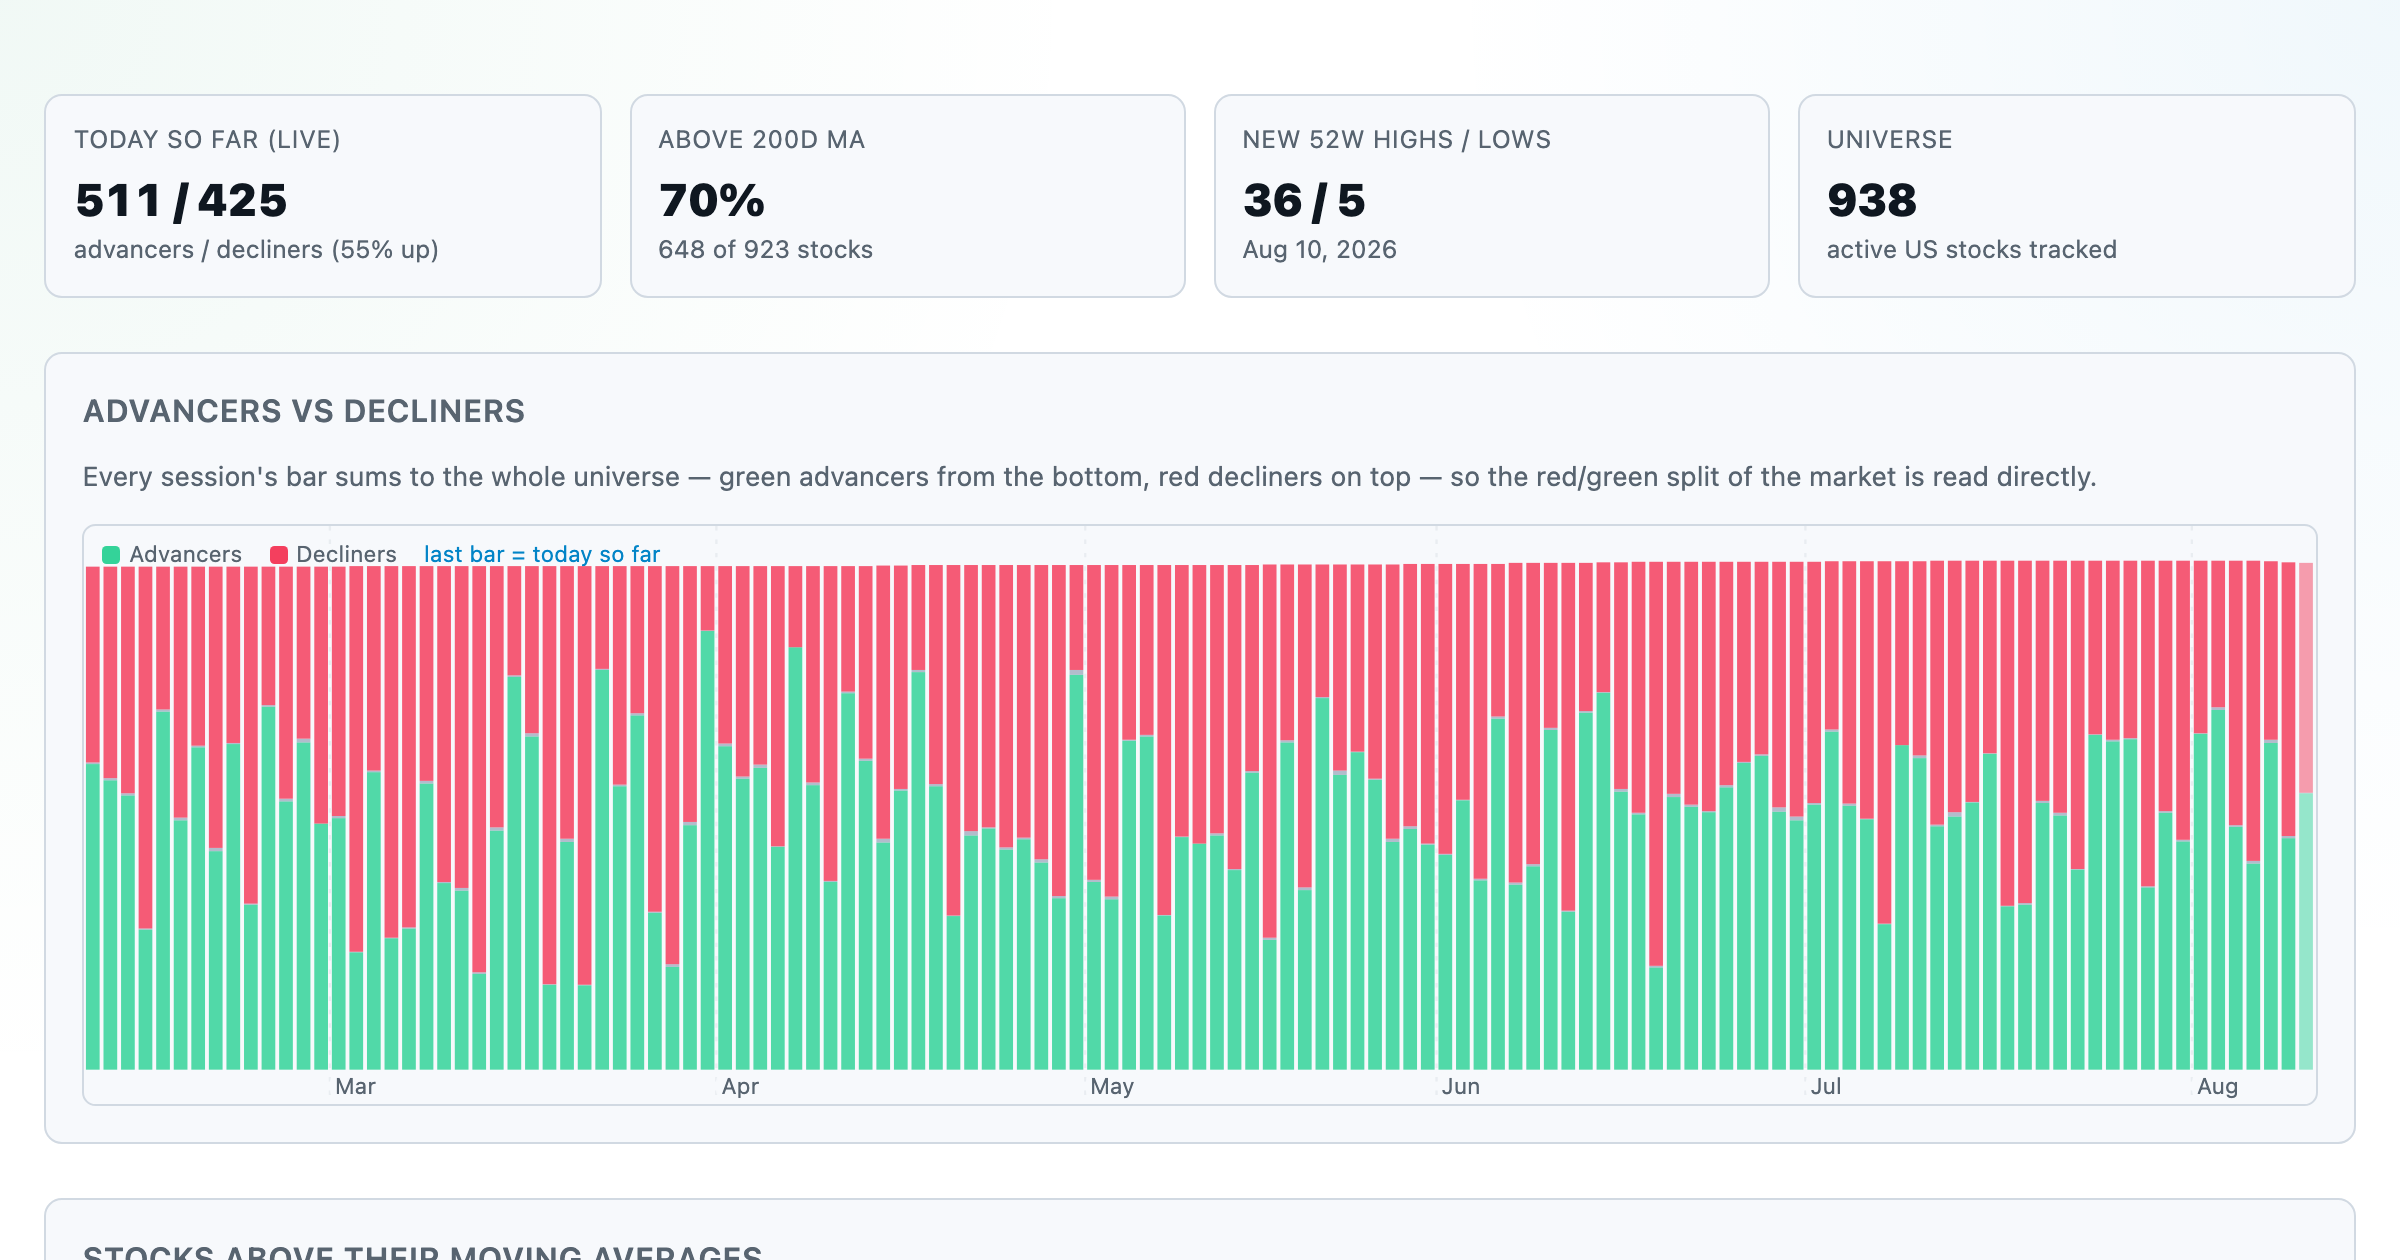
Advancers vs decliners over time, % of stocks above their moving averages, new highs vs lows, and breadth across every trailing window.
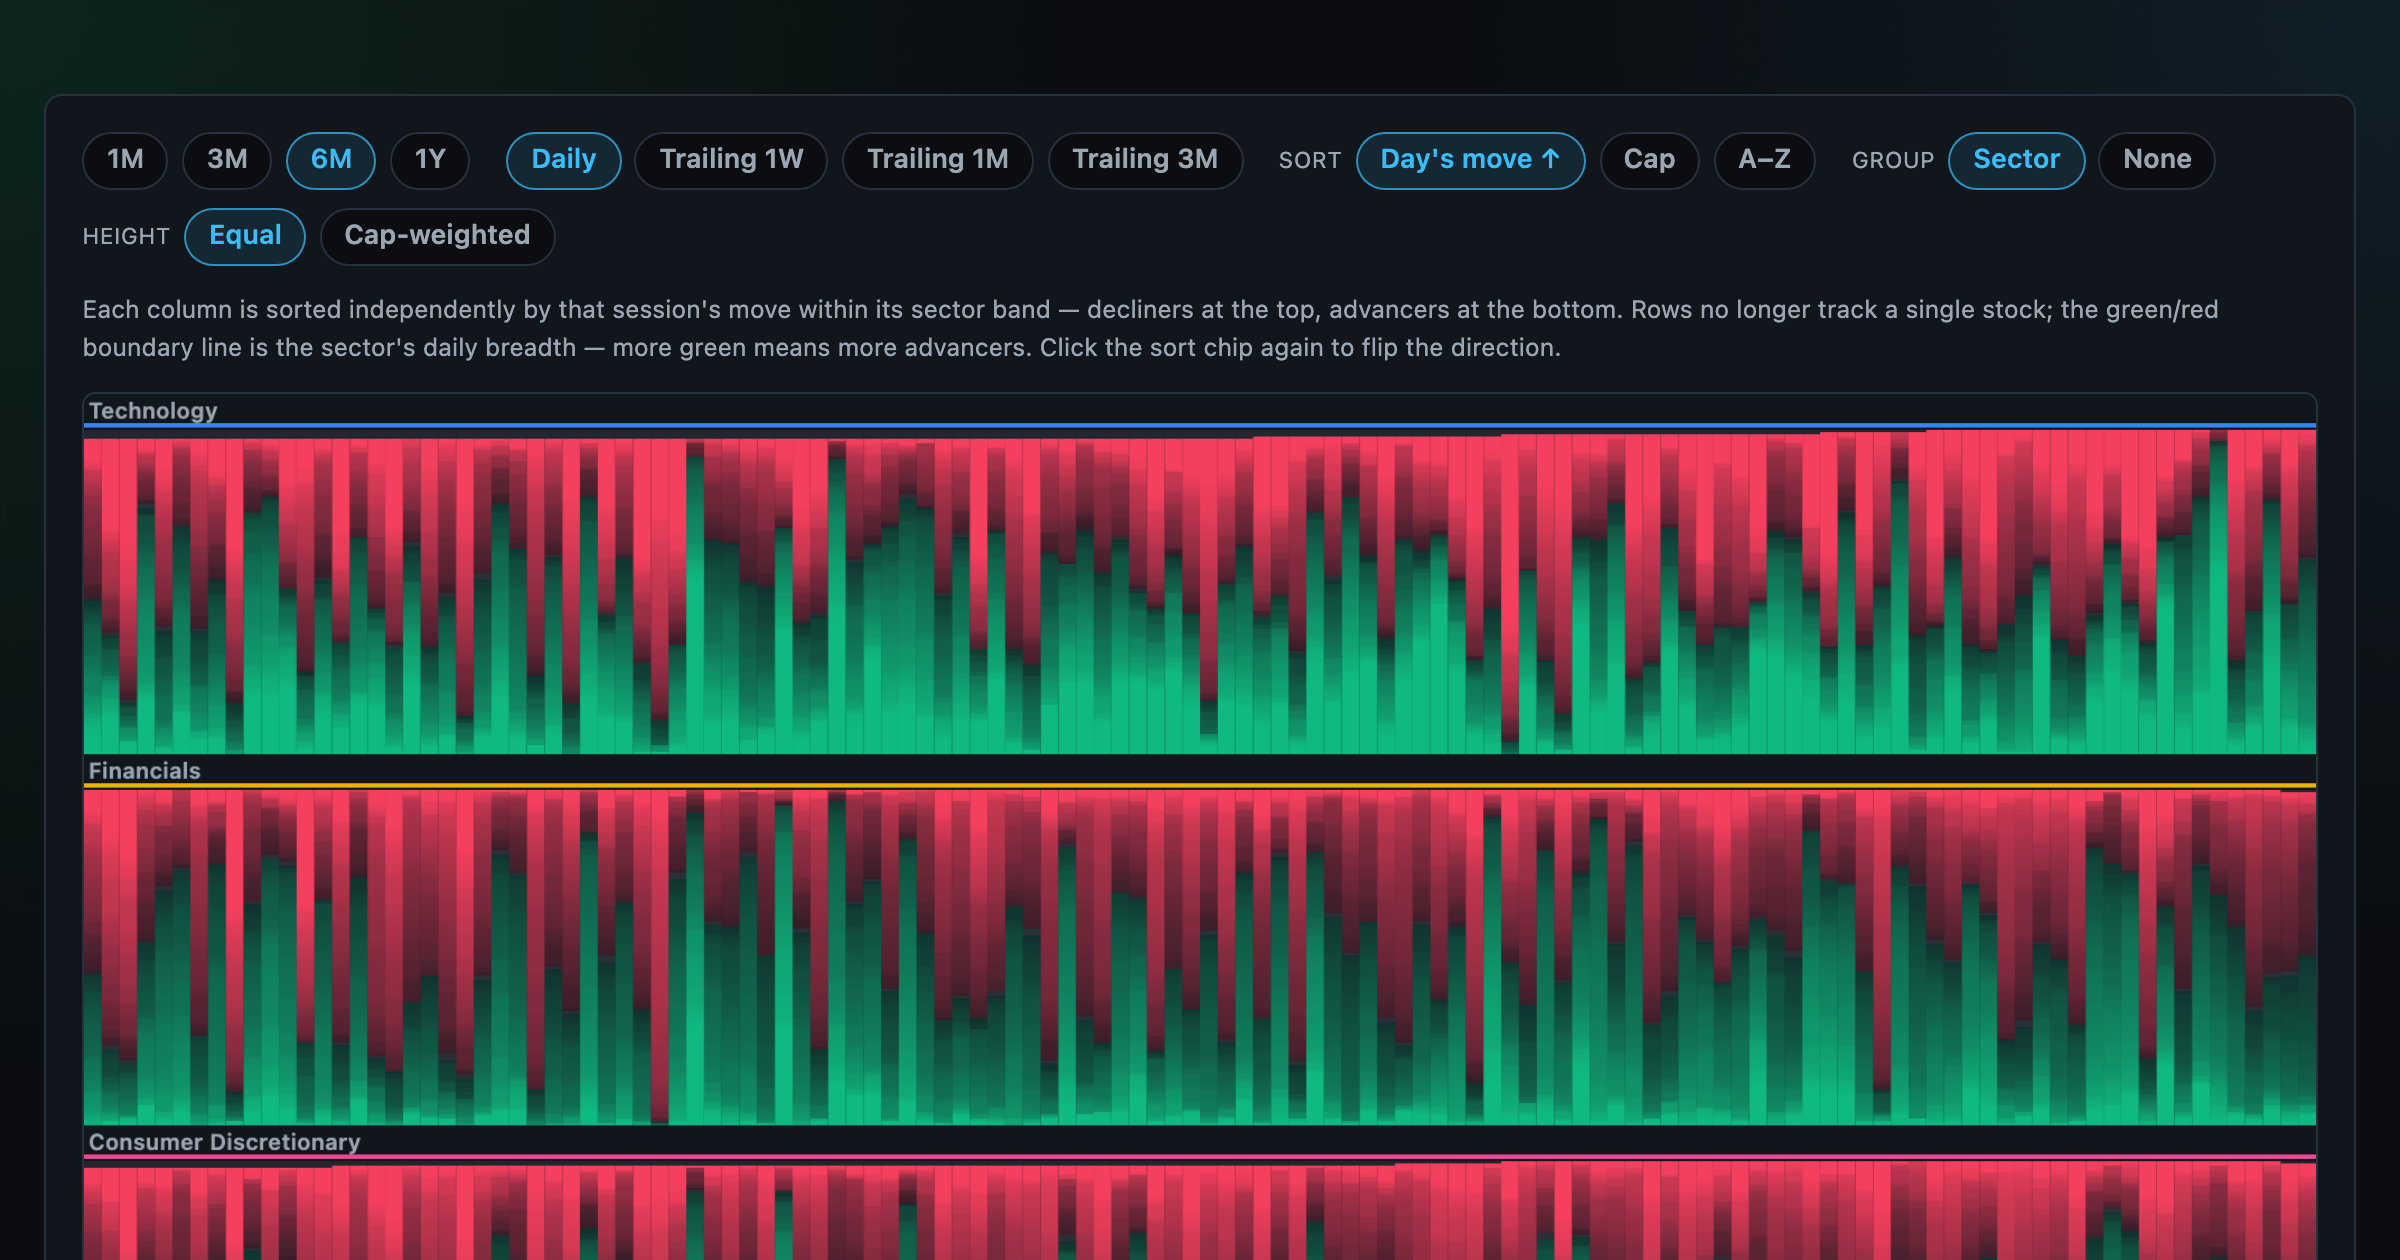
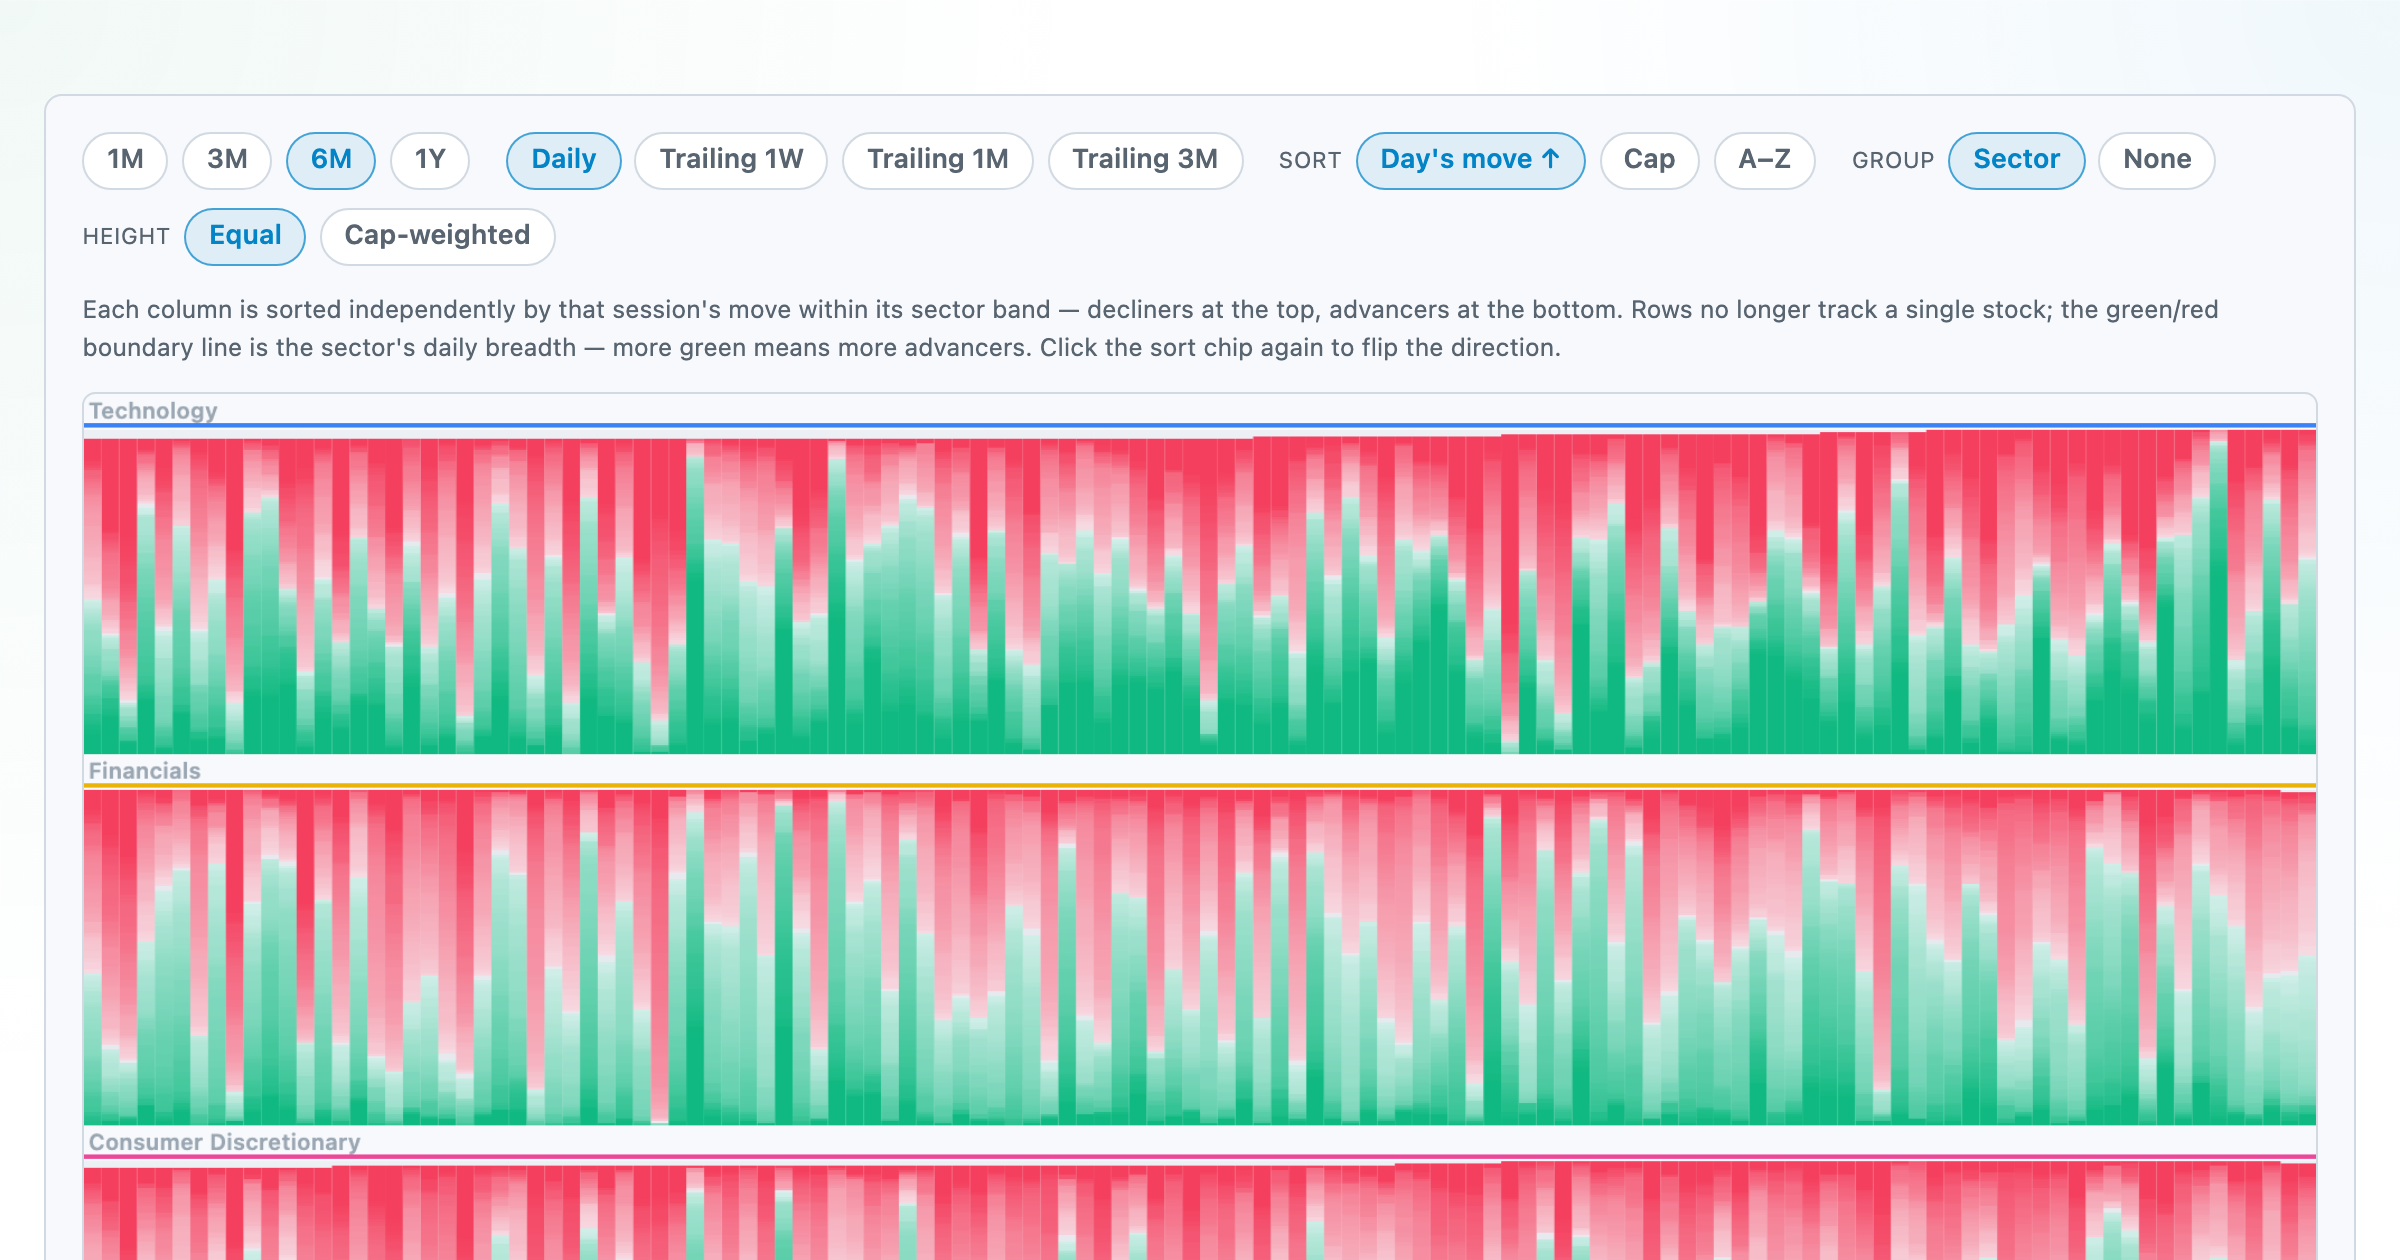
Every stock as a row, every day as a column — market selloffs are vertical stripes, sector routs are blocks.
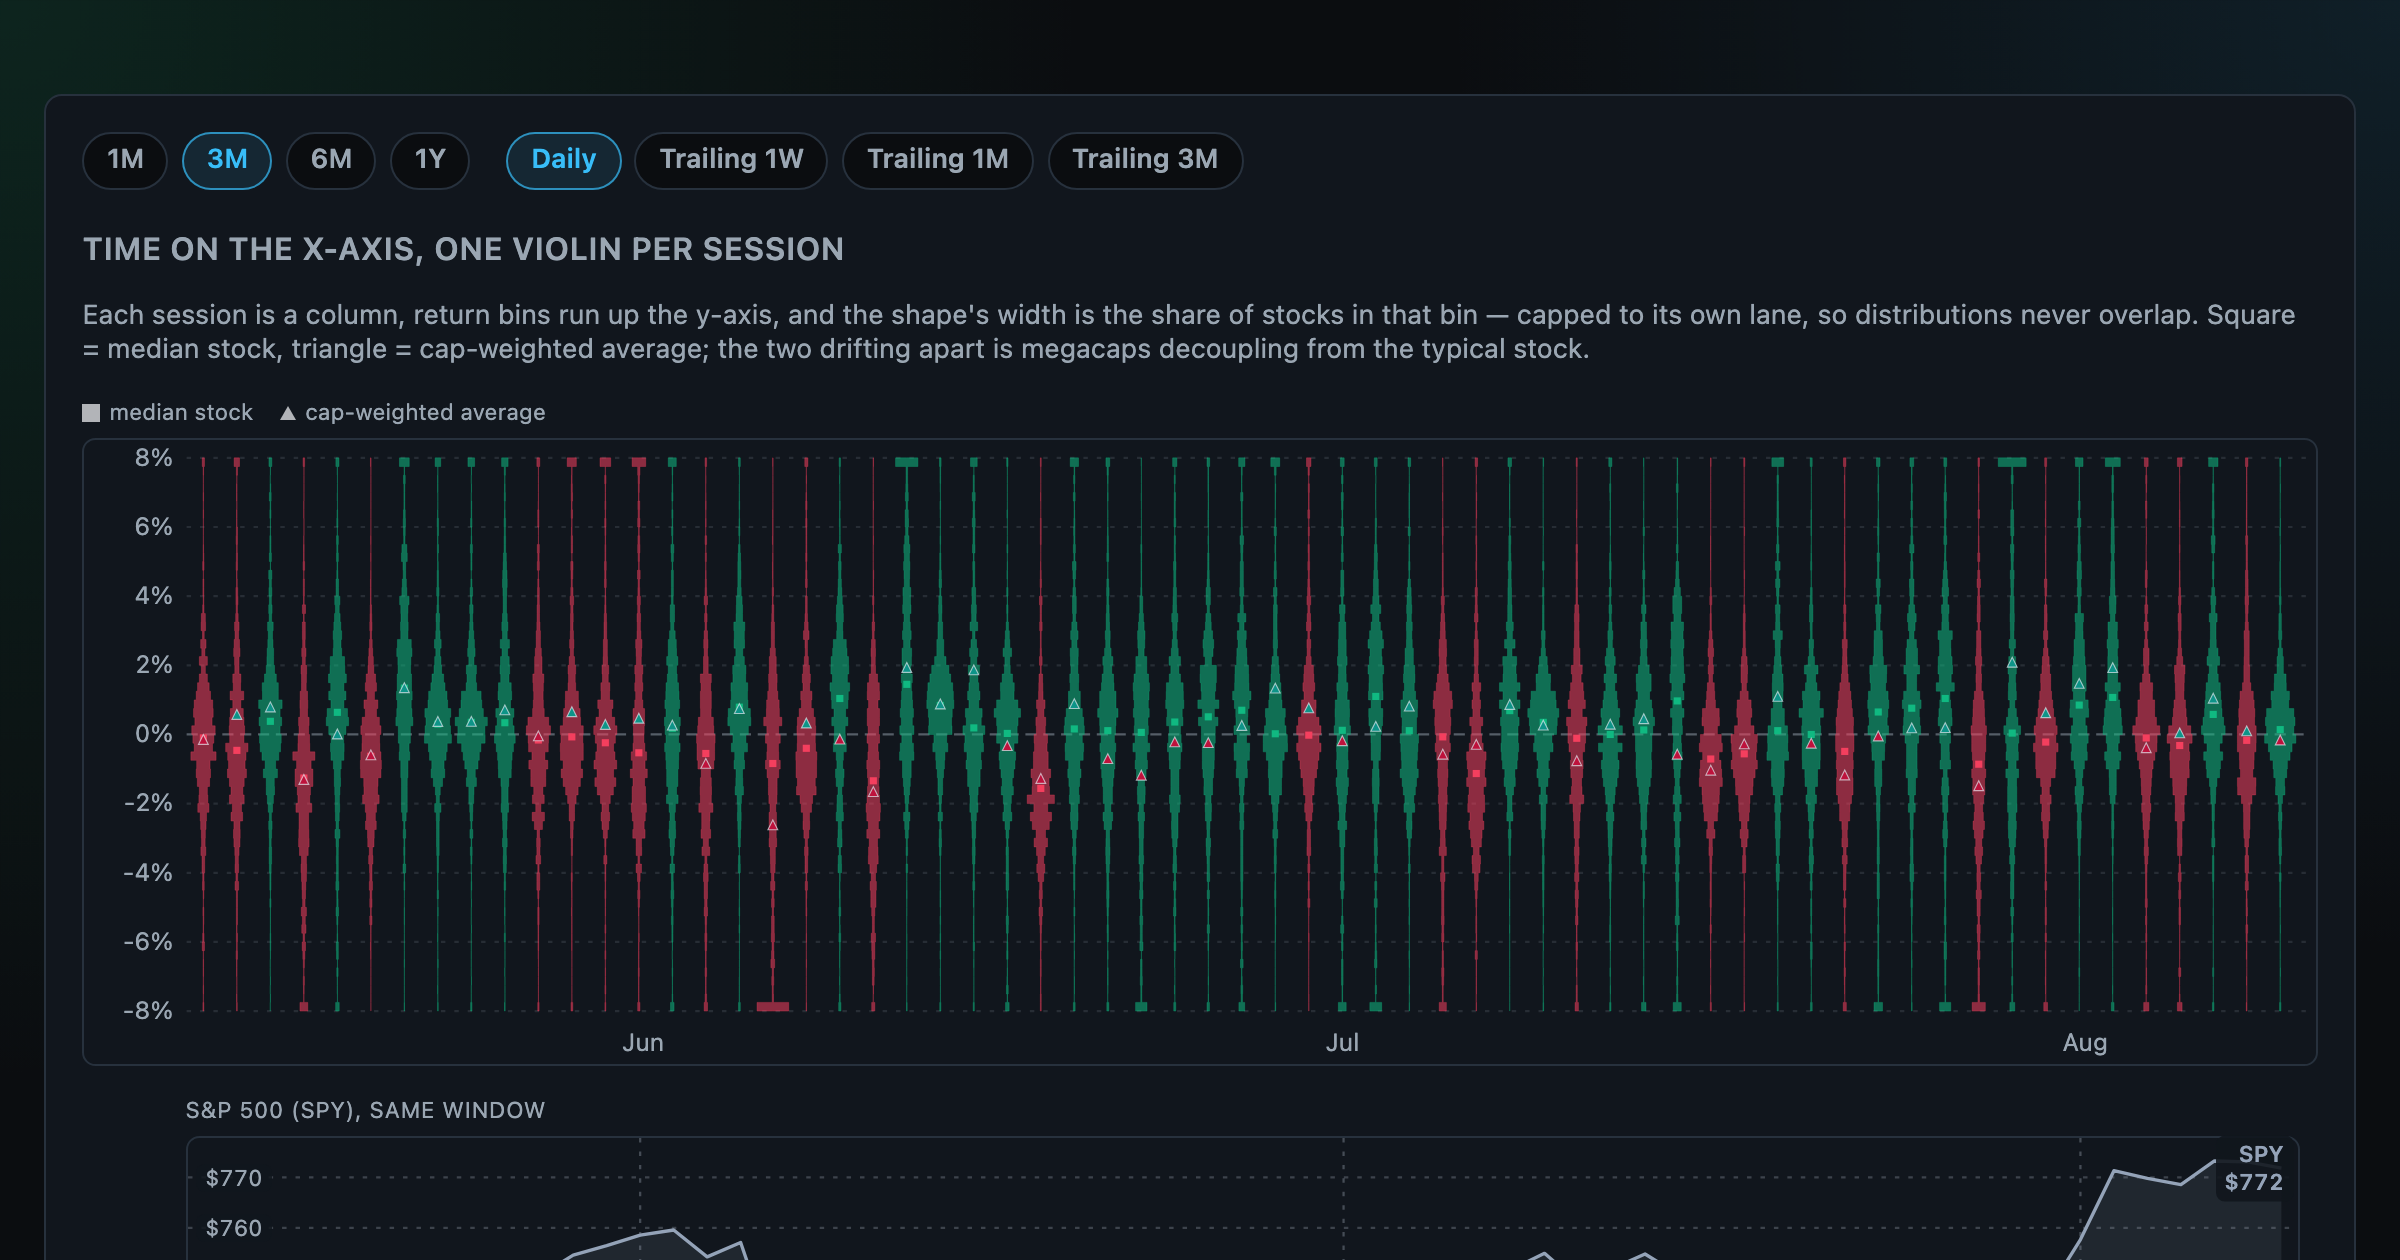
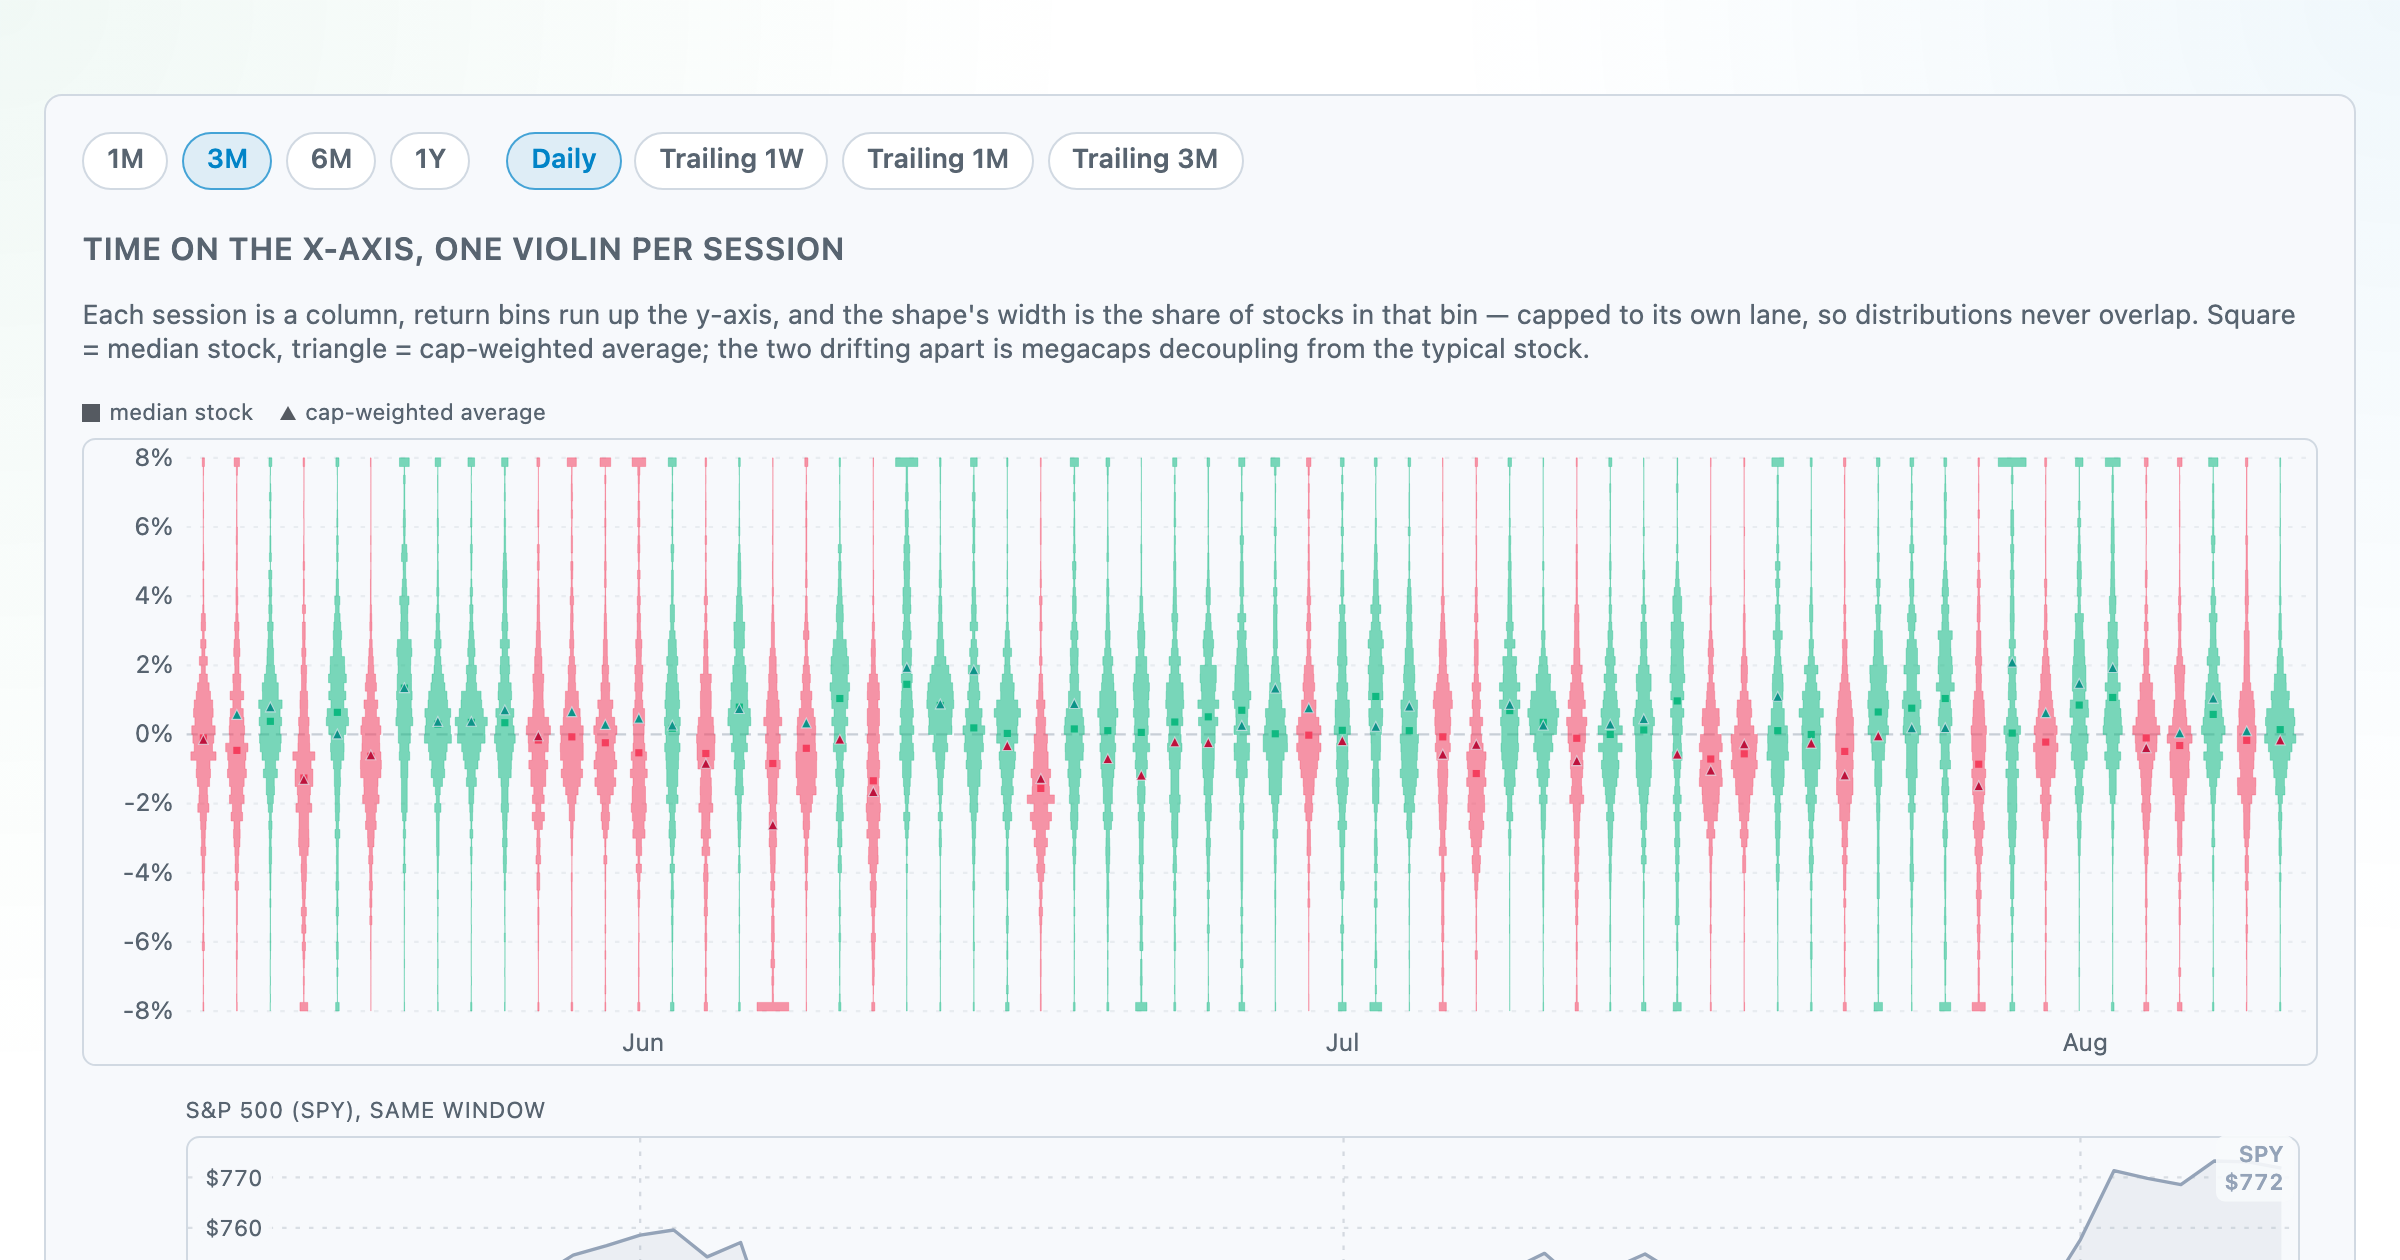
Each session's full distribution of stock returns as an upright violin, with the S&P 500 on the same axis — shifts, dispersion, and fat tails at a glance.
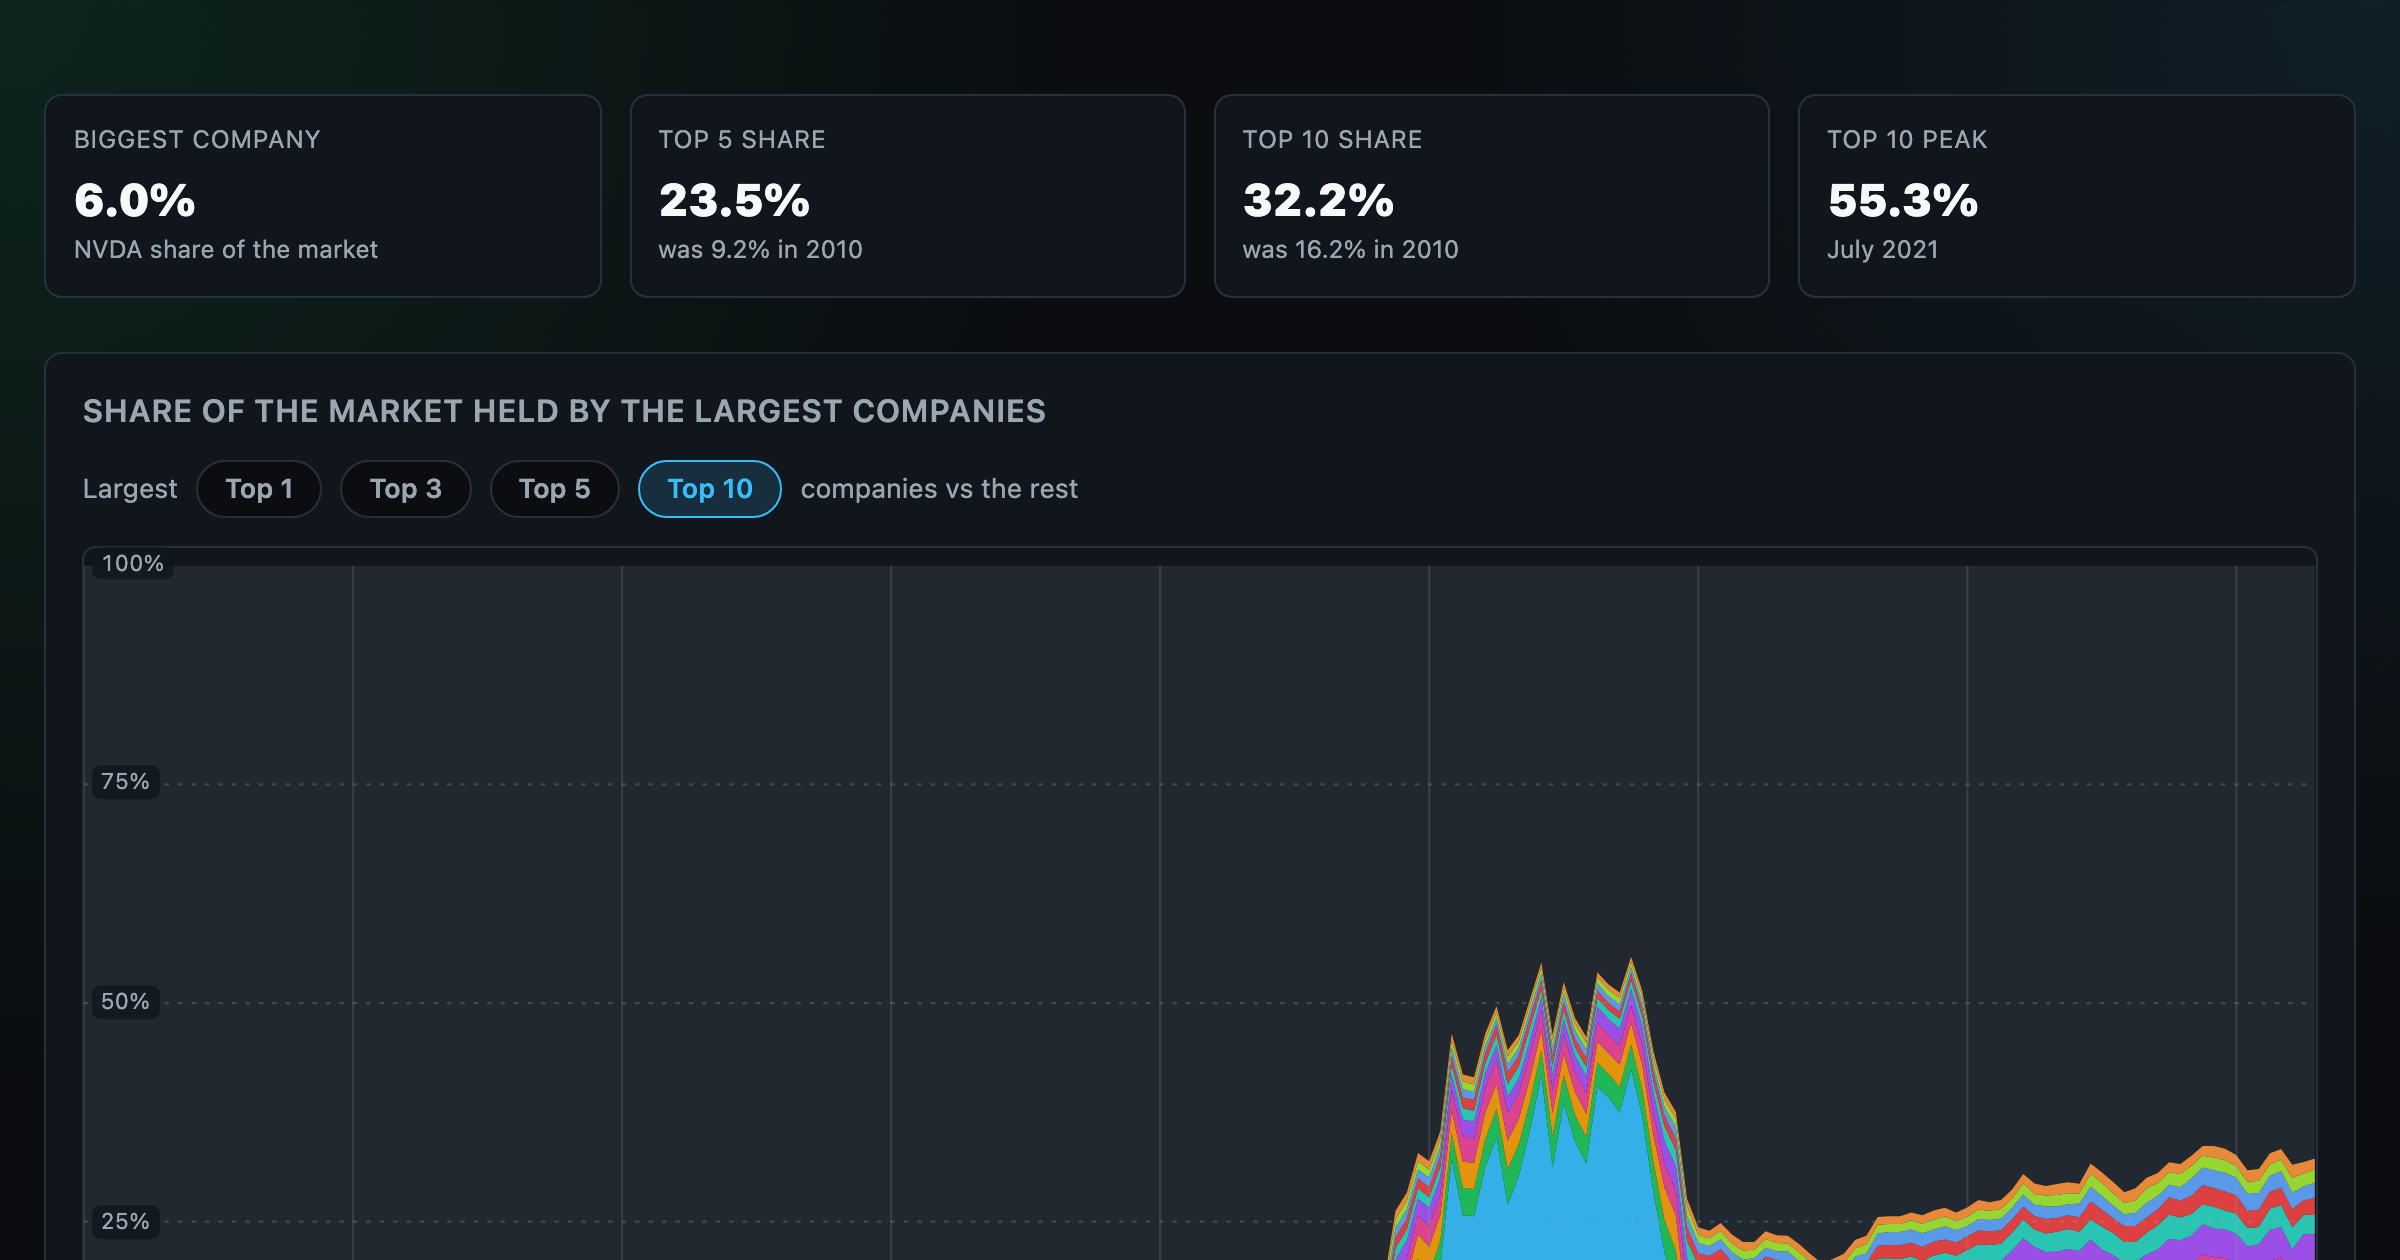
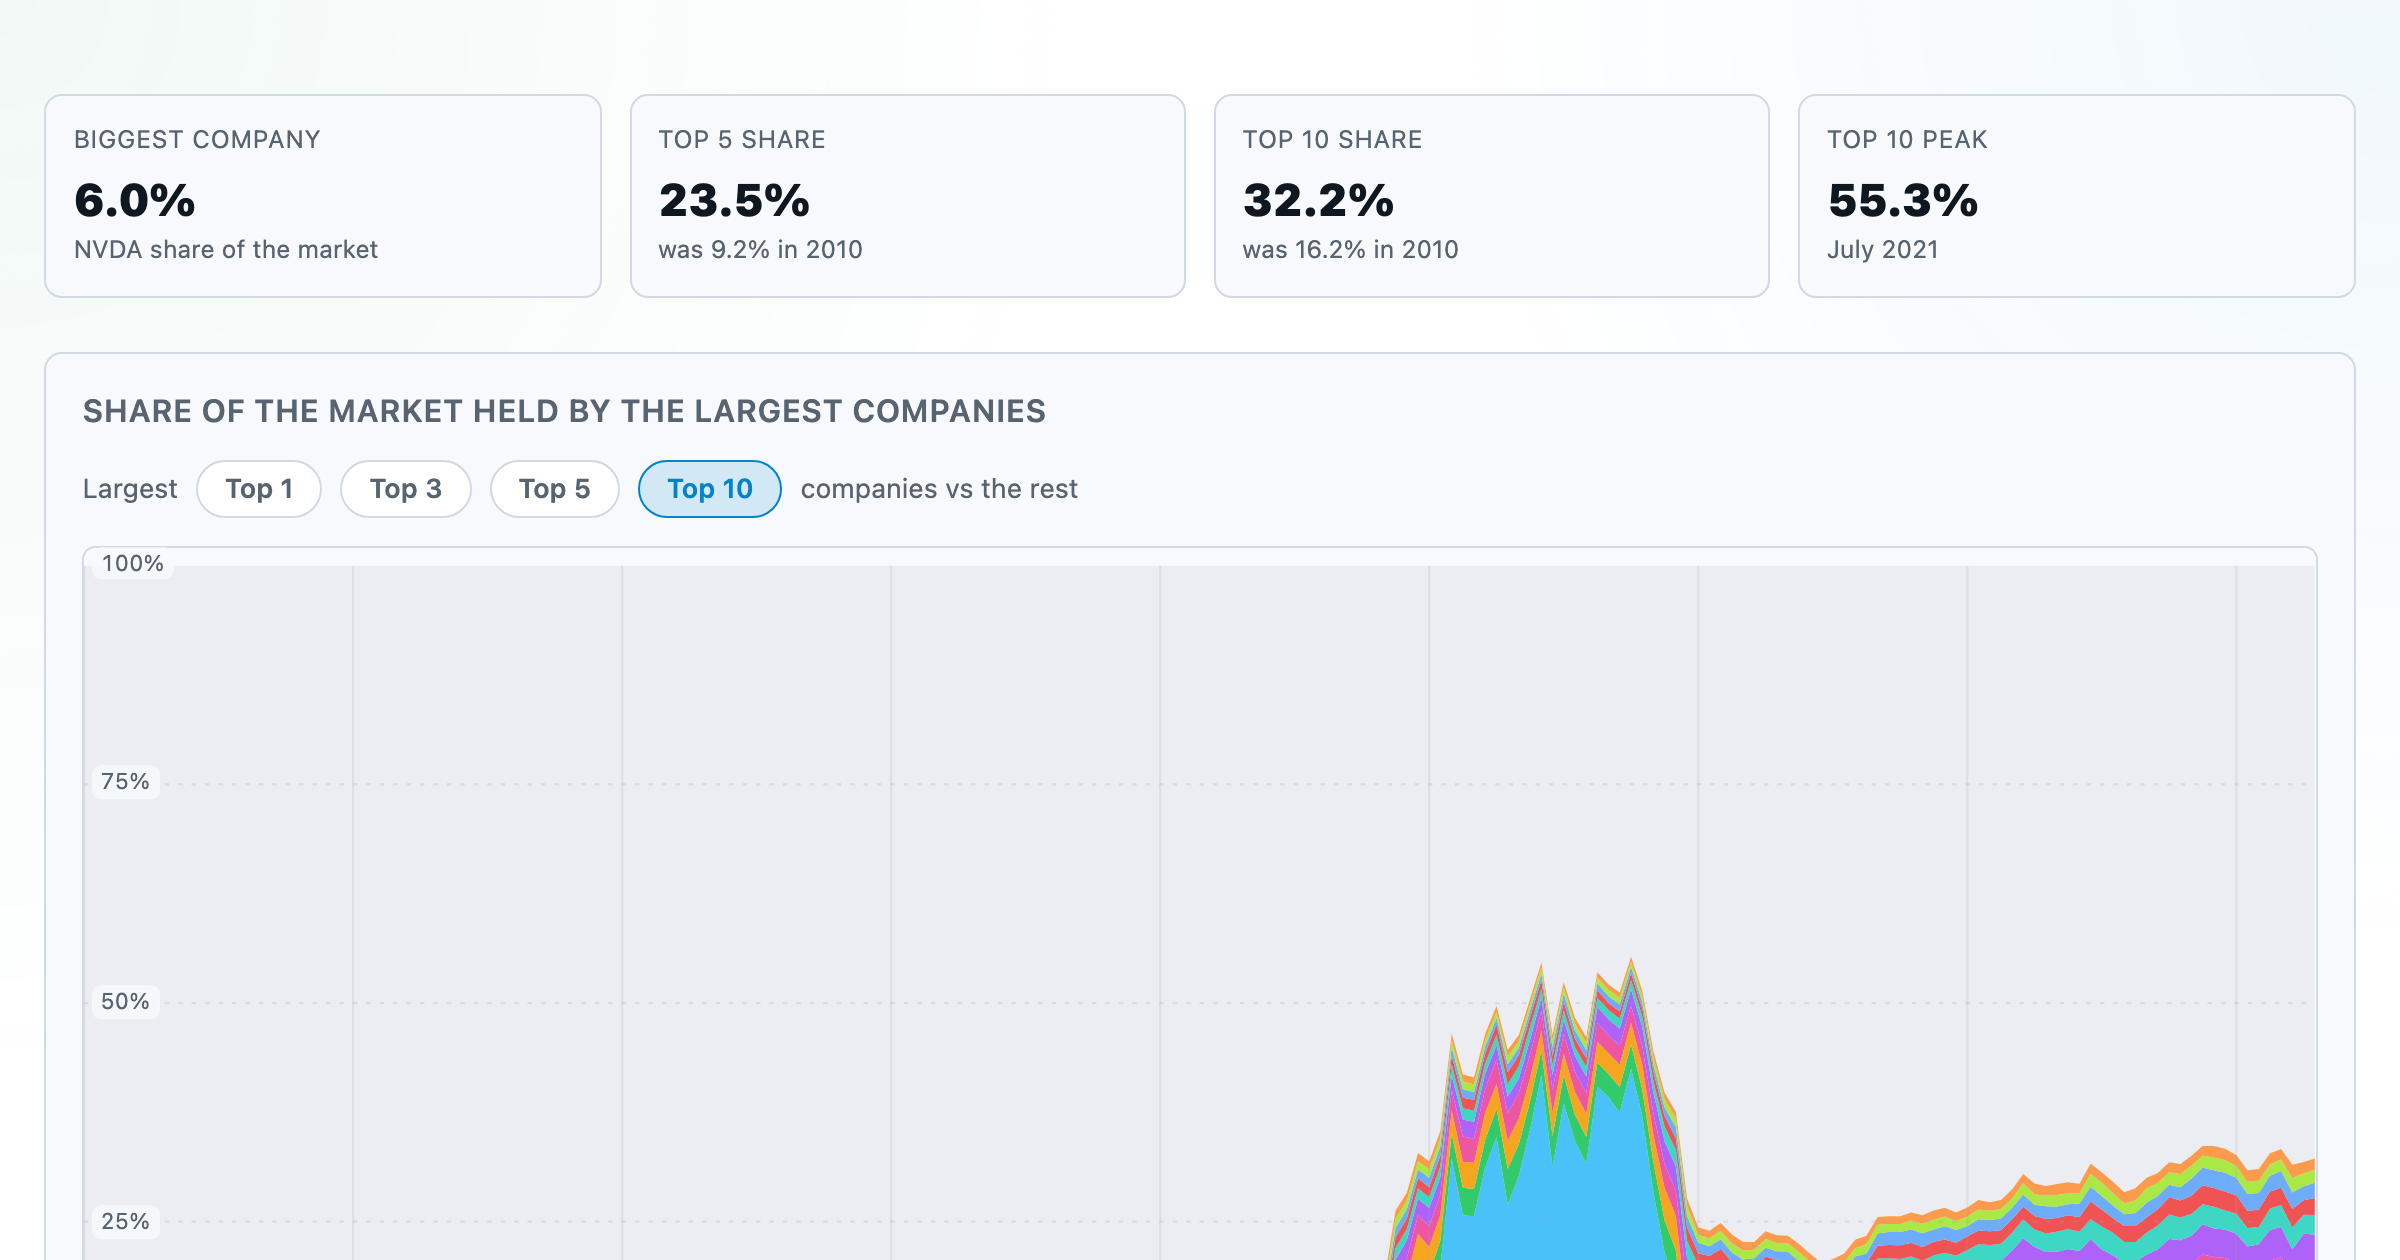
How top-heavy is the market? The top 1–10 companies' share of total market value, month by month since 2010.
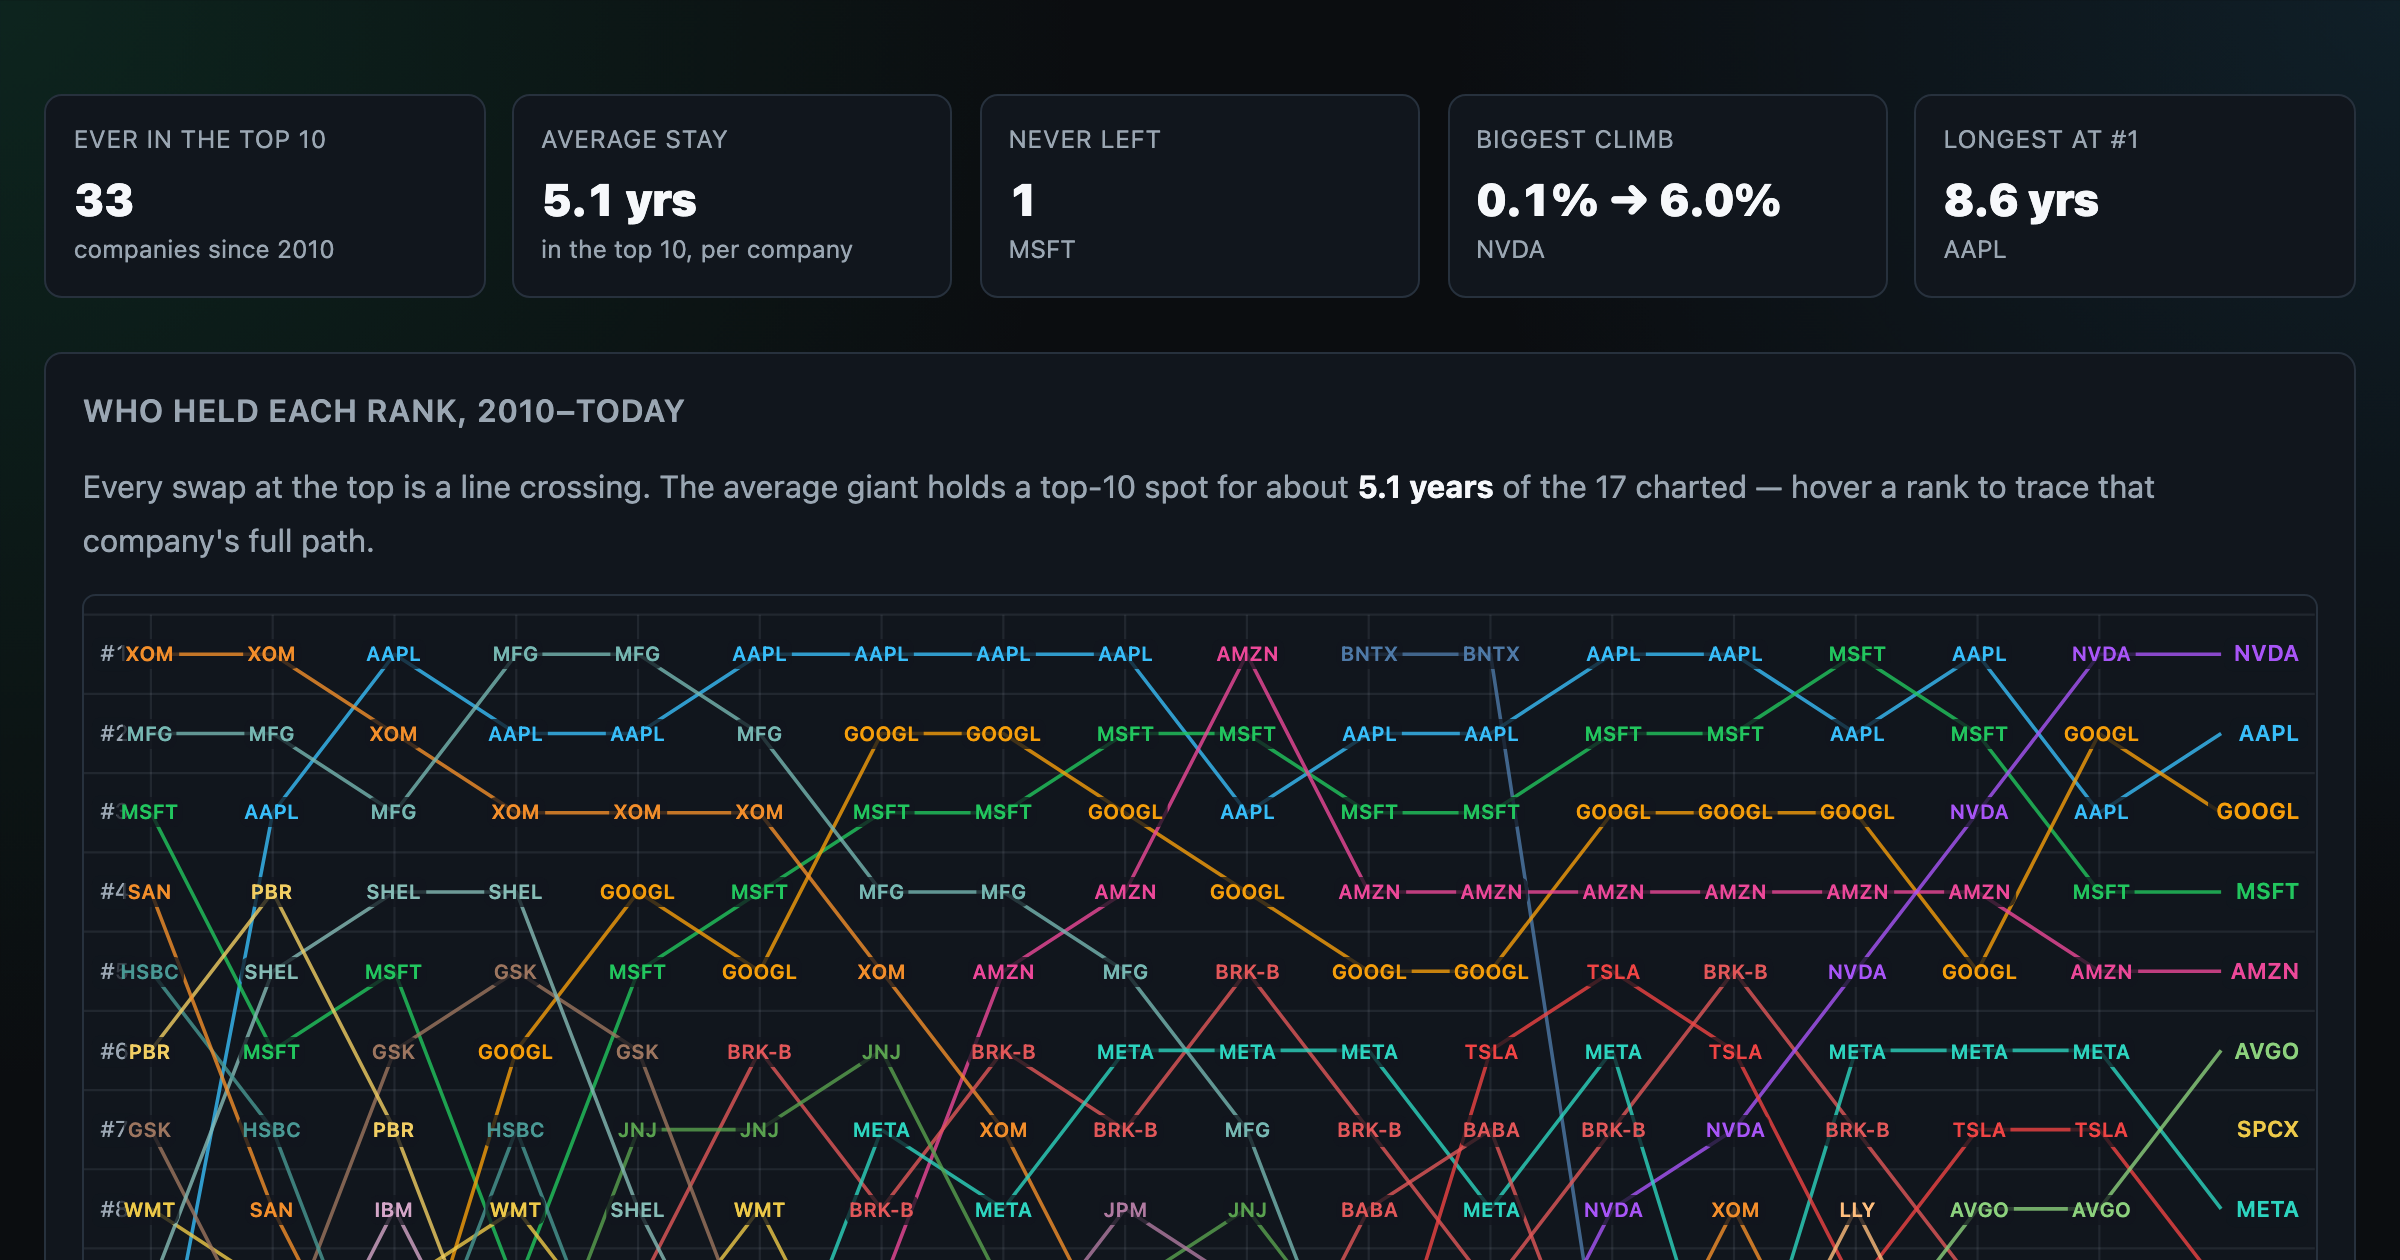
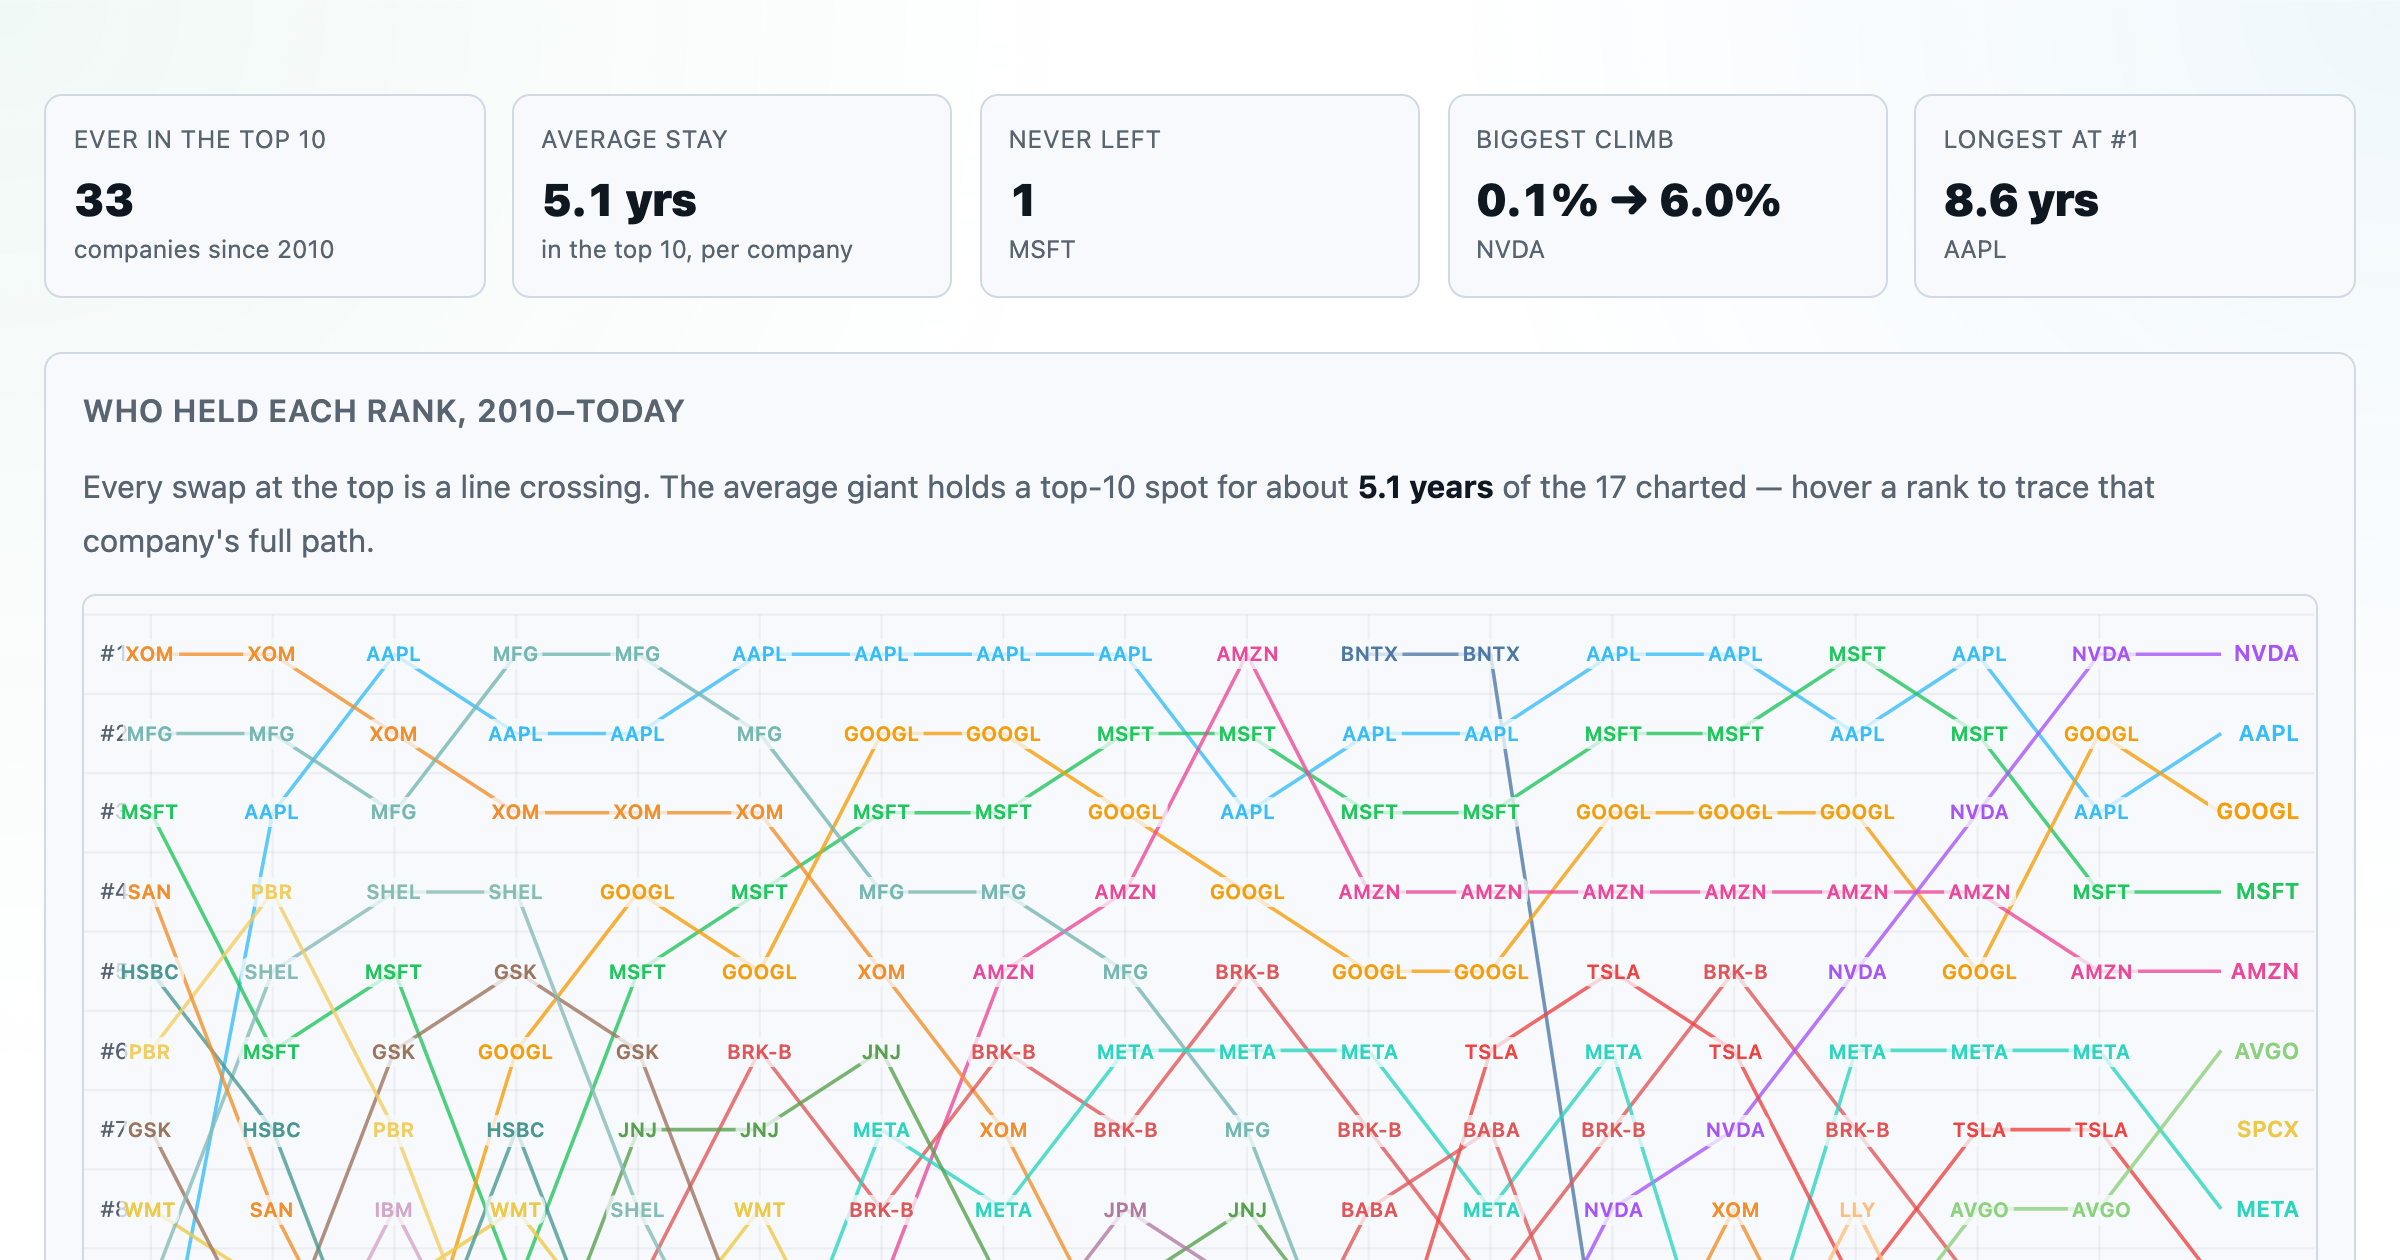
Every company that ever cracked the market's top 10 since 2010 — who climbed, who faded, who never left.
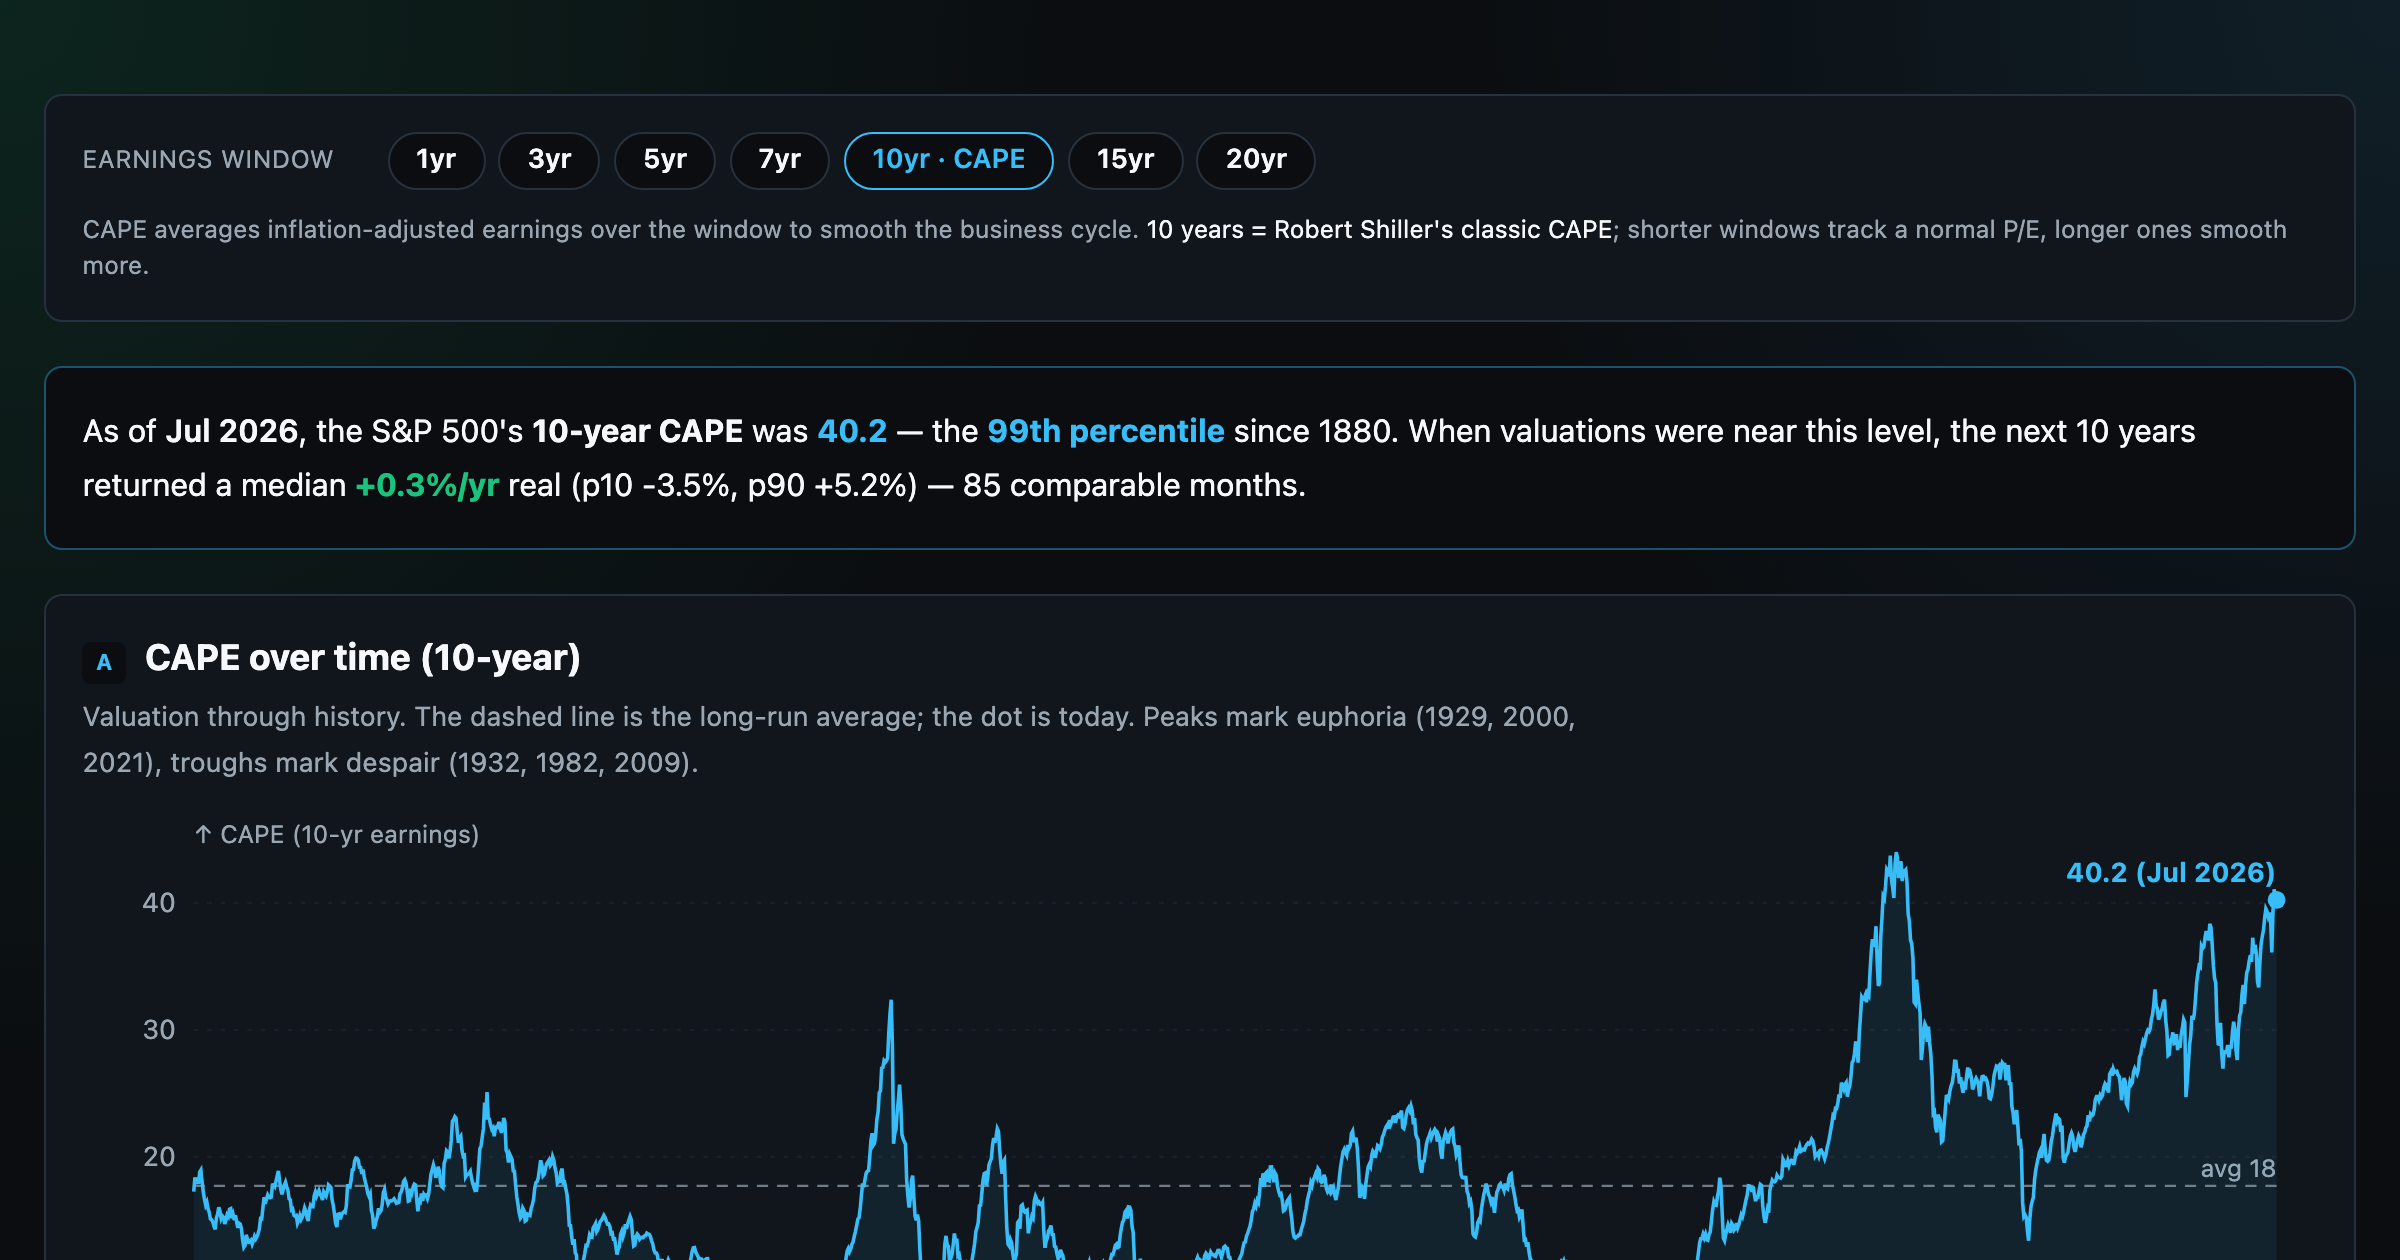
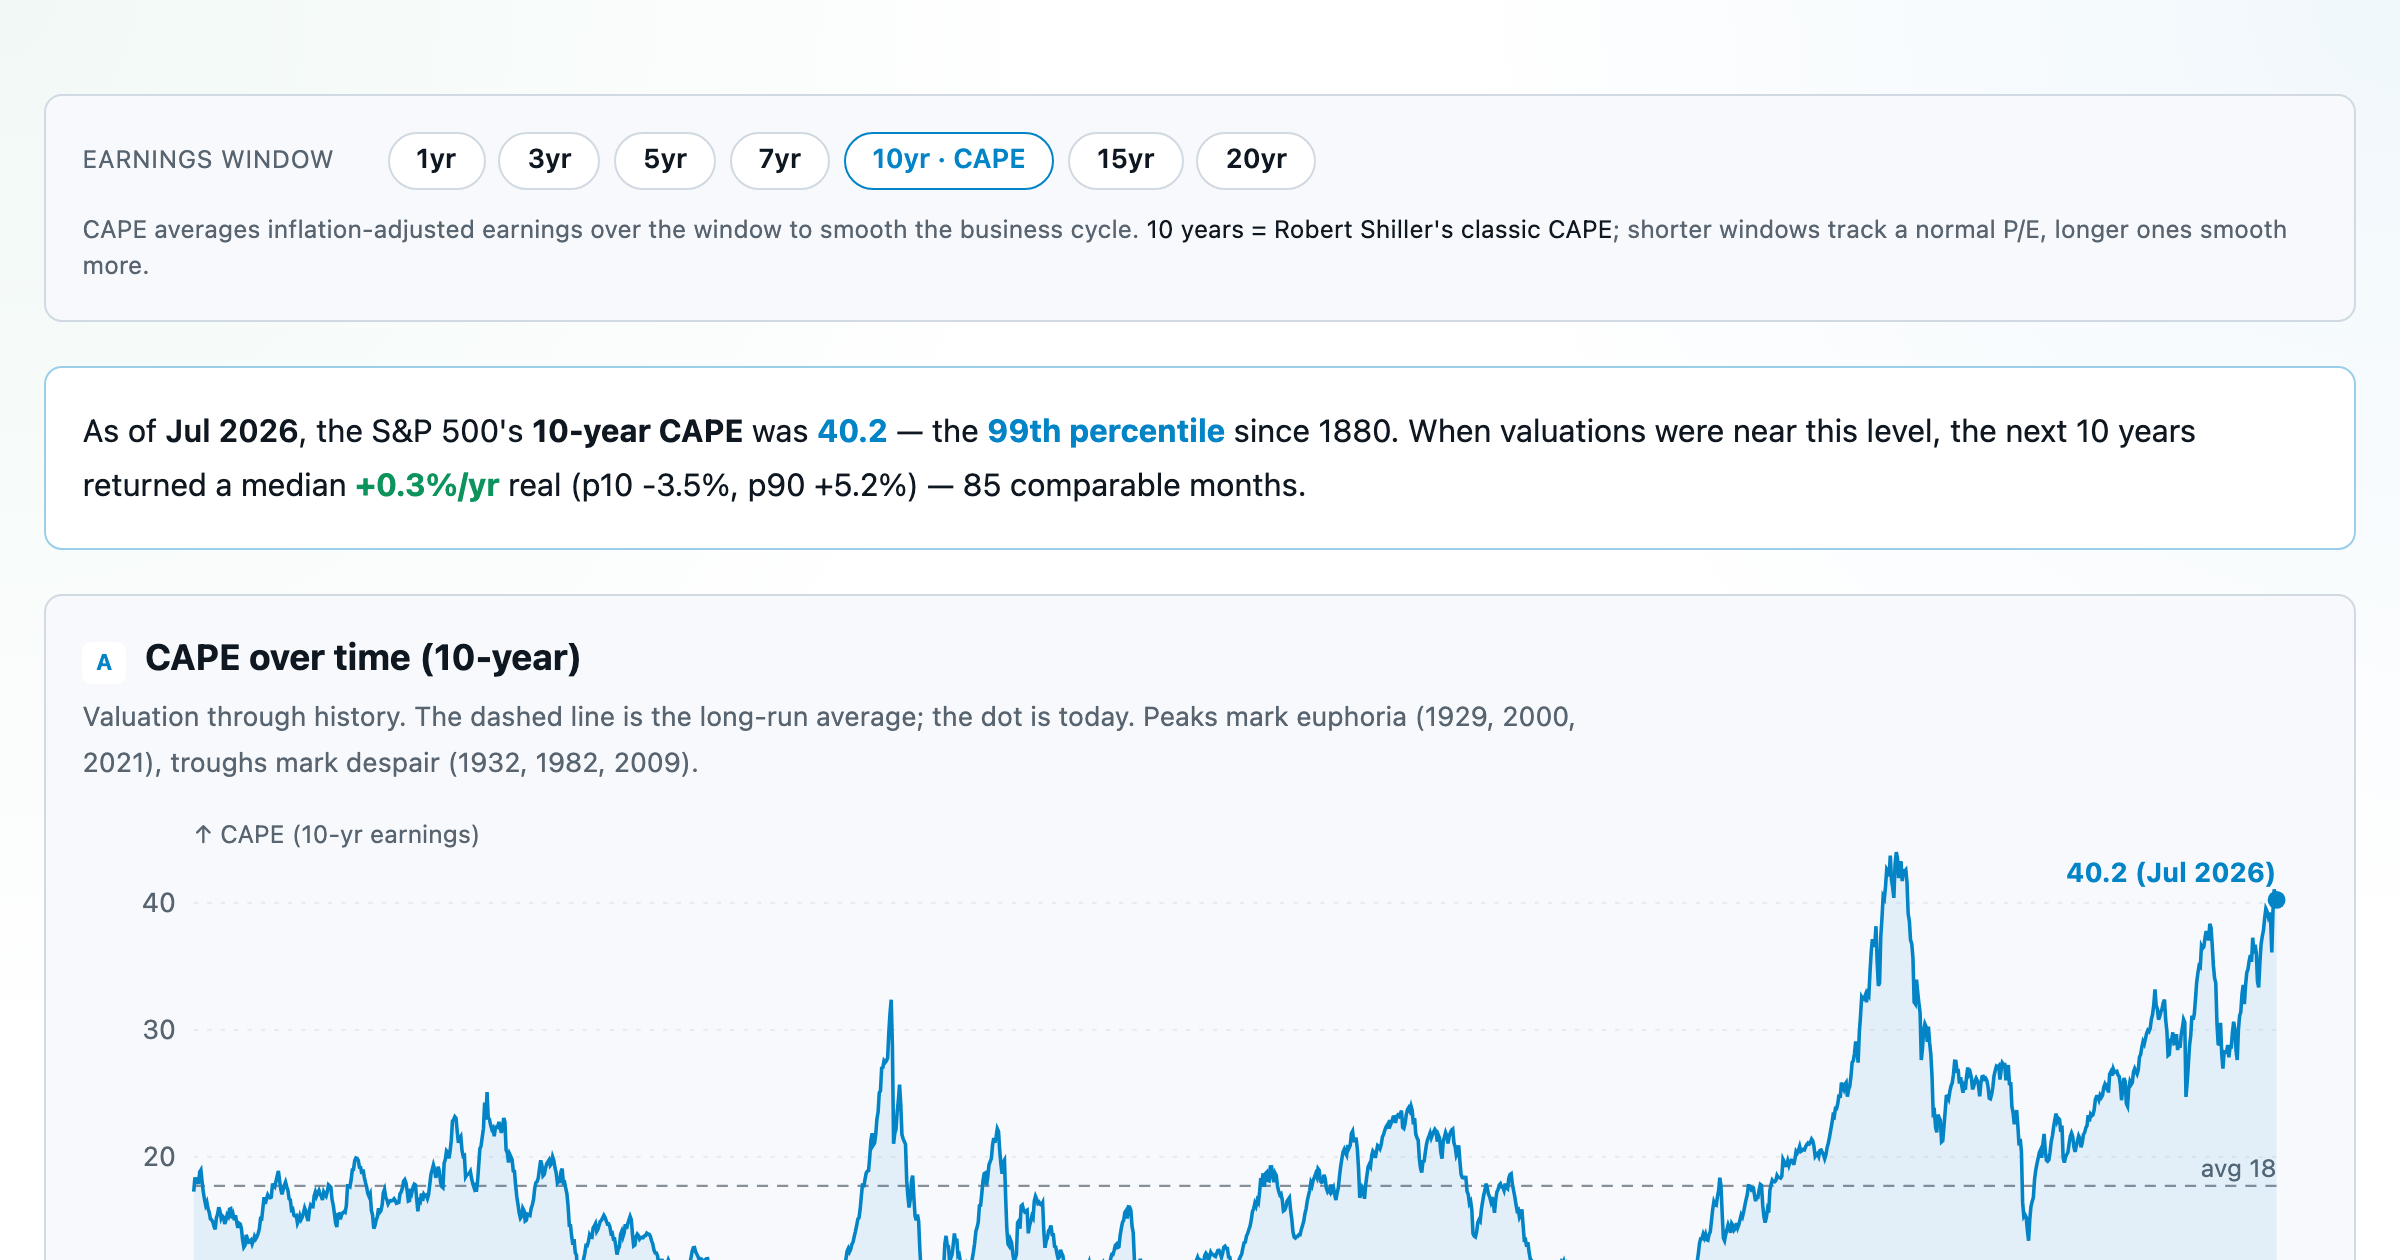
Is the market expensive? The Shiller CAPE back to 1871 and what valuations have meant for the next decade.
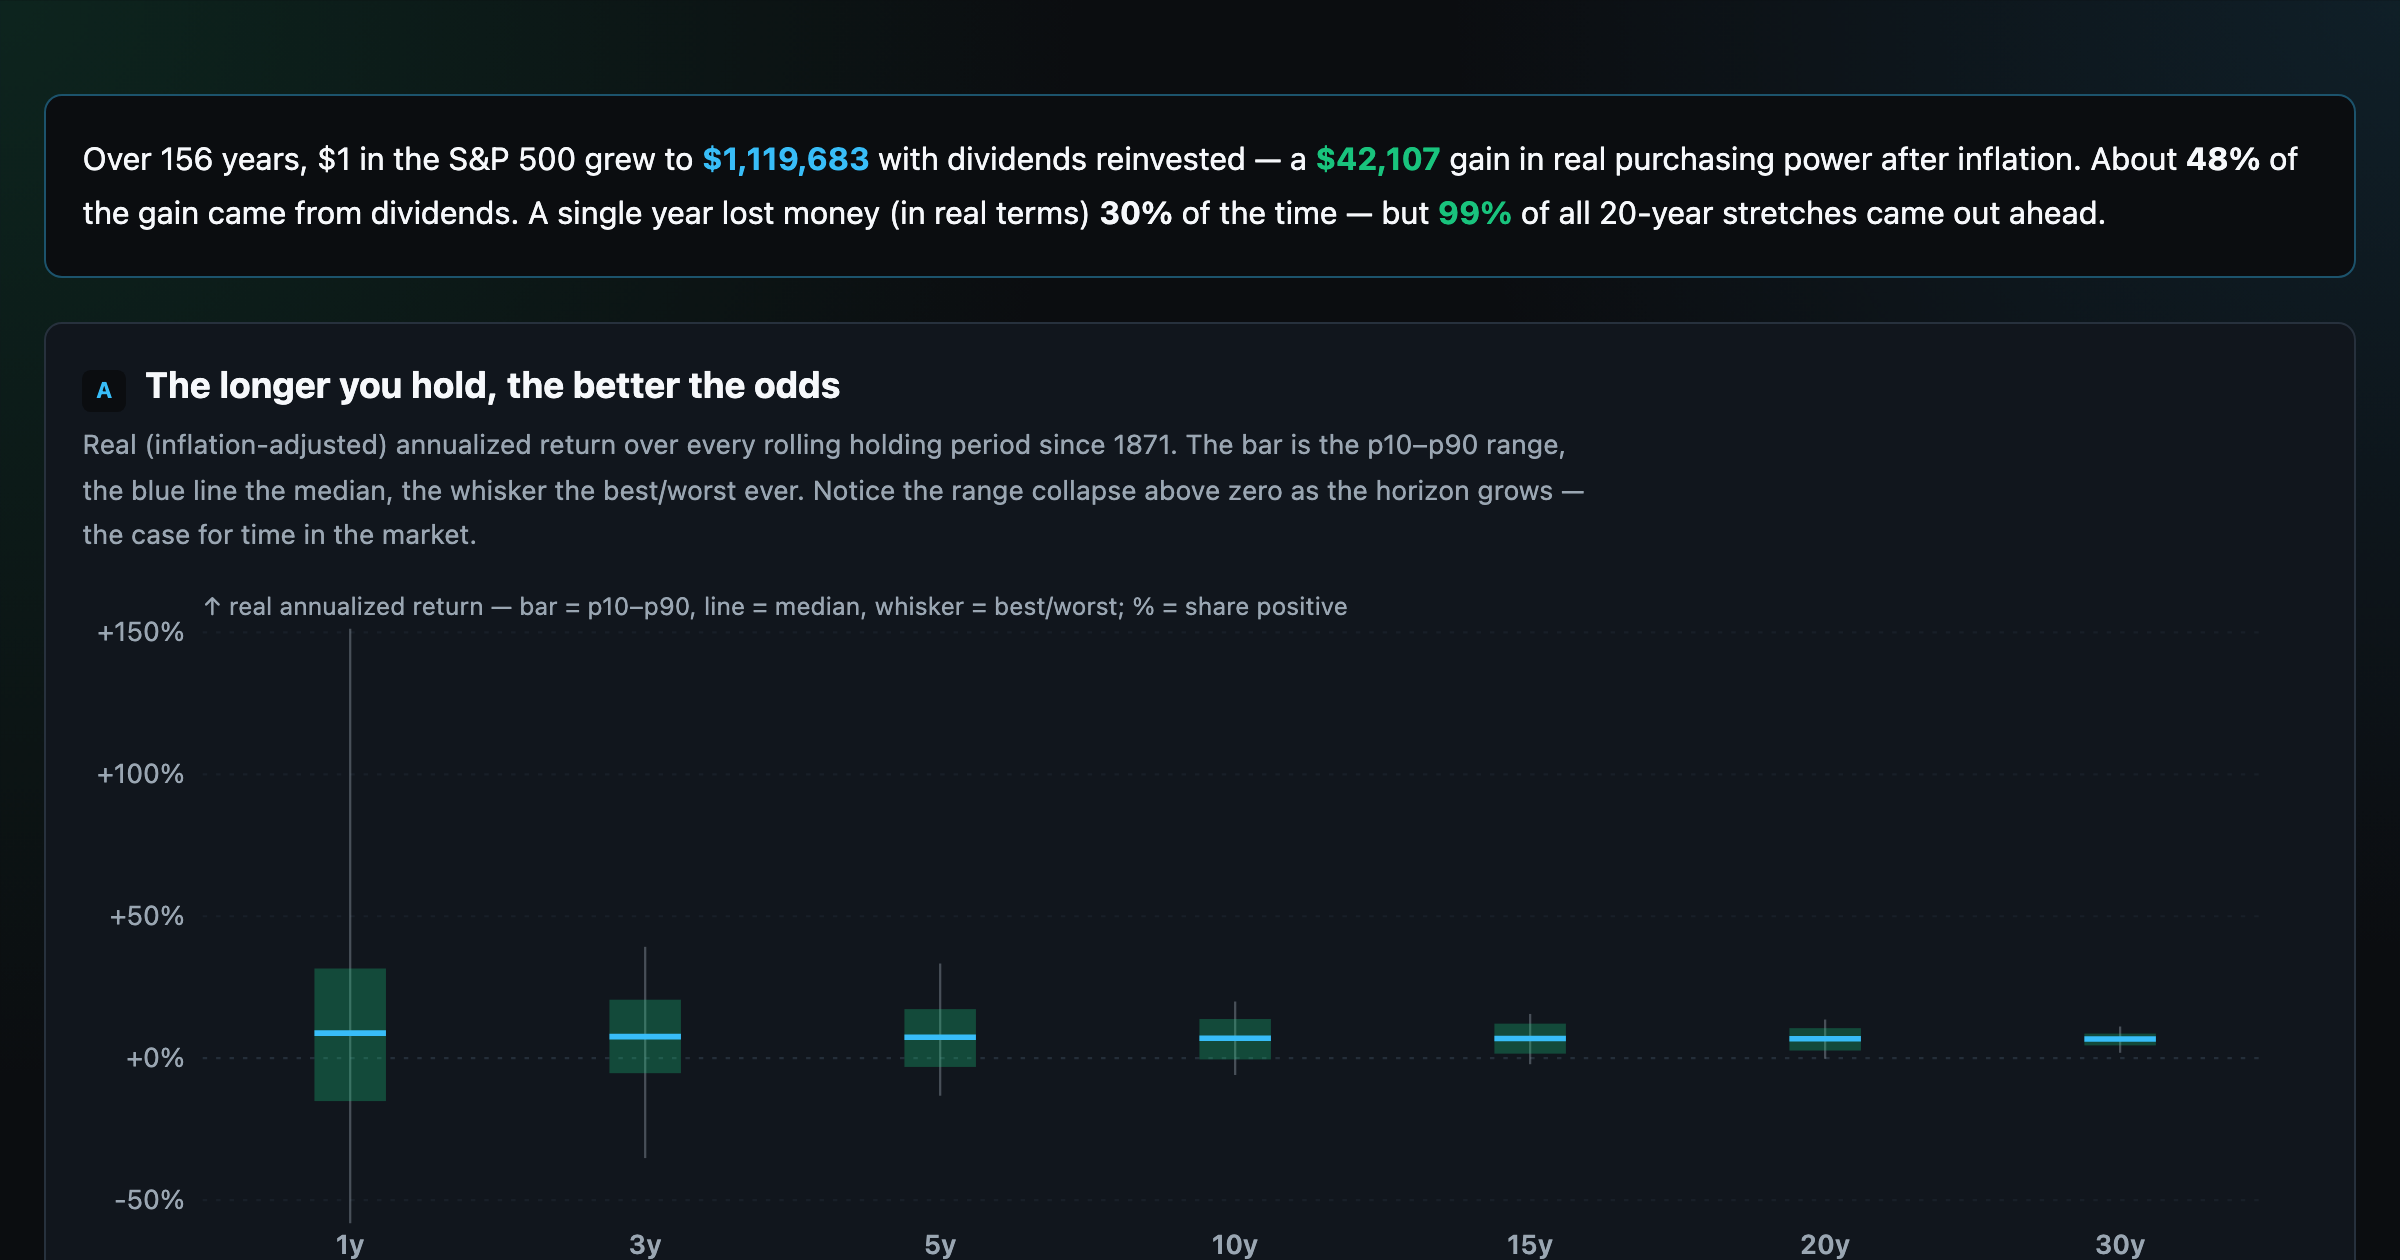
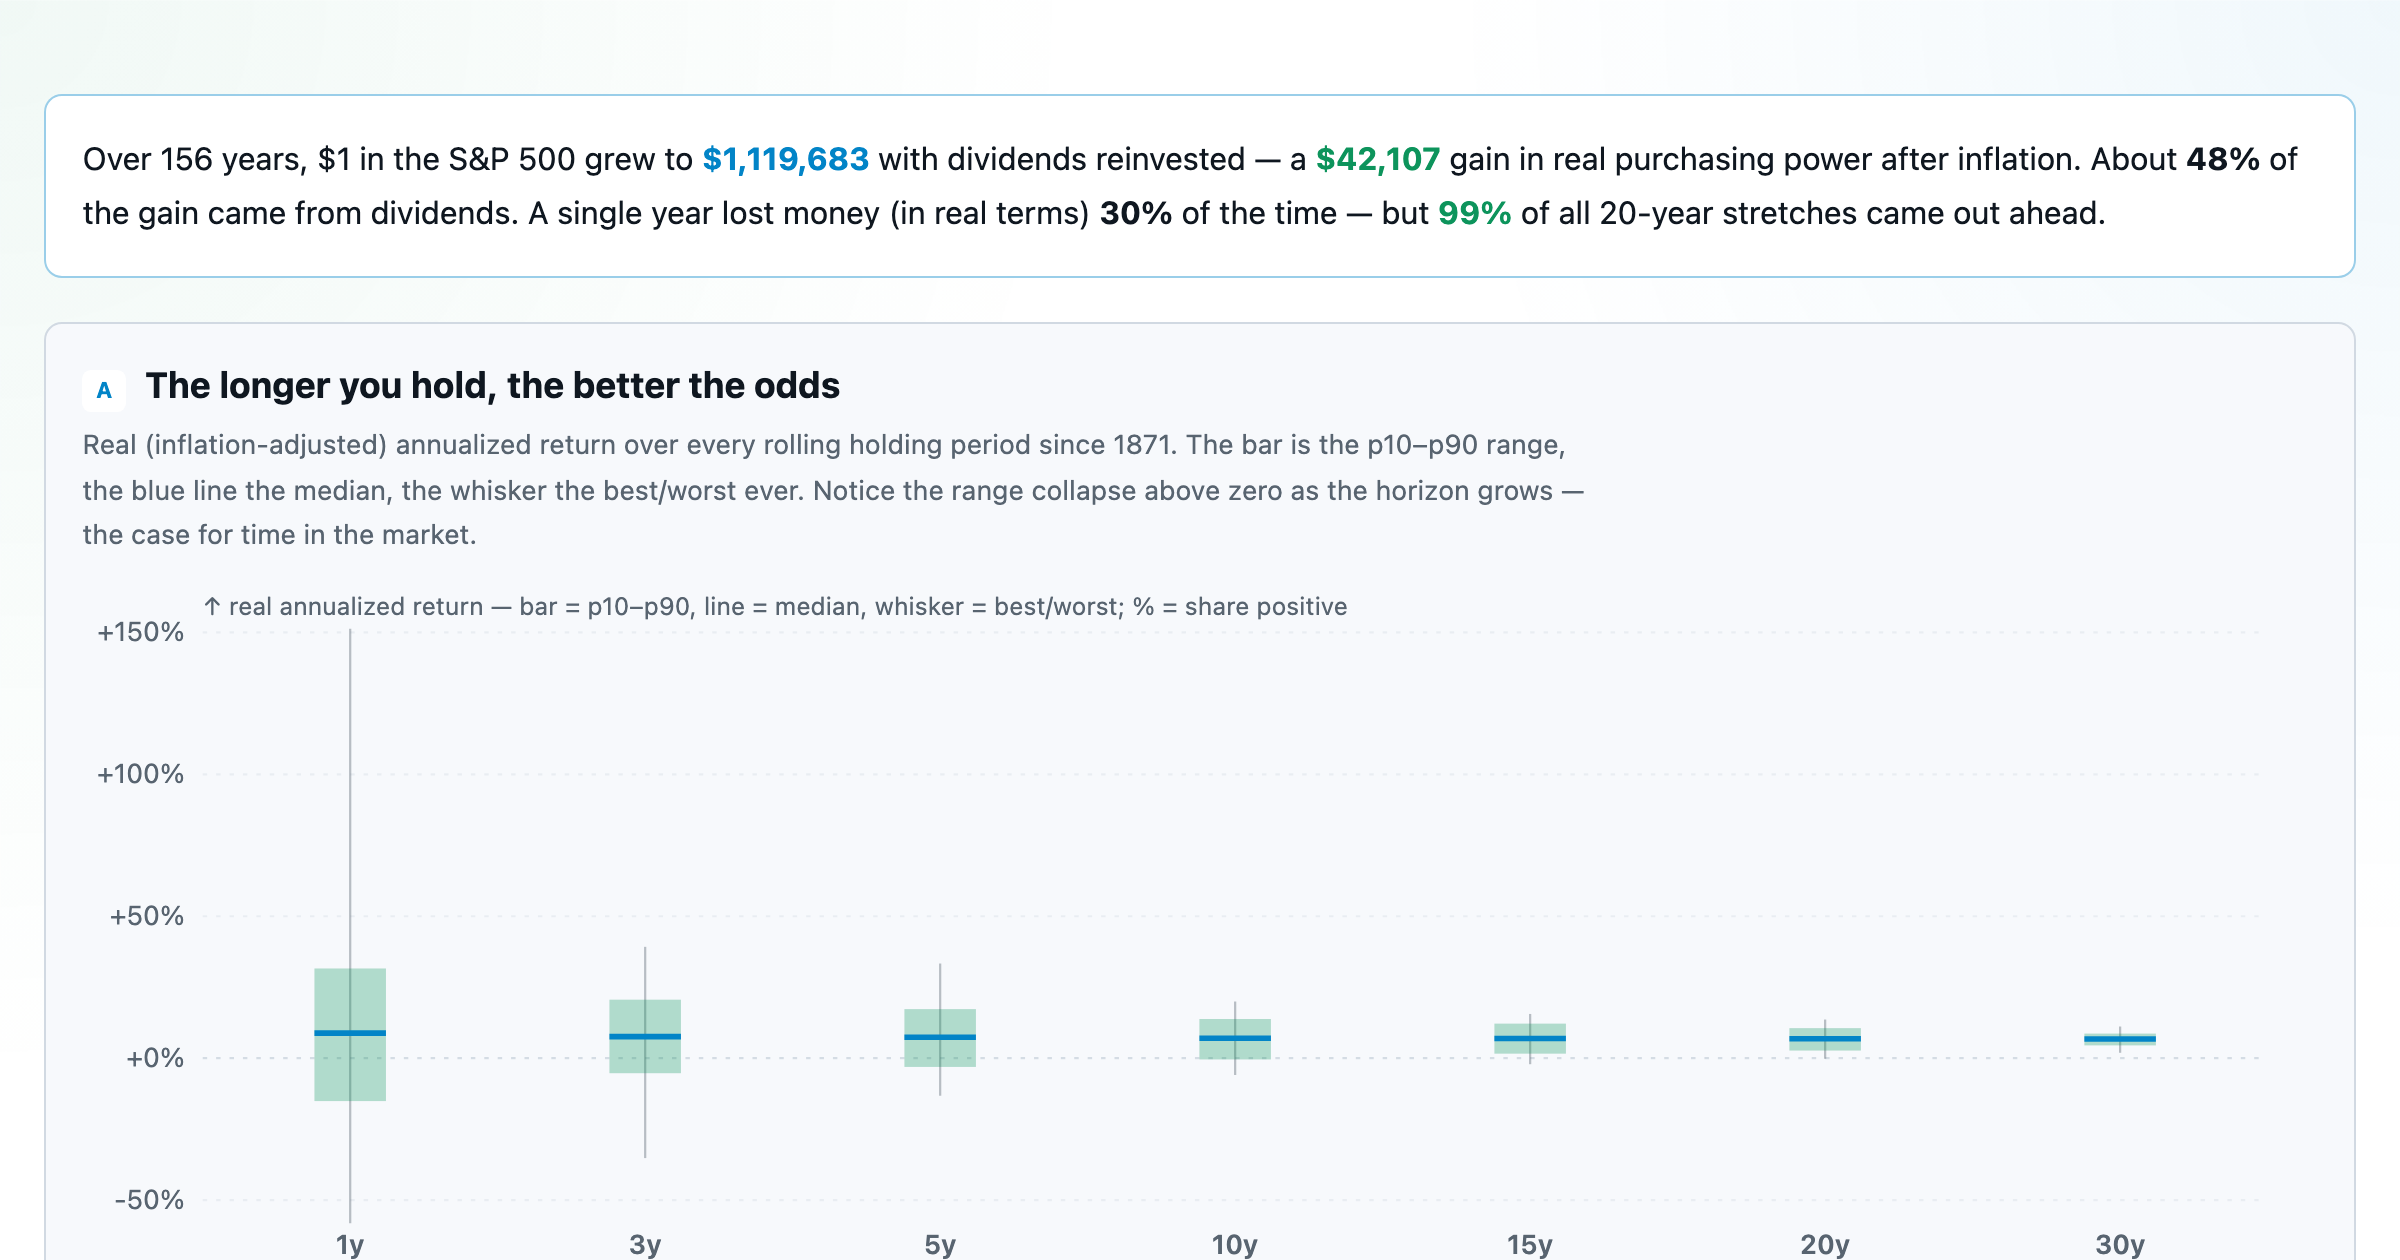
The S&P 500 since 1871 — odds of gain by holding period, real drawdowns, and the growth of $1.
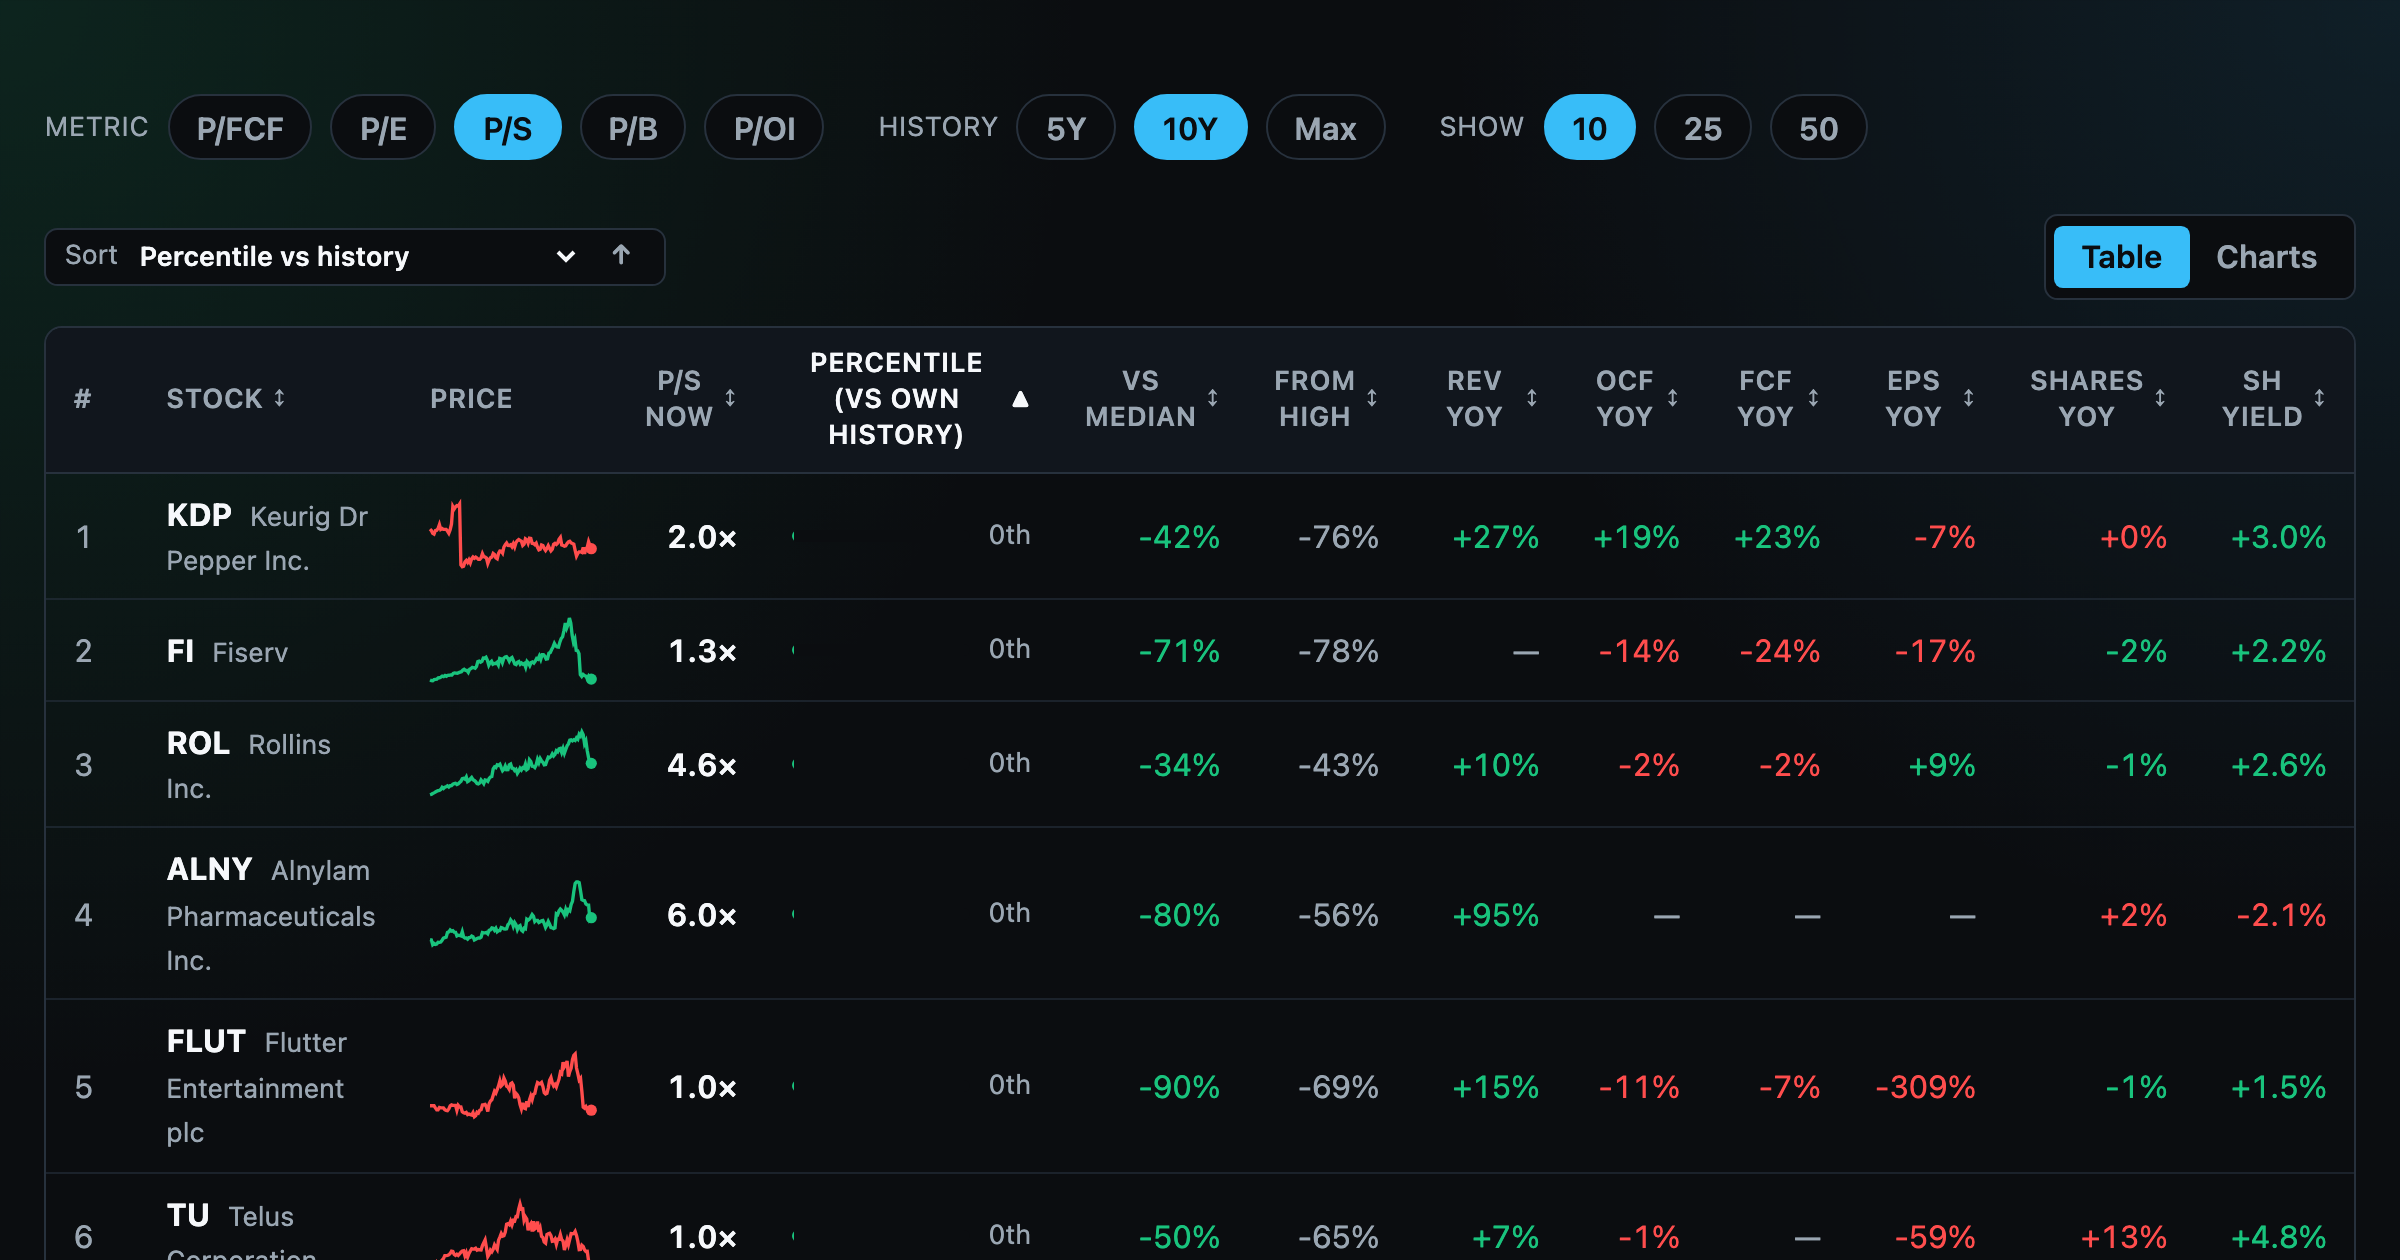
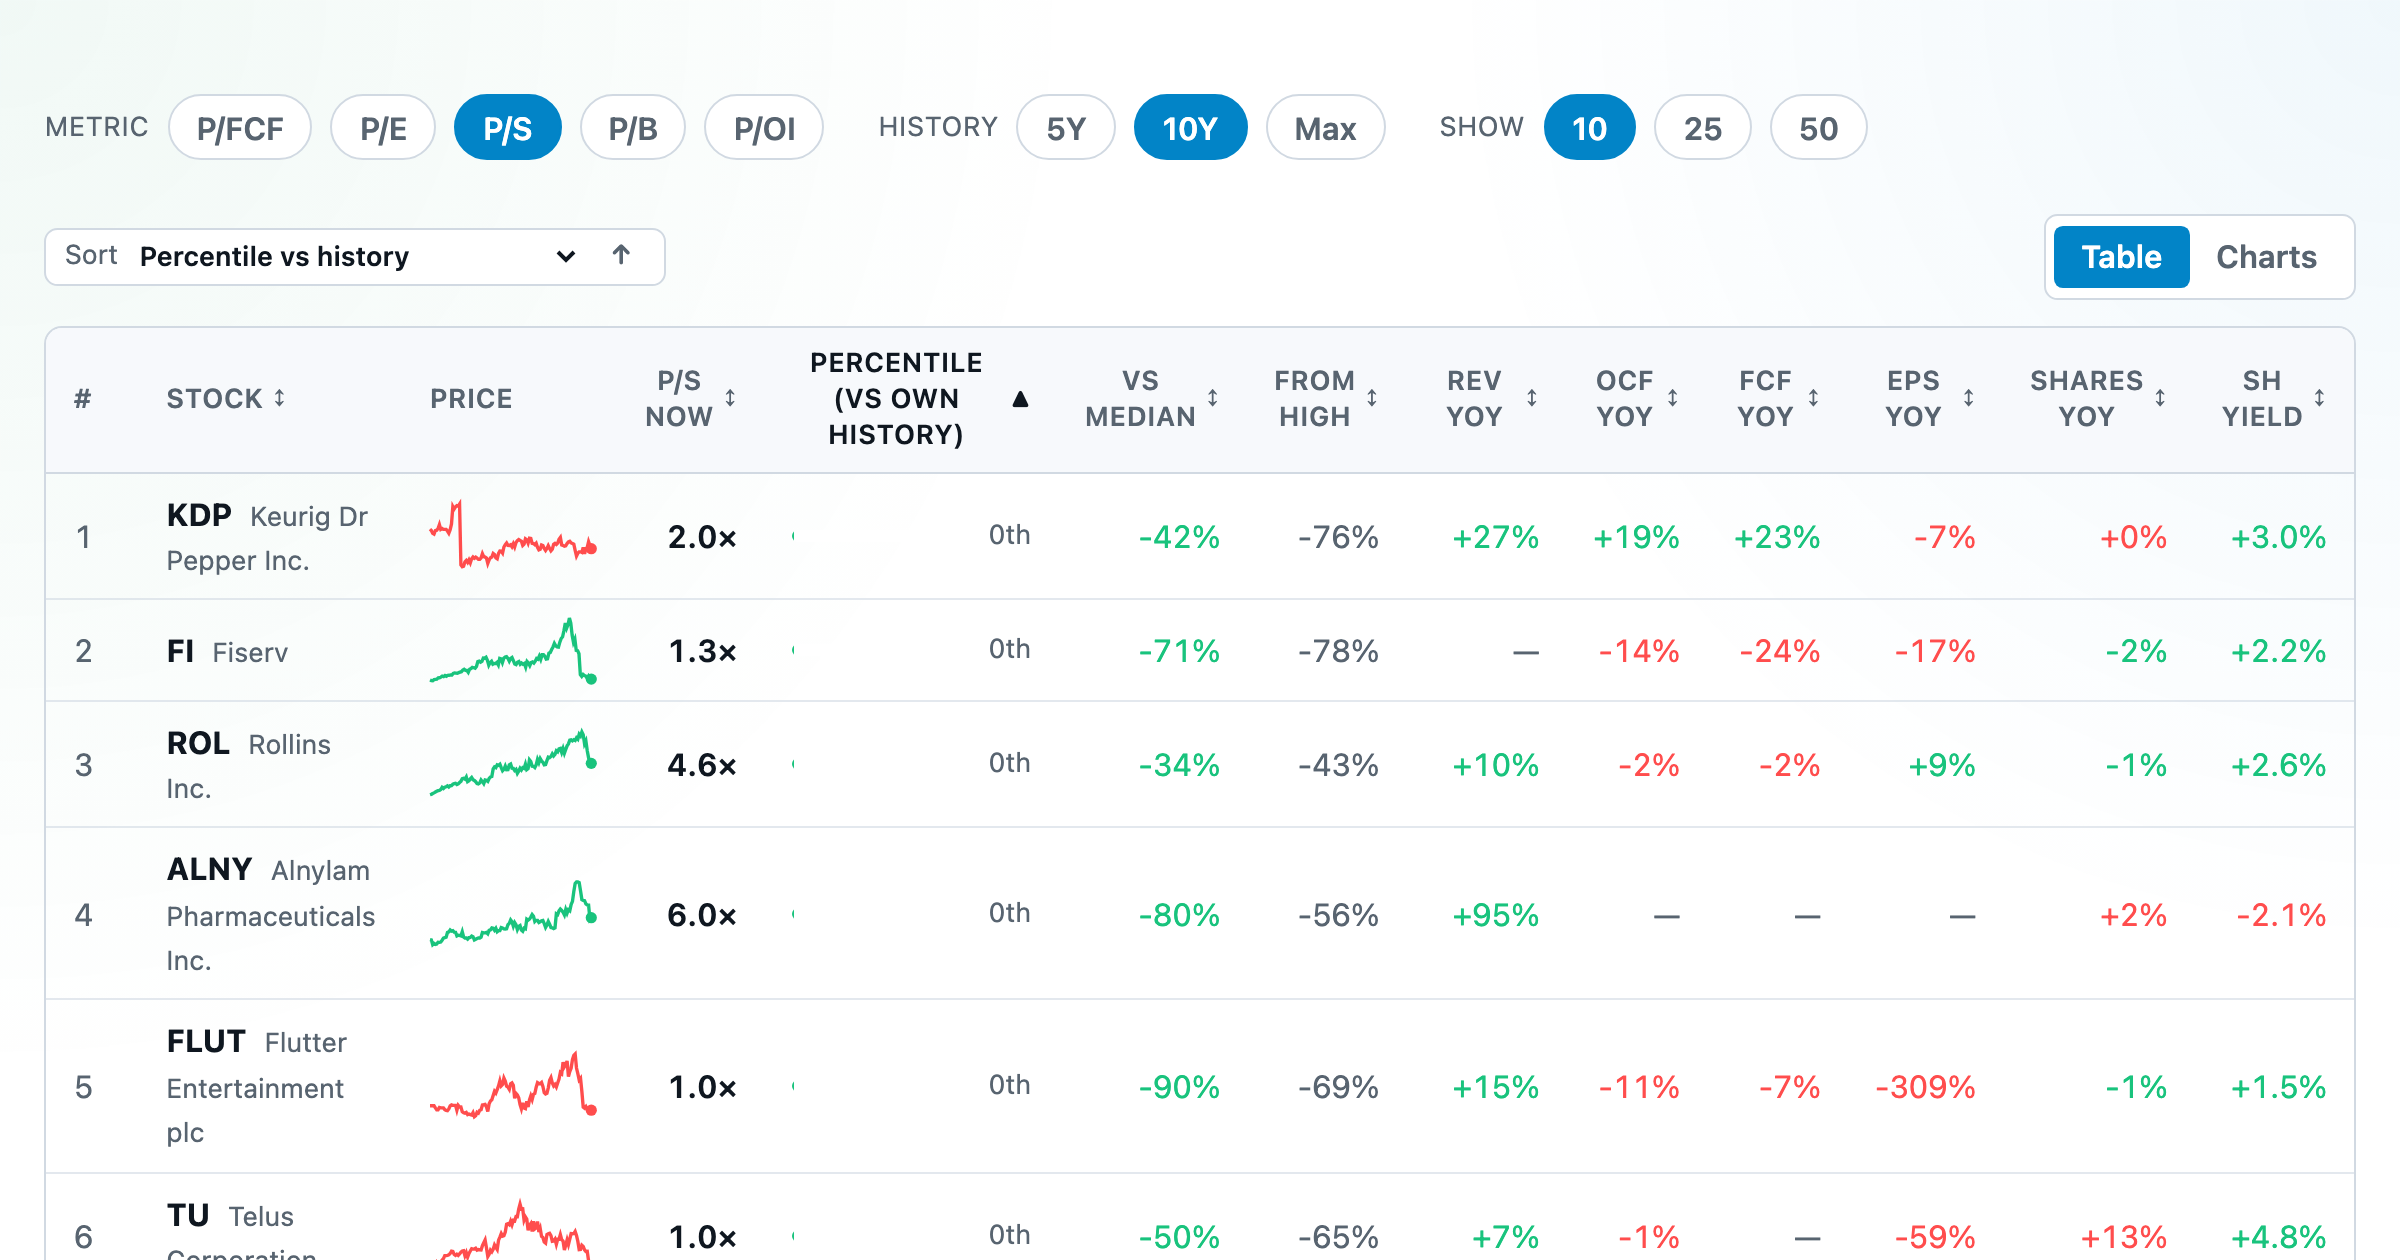
Stocks trading cheapest relative to their own P/E, P/FCF, P/S, or P/B history — with fair-value bands.
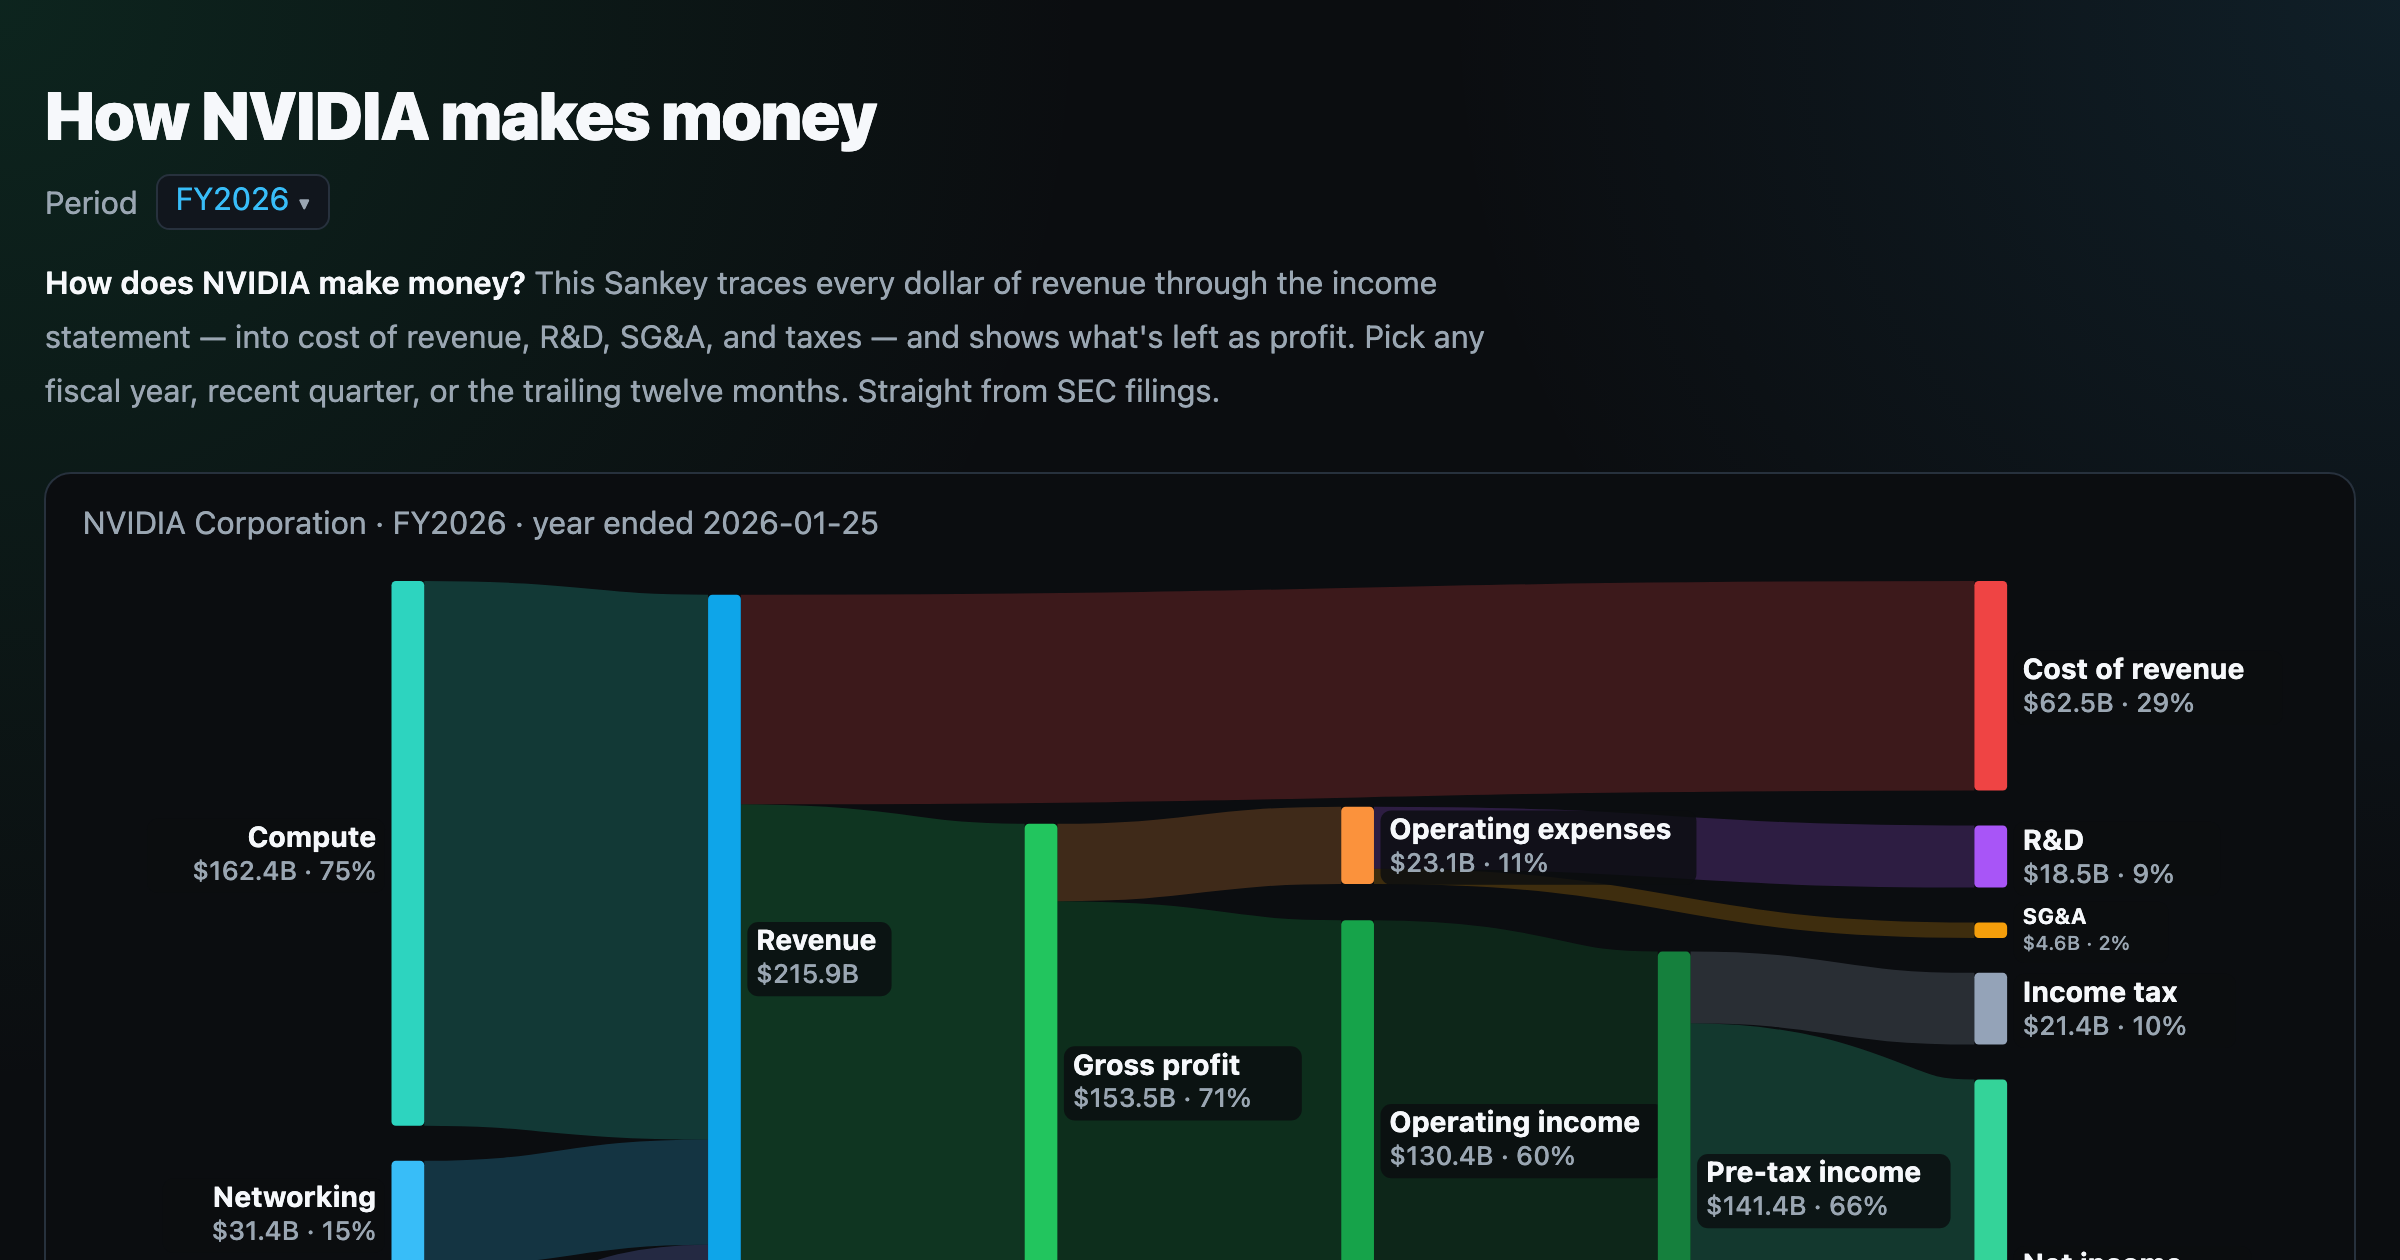
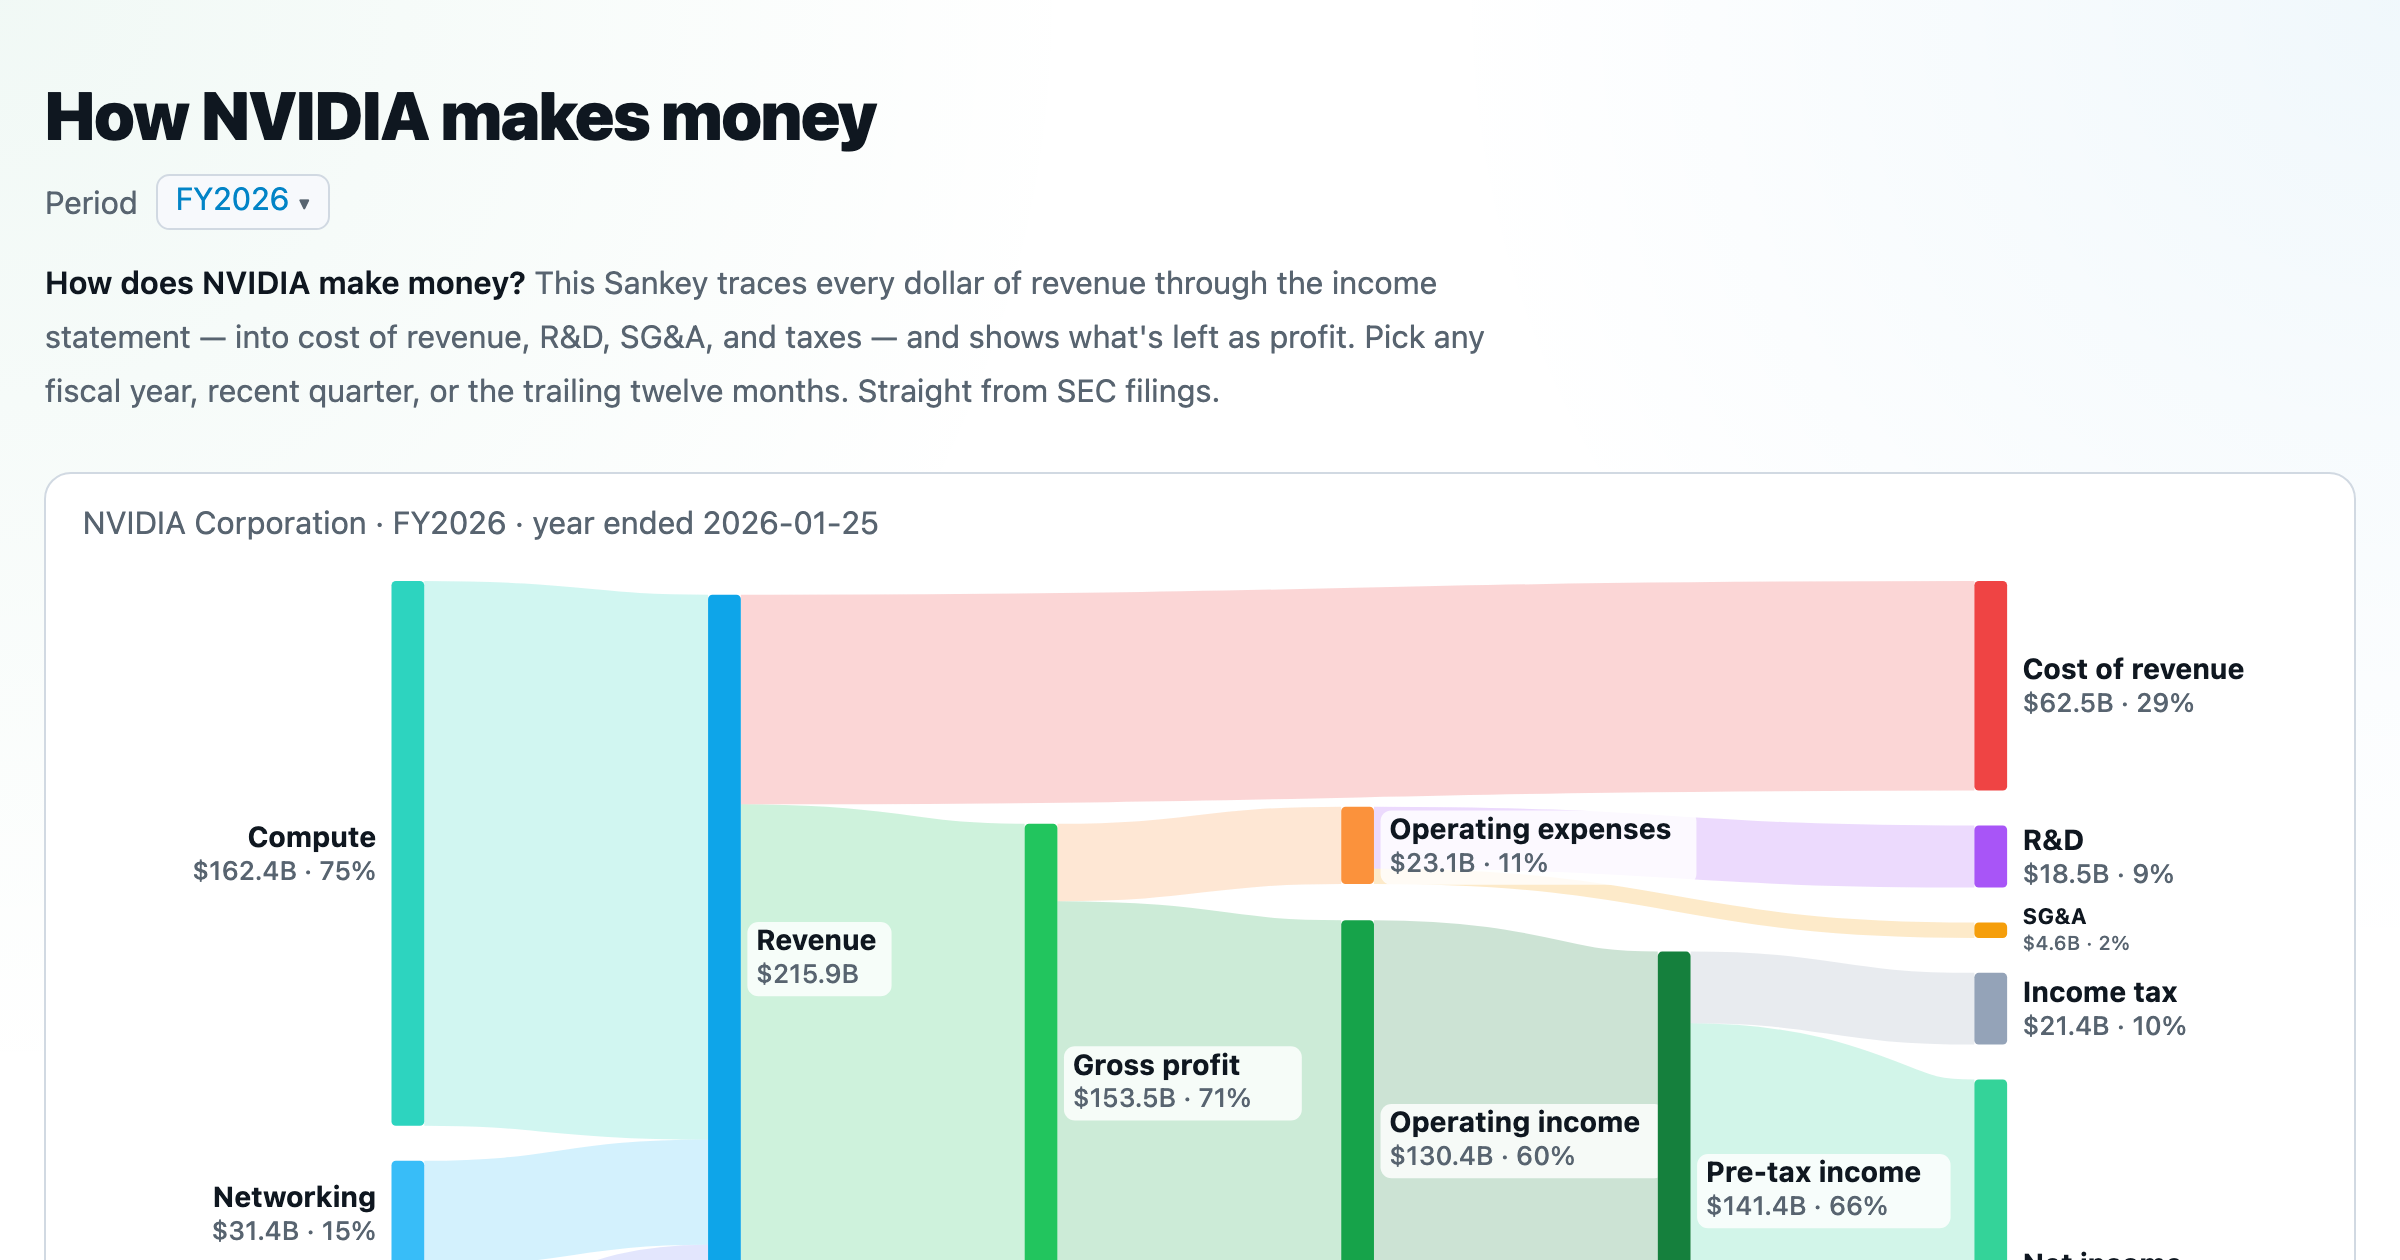
Follow a company's revenue through its income statement as a Sankey — costs, taxes, and profit.
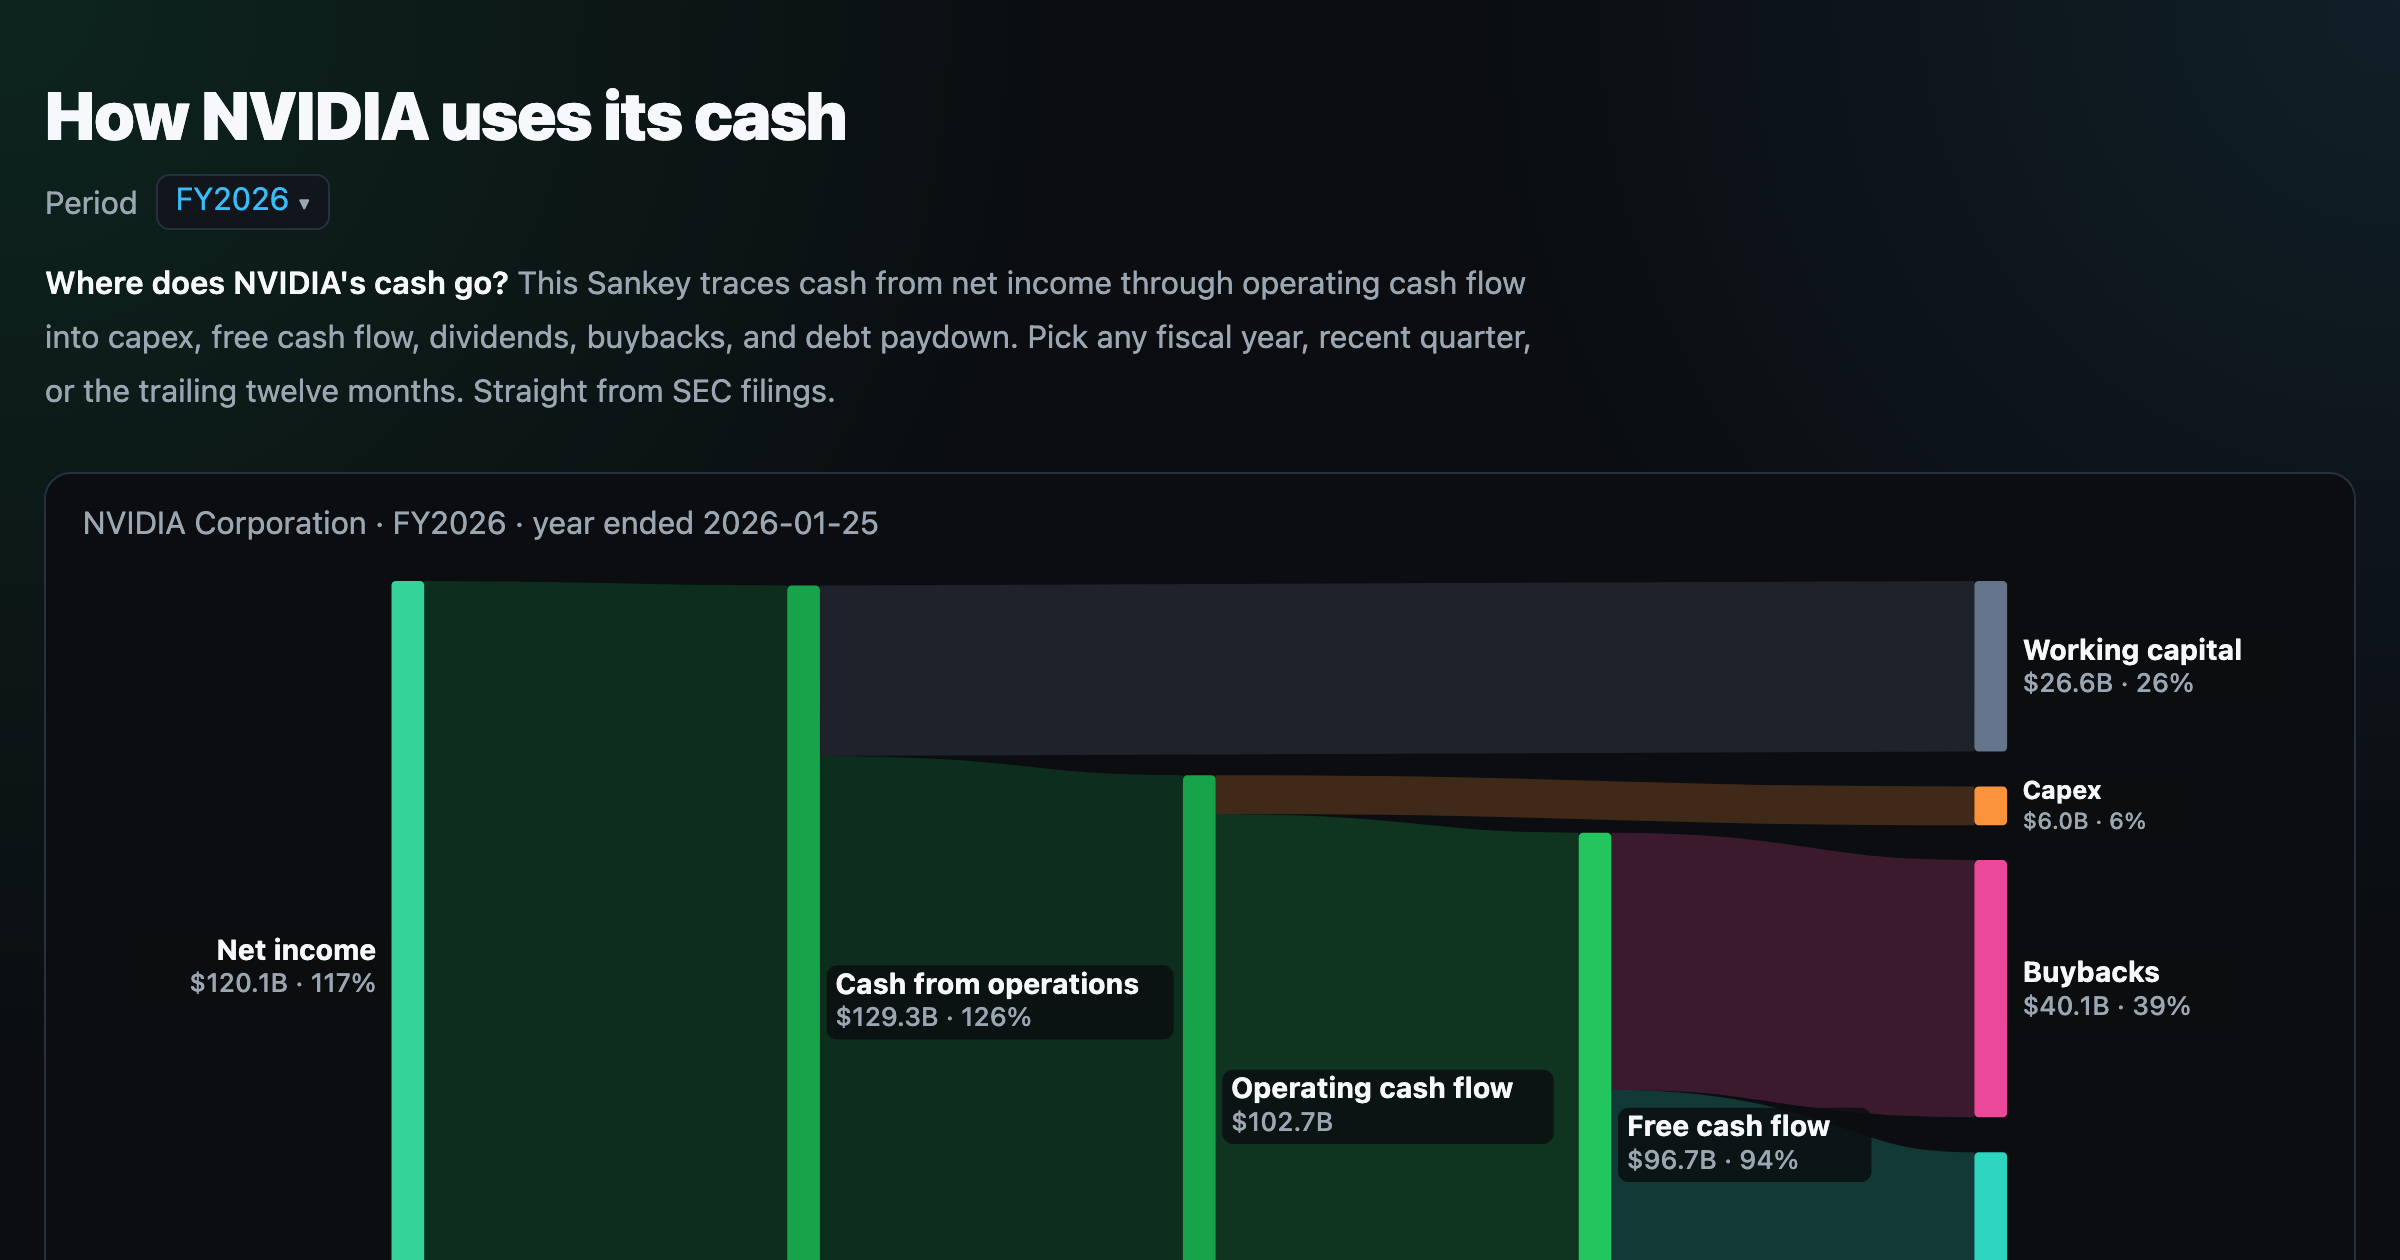
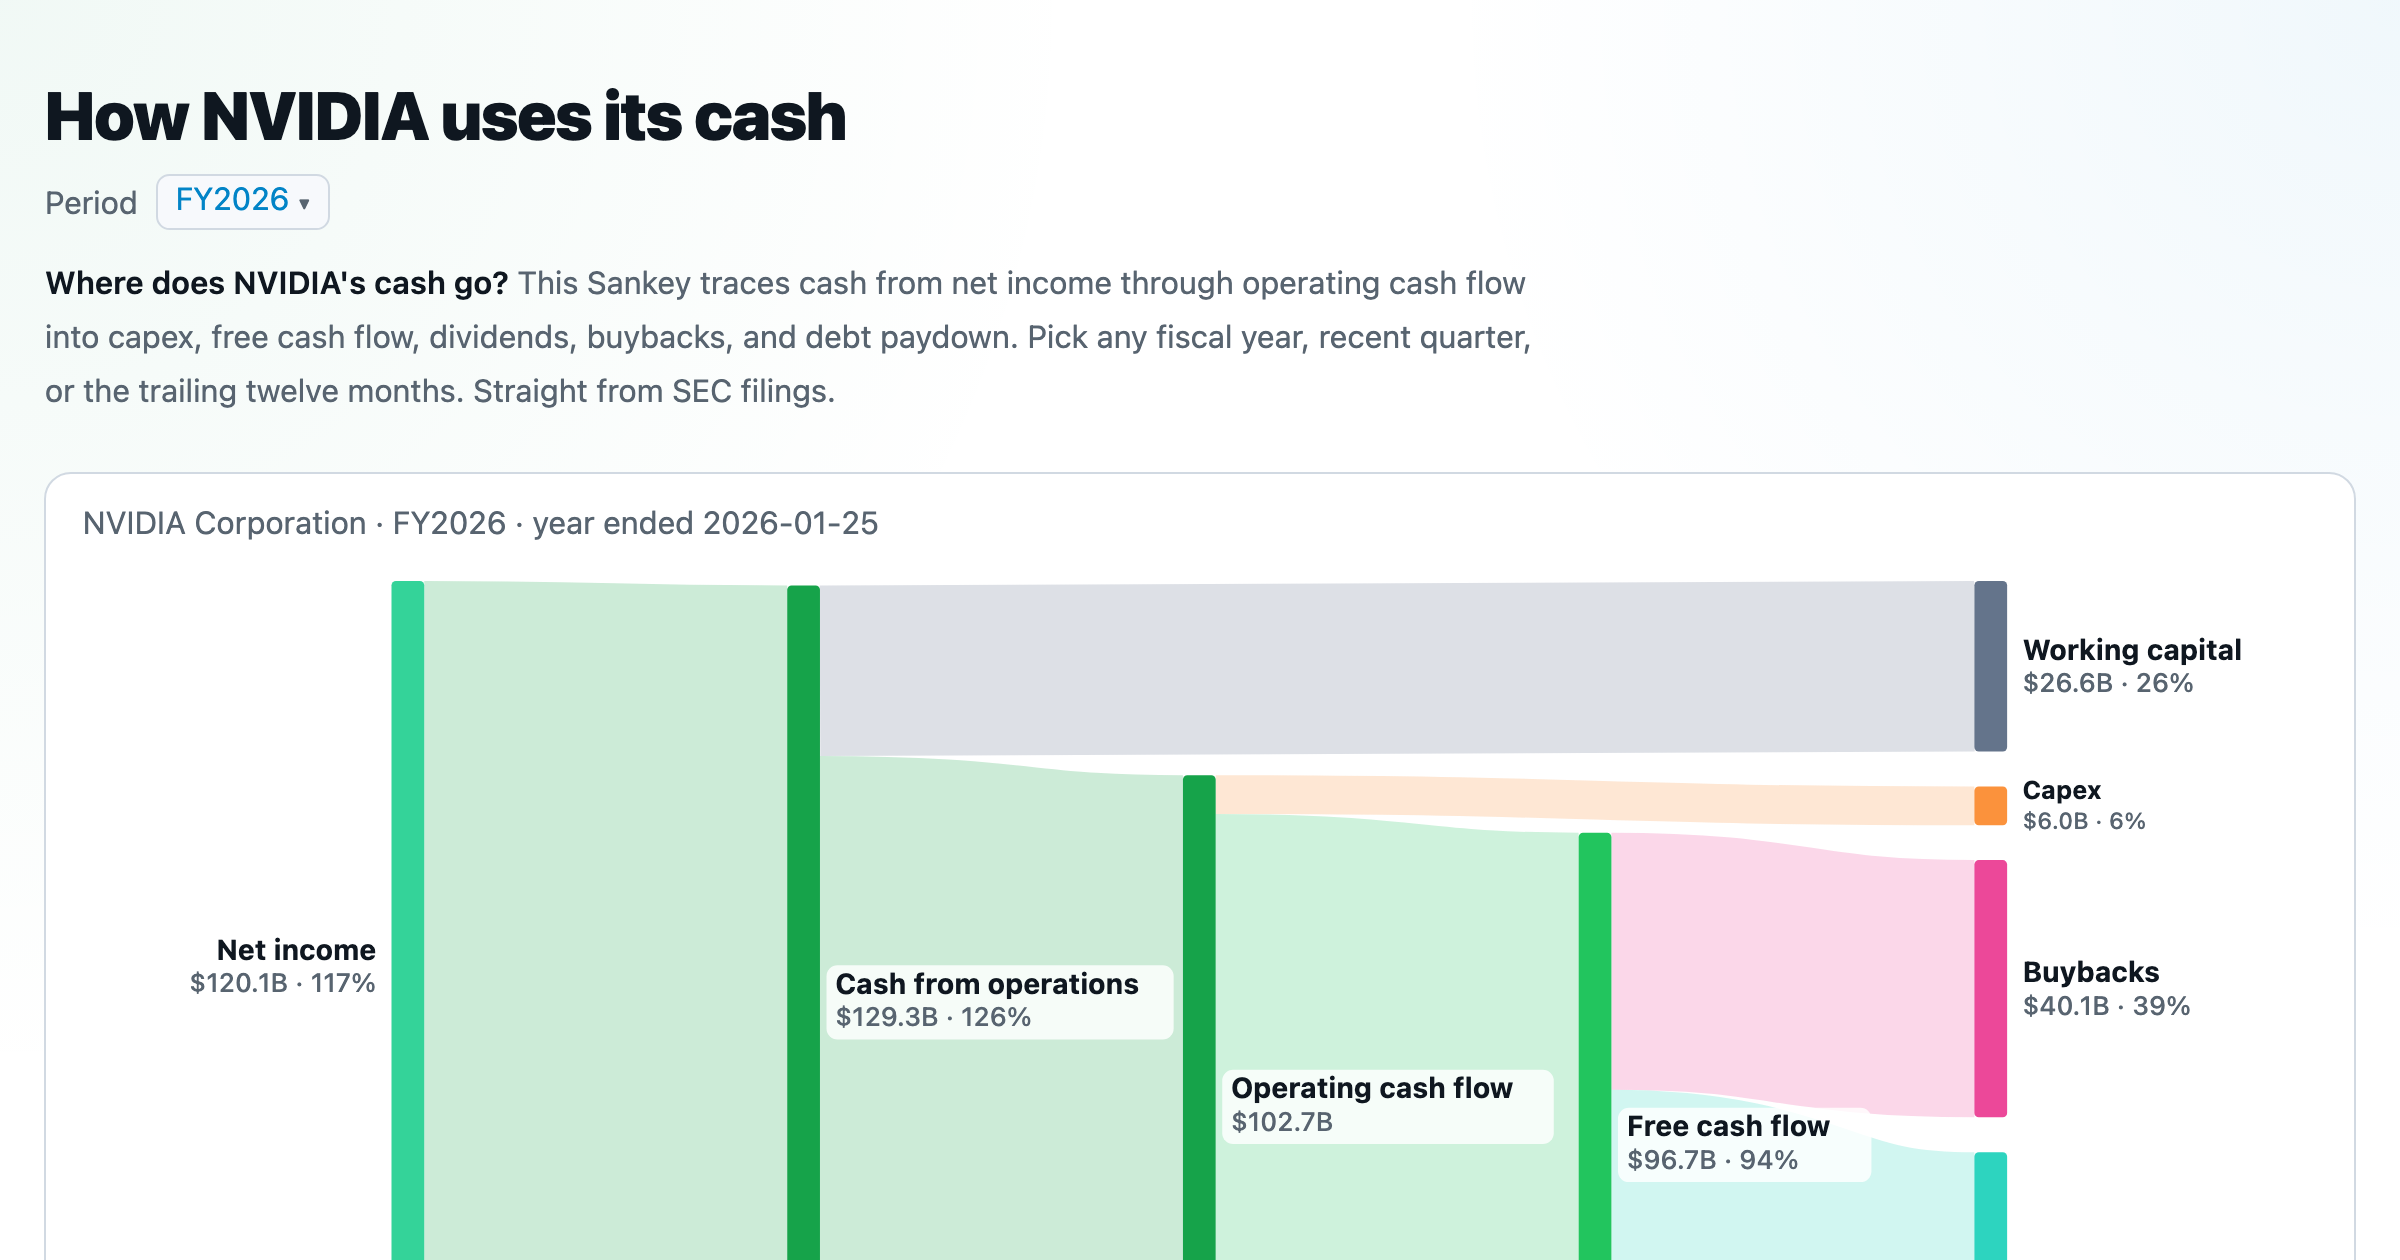
Follow a company's cash from net income through operating cash flow into capex, buybacks, and dividends.
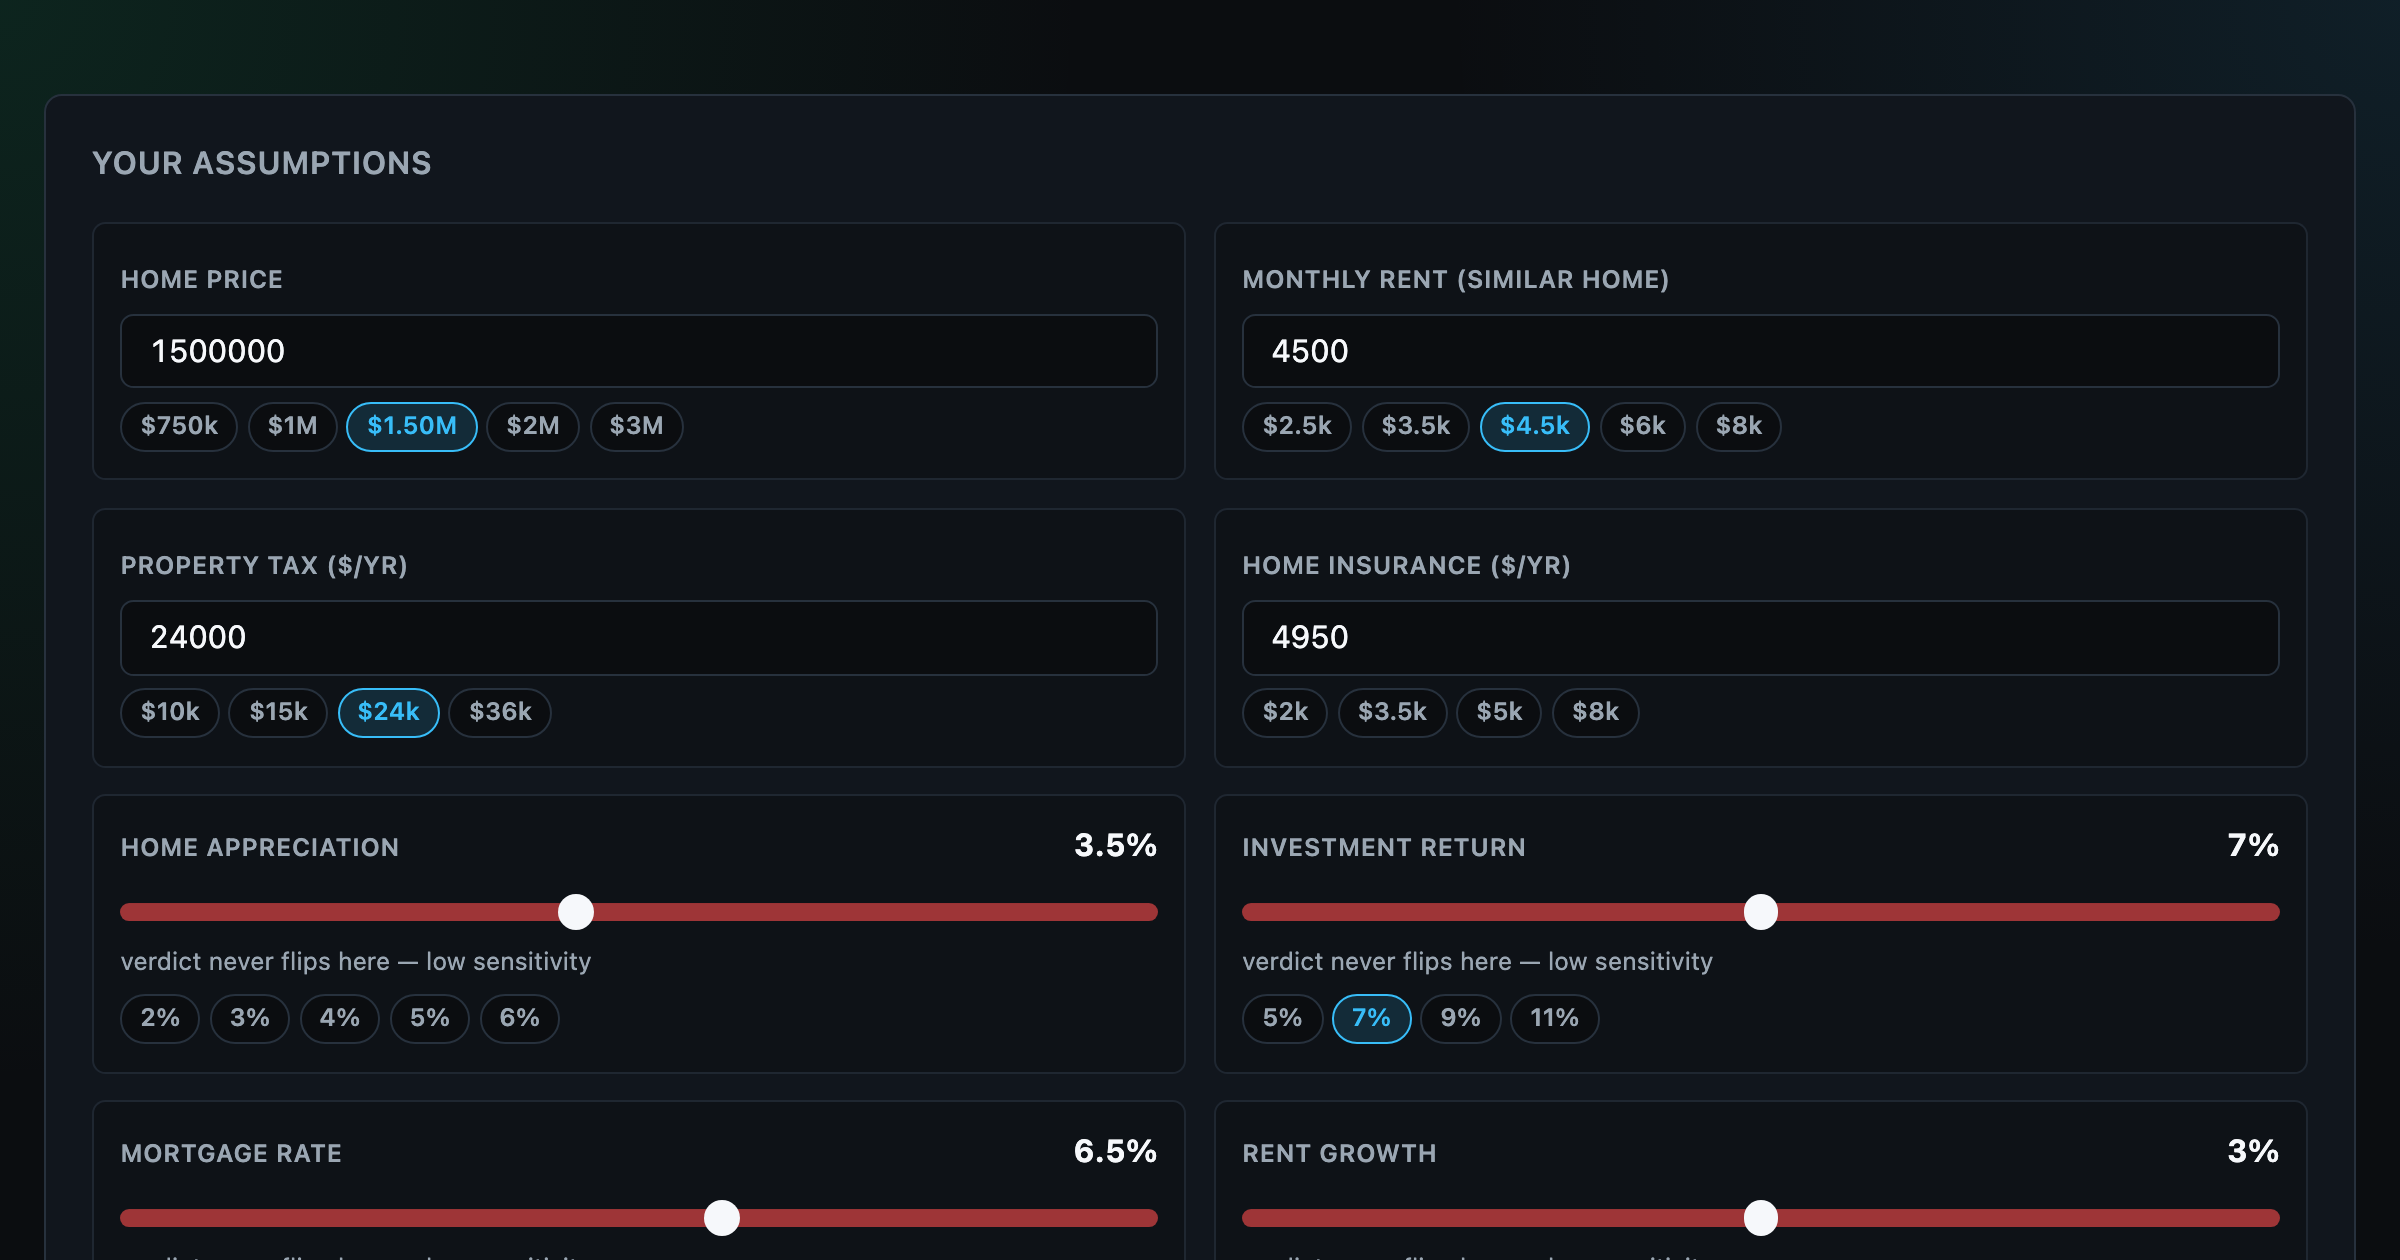
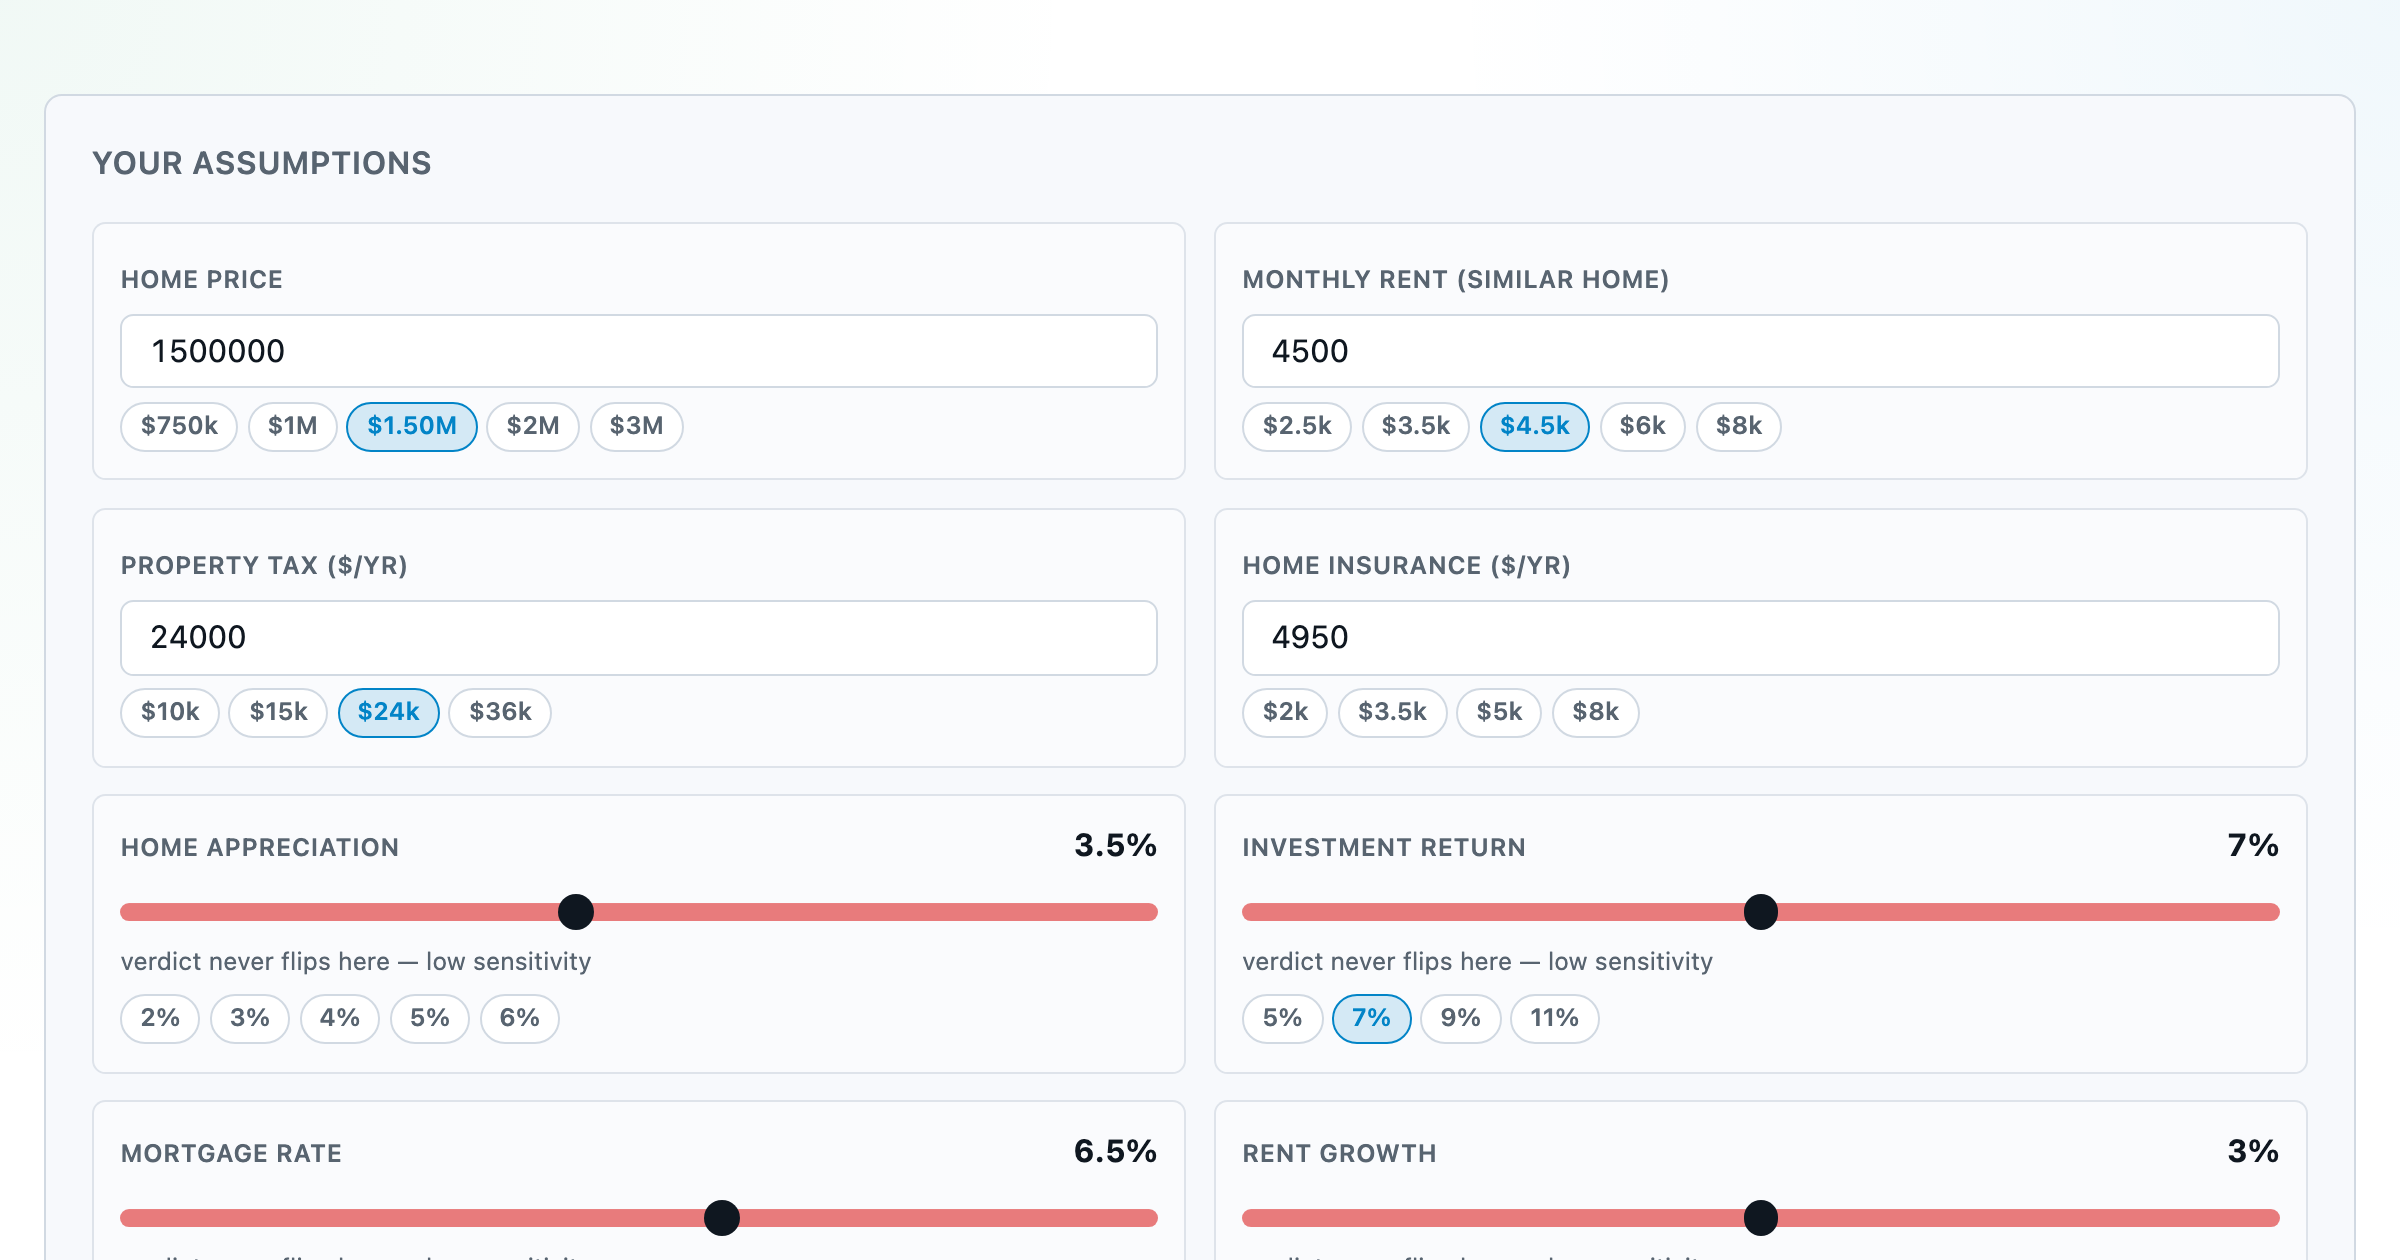
Should you rent or buy? Net-wealth verdict with sensitivity analysis of every assumption.
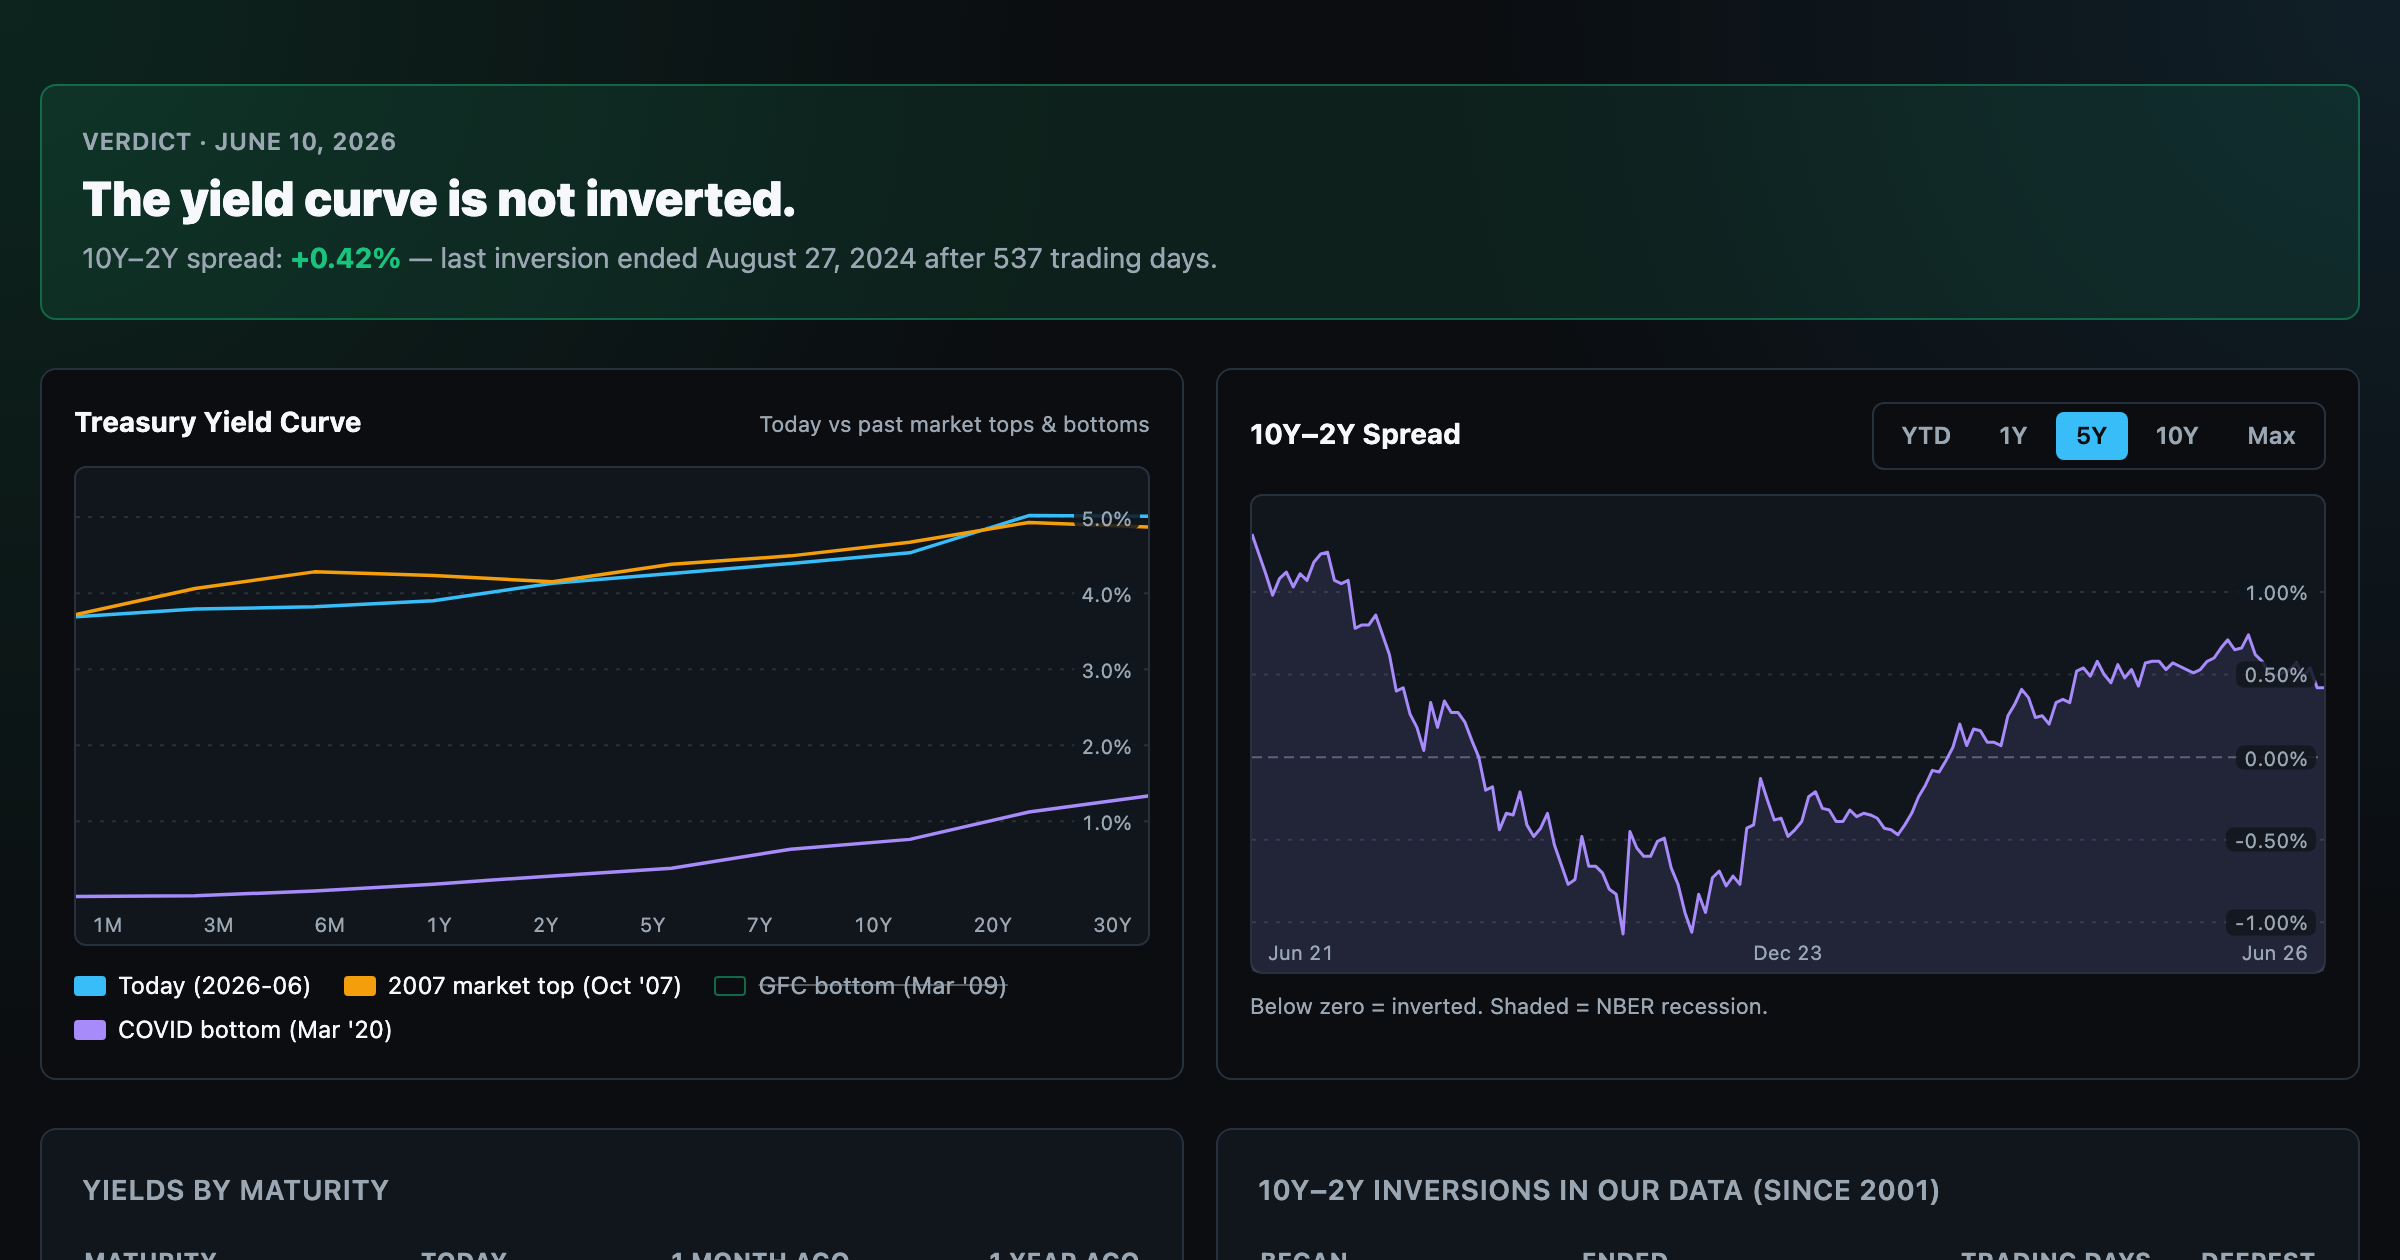
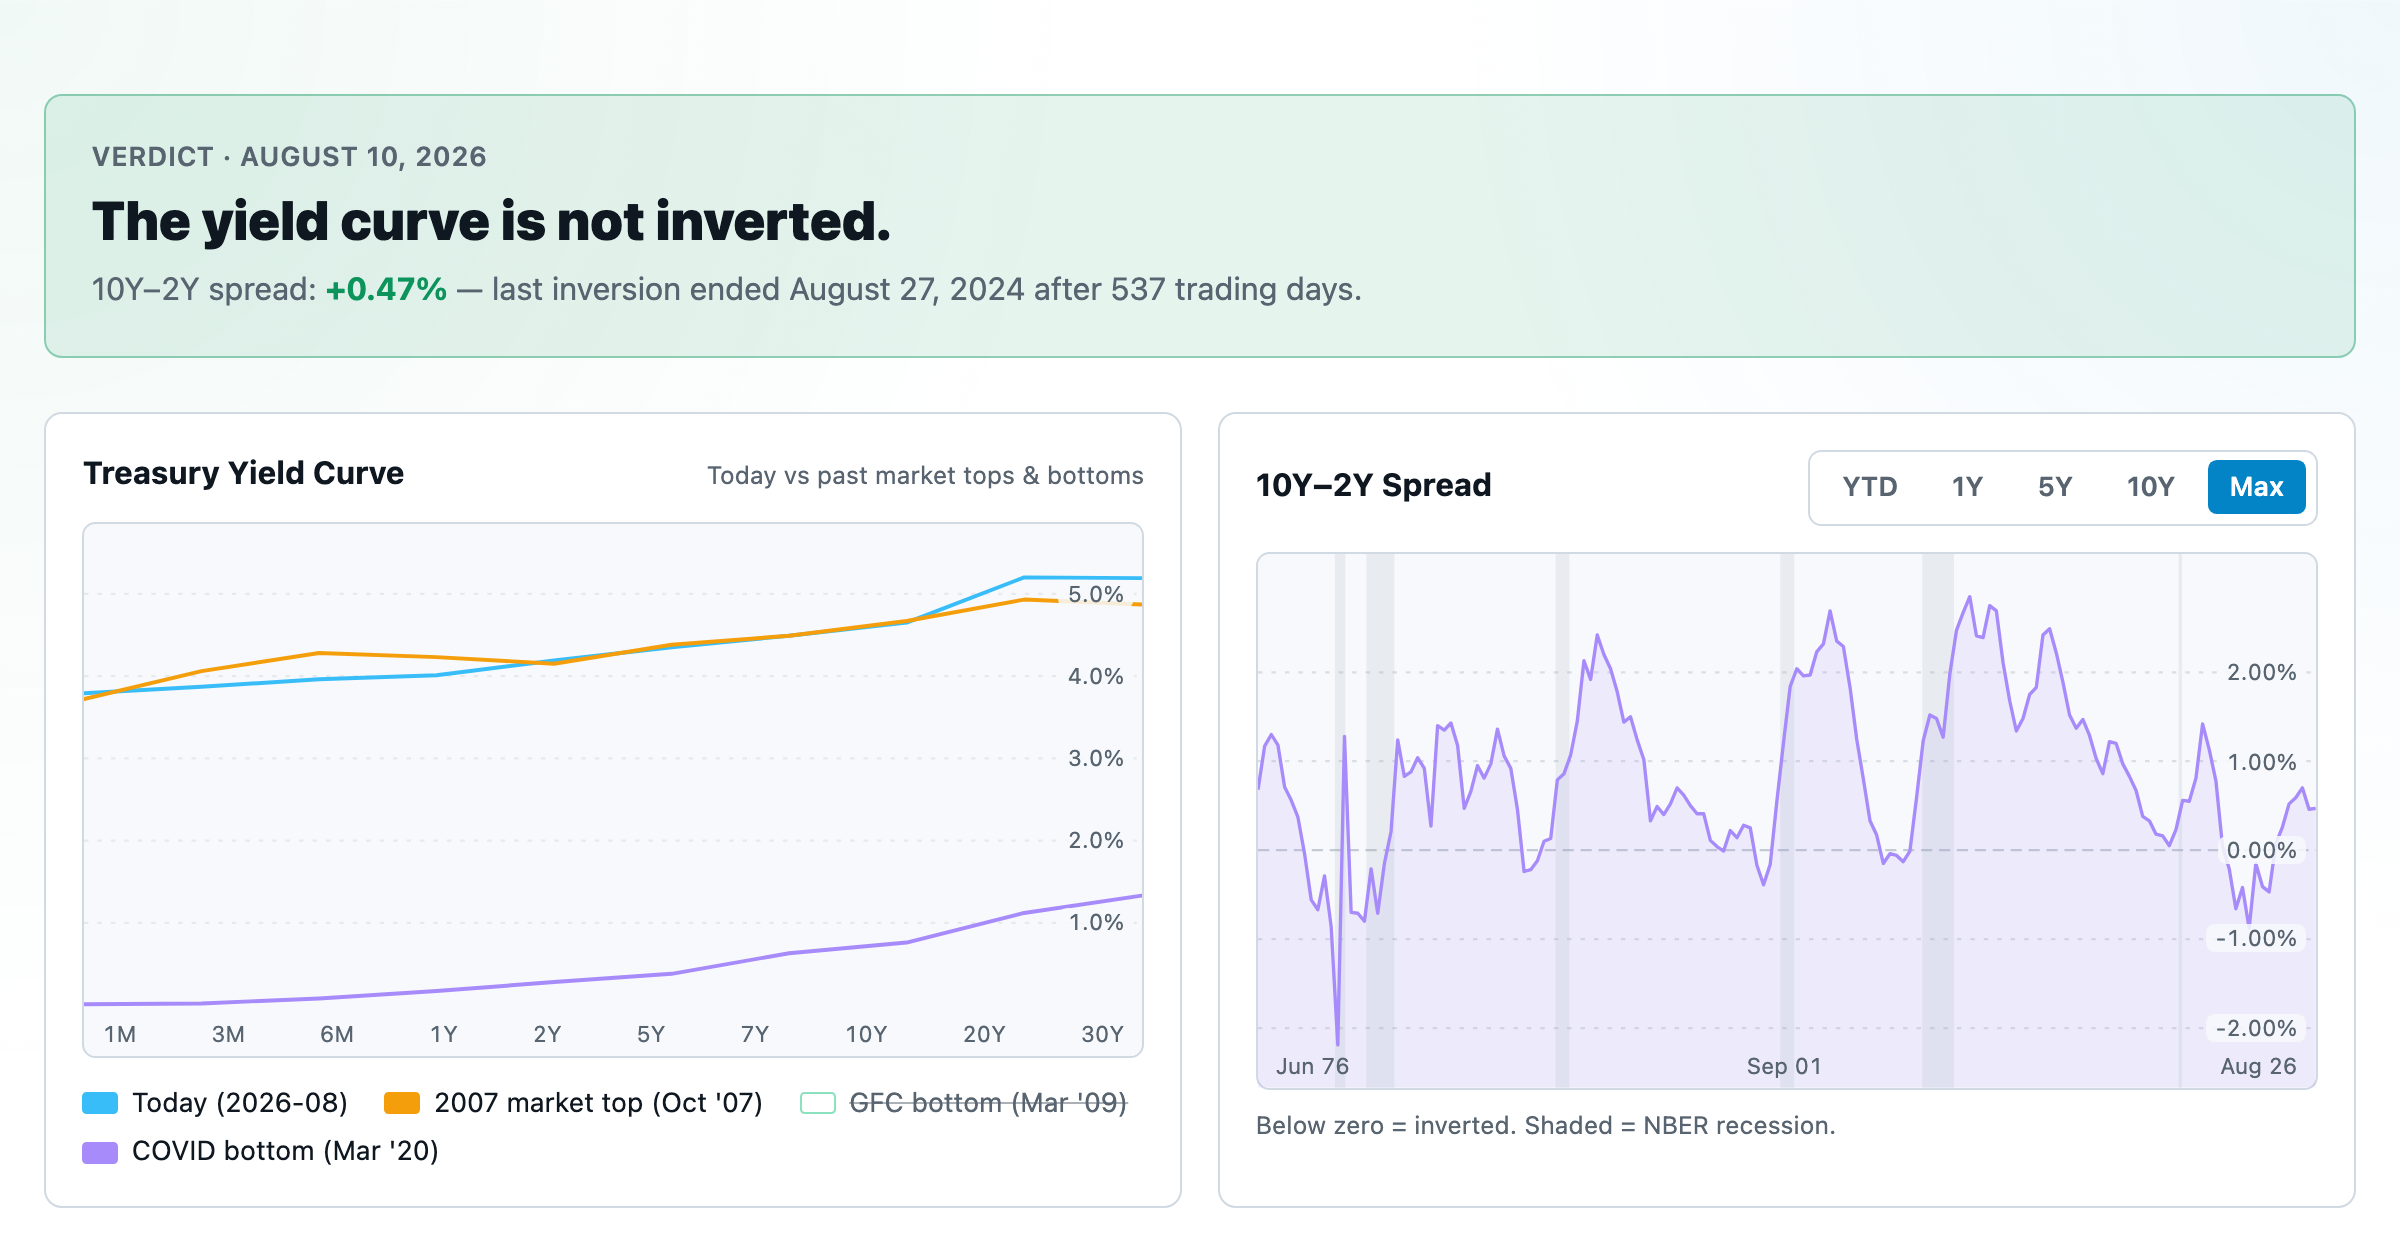
Live term structure, the 10Y–2Y spread, and every inversion episode.